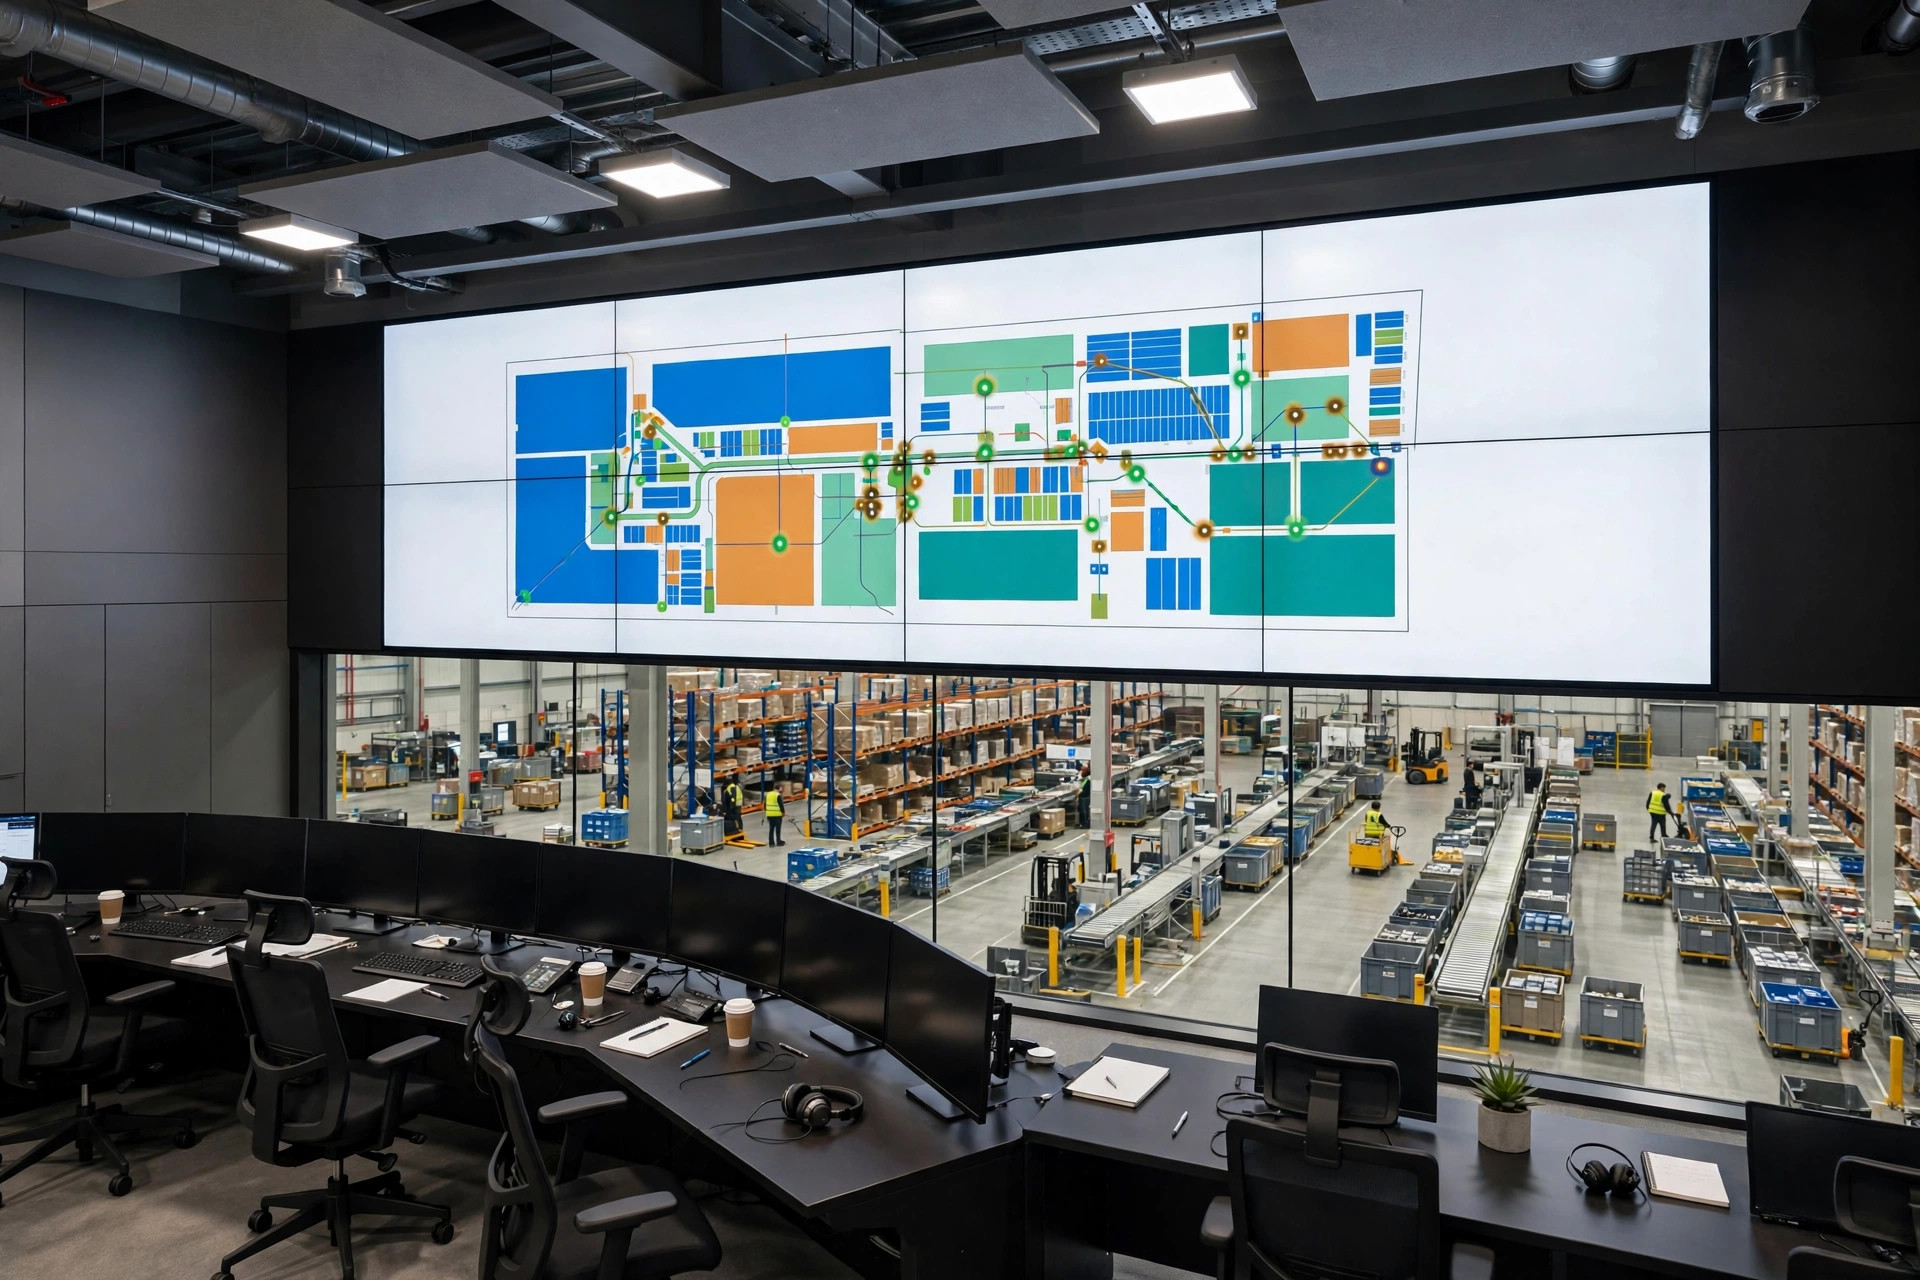
Here's my conclusion up front: when wave UPH drops, check the wave structure first, then the people.
Wave structure sets the ceiling on picker performance. Get the structure wrong and no amount of hustle fixes it. Get it right and most of the "slowness" disappears on its own. Reverse that order, and you'll end up firing the scapegoat while the real problem stays in the WES configuration.
Why Wave Structure Is the Ceiling
UPH is a simple formula: lines picked per labor hour. Break down the denominator and you get travel time plus pick time plus wait time. The picker only controls the pick itself — the smallest slice of the denominator. Travel routes, wave size, line balance, and release cadence are all decided by wave structure, all living inside the WES wave template.
A counterintuitive call I make in almost every project: bigger waves are not better. Plenty of managers assume more orders per wave means higher density and higher UPH. Wrong. Past a certain line-count threshold, longer travel distances, aisle congestion, and queues at the pack stations eat every bit of the density gain. I've seen UPH drop 20% after wave line counts doubled. More than once.
In August 2024, a footwear 3PL in Moreno Valley, California brought me in. The pattern was textbook: wave UPH had slid from around 120 to the low 80s for three straight weeks. Management had held three performance reviews and was ready to cut the bottom 10% of pickers. I walked into the meeting with wave-level data and one question: is it a few people, or everyone?
It was everyone — and every wave in the same time window dropped together. People problems don't move that uniformly. Structural problems do.
The root cause: two months earlier they had rolled out an automated replenishment flow and quietly raised the wave template's line cap from 40 to 80, hoping to "release fewer, bigger waves." Average lines per wave climbed from the low 20s to over 45, with single waves regularly spiking to 70. Pickers were walking twice the distance, queues formed at pack stations, wait time ballooned. Of the roughly 40 UPH points lost, at least 30 belonged to structure, not people.
The fix was straightforward: split waves by line count, give single-line orders their own waves, separate multi-line orders into another stream, and set the line cap back to 40. Two weeks later UPH was back around 115. Not one person was replaced.
The Four-Step UPH Diagnostic: Run Them in This Order
The order is the conclusion: structure first, people second. Each step has a defined input and output. No gut feelings allowed.
Step 1: Pull data by wave, not by person.
Export 14 days of wave-level data from the WES — five fields: wave number, UPH, total lines, order count, SKU count. Wave-level, not person-level. The per-person UPH ranking board is for the morning huddle, not for diagnosis. Diagnosis starts with structure, so it starts with waves.
If your system can't produce wave-level UPH, log that report request now. It's the foundation for everything that follows. Without wave-level data, the rest is guessing.
Step 2: Run two variance comparisons. Five minutes, direction decided.
Take the Step 1 data and run two comparisons. The answer presents itself:
| Compare | You see | Verdict | Next step |
|---|---|---|---|
| UPH across waves in the same shift | High variance — some waves fast, some slow | Structure problem | Move to Step 3, check structure metrics |
| UPH across pickers within the same wave | High variance — fast and slow pickers in one wave | People problem | Check training, technique, shift assignment |
| Both variances small, but overall below three months ago | Uniform decline | A parameter changed or order mix shifted | Check the parameter change log and order profile |
This table is the heart of the diagnostic. In the Moreno Valley case, Step 2 settled it: huge variance between waves in the same shift, tiny variance between pickers in the same wave. Structure. Confirmed.
Step 3: Check four structure metrics.
Once structure is the verdict, walk through these four numbers. Each comes with what the anomaly means and which parameter to touch:
| Structure metric | Red flag | What it means | Parameter to adjust |
|---|---|---|---|
| Average lines per wave vs. three months ago | Up 30% or more | Waves too big; travel cost eats the density gain | Wave line cap, order cap |
| Line-count spread (largest wave / smallest wave) | 3x or more | Big and small waves mixed; small-wave pickers wait, big-wave pickers rush | Release waves tiered by line count |
| Wave SKU concentration (top 10 SKUs' share of lines) | Well below historical average | Hot SKUs scattered across waves; pickers run the whole floor | Add SKU velocity to wave grouping rules |
| Rush/inserted orders as share of wave lines | Persistently above ~10% | The exception lane is too wide; wave structure exists on paper only | Tighten rush-order criteria; rush orders get their own wave |

Step 4: Change one parameter at a time. Run three days, then look.
This is discipline, not advice. Change three or four parameters at once and you'll never know which one worked — or which one to roll back if nothing worked. Change one, run three full working days, compare wave UPH for the same shift and same weekday, then decide the next move.
In March 2025, a beauty e-commerce warehouse in Dallas had afternoon waves chronically underperforming — about 20% below morning UPH. Management suspected the afternoon crew was slacking. The Step 2 variance check said otherwise: huge variance between waves within the same afternoon shift. Structure again.
Step 3 pointed at the fourth metric: the first afternoon wave released on the hour, stuffed with orders that had piled up all morning, and the rush-order share was high. Customer service kept injecting rush orders into waves already in execution. Insertion rates regularly hit 20% in the afternoon. Waves were assembled, then torn apart and reassembled. Picker route plans were garbage before the first tote moved.
The fix: release twice — normal waves on the hour, rush orders in their own wave 15 minutes later, and no more insertions into waves in execution. After a week, afternoon wave UPH was back level with morning. Nobody on the afternoon shift owed anyone an apology. The data had already spoken for them.
The Derailers: I've Seen This One Three Times
Derailer one: the morning huddle runs on the per-person UPH ranking. I've seen this one three times. A ranking is an outcome, not a cause. Managing people off an outcome is like treating a fever with a thermometer. Diagnosis starts at wave-level data. Non-negotiable.
Derailer two: the average hides the structure problem. Facility-average UPH looks fine, but split it by wave and the big ones fly while the small ones crawl — or mornings fly and afternoons crawl. Averages can hide a structural problem for six months. Read the distribution, not the average.
Derailer three: the rush lane keeps getting wider. It starts as "an occasional rush insertion." Six months later insertions are at 20% and the wave template is decorative. Rush orders get their own wave. That's the floor. A wave that accepts insertions is not a wave.
Derailer four: parameters changed, never validated. Someone raises the line cap, assumes "it should help," and moves on. Every parameter change needs a before-and-after wave UPH comparison over three working days. An unvalidated change is a change that didn't happen.
Pre-Go-Live Checklist
Every time you adjust a wave parameter — or every time UPH goes soft and you're about to dig in — run through this list. Anything you can't check off, fix the data gap before touching anything:
- Can the wave-level UPH report slice by wave number? (If not, file the report request first.)
- Have you computed both variances — between waves in the same shift, and between pickers in the same wave — for the last 14 days?
- Wave template line cap and order cap: who changed them last, when, and why?
- This week's rush/insertion share of wave lines: what's the number?
- Are you changing exactly one parameter this round? (More than one — go back and re-sequence.)
- Is the three-day baseline UPH snapshot saved? (No baseline, no validation.)
One thing to do tomorrow morning: sort last week's waves by UPH and check whether the bottom ones all skew large on line count. Five minutes, and you'll have your answer.
By Lin Xiao, WMS Implementation Consultant