Here's the answer up front. If you're wondering how to calculate warehouse throughput capacity in orders per day, start with this formula: daily order capacity = your slowest step's hourly throughput × net working hours × attendance rate. After 30+ WMS implementations, I can tell you this: eight out of ten warehouse owners overestimate their capacity, usually by 30 to 40 percent. Skip the math before peak season, and you'll pay for it in backlogs and one-star reviews.
In October 2023, a home-goods e-commerce client in Shenzhen leased a brand-new 22,000-square-meter warehouse ahead of Singles' Day, targeting 80,000 orders on the big day. A week before go-live, the owner asked me whether capacity was enough. His math: "20 packing stations, 200 orders per station per hour, 10 hours a day — that's 400,000 orders." I have seen this exact mistake three times. All three ended badly. On the day, they shipped 46,000 orders; the rest took three days to clear. The problem was never the packing stations — half his 3,000+ SKUs were bulky furniture, and picking UPH was barely in the 40s. Ten packing stations sat idle waiting for product. A packing station with no product is just furniture.
Why Capacity Is a Barrel, Not a Sum
Picking, checking, packing, and loading run in series. The whole line moves at the speed of its slowest step. That's formula one:
Step hourly capacity = headcount at that step × average UPH per person
Run it for all four steps and take the minimum — that's your line speed. Square footage, racking, and your WMS set the ceiling and the stability; they don't set how many orders leave today. Here's the counterintuitive part, and I'll put it up front: what caps a warehouse's throughput is usually not floor space — it's staffing and flow at the slowest step. I've seen an 8,000-square-meter site ship 30,000 orders a day, and a 20,000-square-meter site choked by 12,000. The second one was the client above: 22,000 square meters, defeated by a picking step nobody had measured.
How to Calculate Warehouse Throughput Capacity: The Six-Step Method
Step 1: Break the volume down — peaks, not averages
Plan for the peak day, not the average day. Pull last year's peak-week data from your WMS: peak-day orders × this year's growth factor = your target. Then break down the order mix:
- What share are single-line orders vs. multi-line orders?
- Average lines per order?
This decides every UPH number downstream. Single-line and multi-line picking productivity can differ by 2x; blending them gives you a wrong answer with extra steps. Your two outputs: peak-day order count and peak-day total units.
Step 2: Measure real hourly throughput at each step
Don't use the equipment brochure. Don't use your fastest operator's number. My method: pick three average performers per step, measure one real hour, take the median. The table below shows ranges I commonly see across projects — treat them as field estimates and replace them with your own measurements:
| Step | Unit | Typical range (field estimate) |
|---|---|---|
| Picking (mostly single-line) | units/person/hour | 100–150 |
| Picking (mostly multi-line) | units/person/hour | 60–90 |
| Checking / QC | orders/person/hour | 80–120 |
| Packing (simple) | orders/person/hour | 80–100 |
| Packing (bubble wrap + box + void fill) | orders/person/hour | 50–70 |
| Loading | orders/person/hour | 100–150 |
Watch the units: picking is measured in units, checking and packing in orders — divide by average lines per order when converting. This is where beginners go wrong most often.
Step 3: Find the bottleneck — take the minimum
Plug in your measured numbers and run all four steps. Example:
- Picking: 10 people × 80 units/hour = 800 units/hour; 3 lines per order → 267 orders/hour
- Checking: 6 people × 100 orders/hour = 600 orders/hour
- Packing: 8 people × 80 orders/hour = 640 orders/hour
The bottleneck is picking: 267 orders/hour. Formula two: line hourly capacity = min(capacity of each step). Every extra hire and every extra machine goes to the bottleneck first. I've told clients this twenty-plus times: if the bottleneck doesn't move, money spent anywhere else is wasted.
Step 4: Use net hours, not gross hours
A 10-hour shift is not 10 hours of work. Meals (0.5h), two breaks (0.5h), shift handover (0.25h), plus the drip of water breaks and bathroom trips — apply a net-hours factor of 0.80–0.85. Field estimate.
Formula three: daily order capacity = bottleneck hourly capacity × gross hours × net-hours factor × attendance rate
Continuing the example: 267 orders/hour × 10 hours × 0.82 × 0.9 (peak season means temps; attendance at 0.9) ≈ 1,970 orders/day. The owner's "400,000" and the formula's 1,970 live on different planets. The gut-feel number is always off by an order of magnitude — directionally, never in your favor.
Step 5: Work backward to the staffing gap
Gap = peak-day orders − daily capacity. Divide the gap by the bottleneck step's per-person throughput to get the hires needed. Two rules:
- Add people to the bottleneck first, then recalculate — bottlenecks move. Fix picking and checking becomes the new constraint.
- Count temp workers at 60% of a veteran's productivity. Field estimate. Ten temps equal six veterans on the schedule.
Step 6: The night-before-go-live checklist — stress-test it
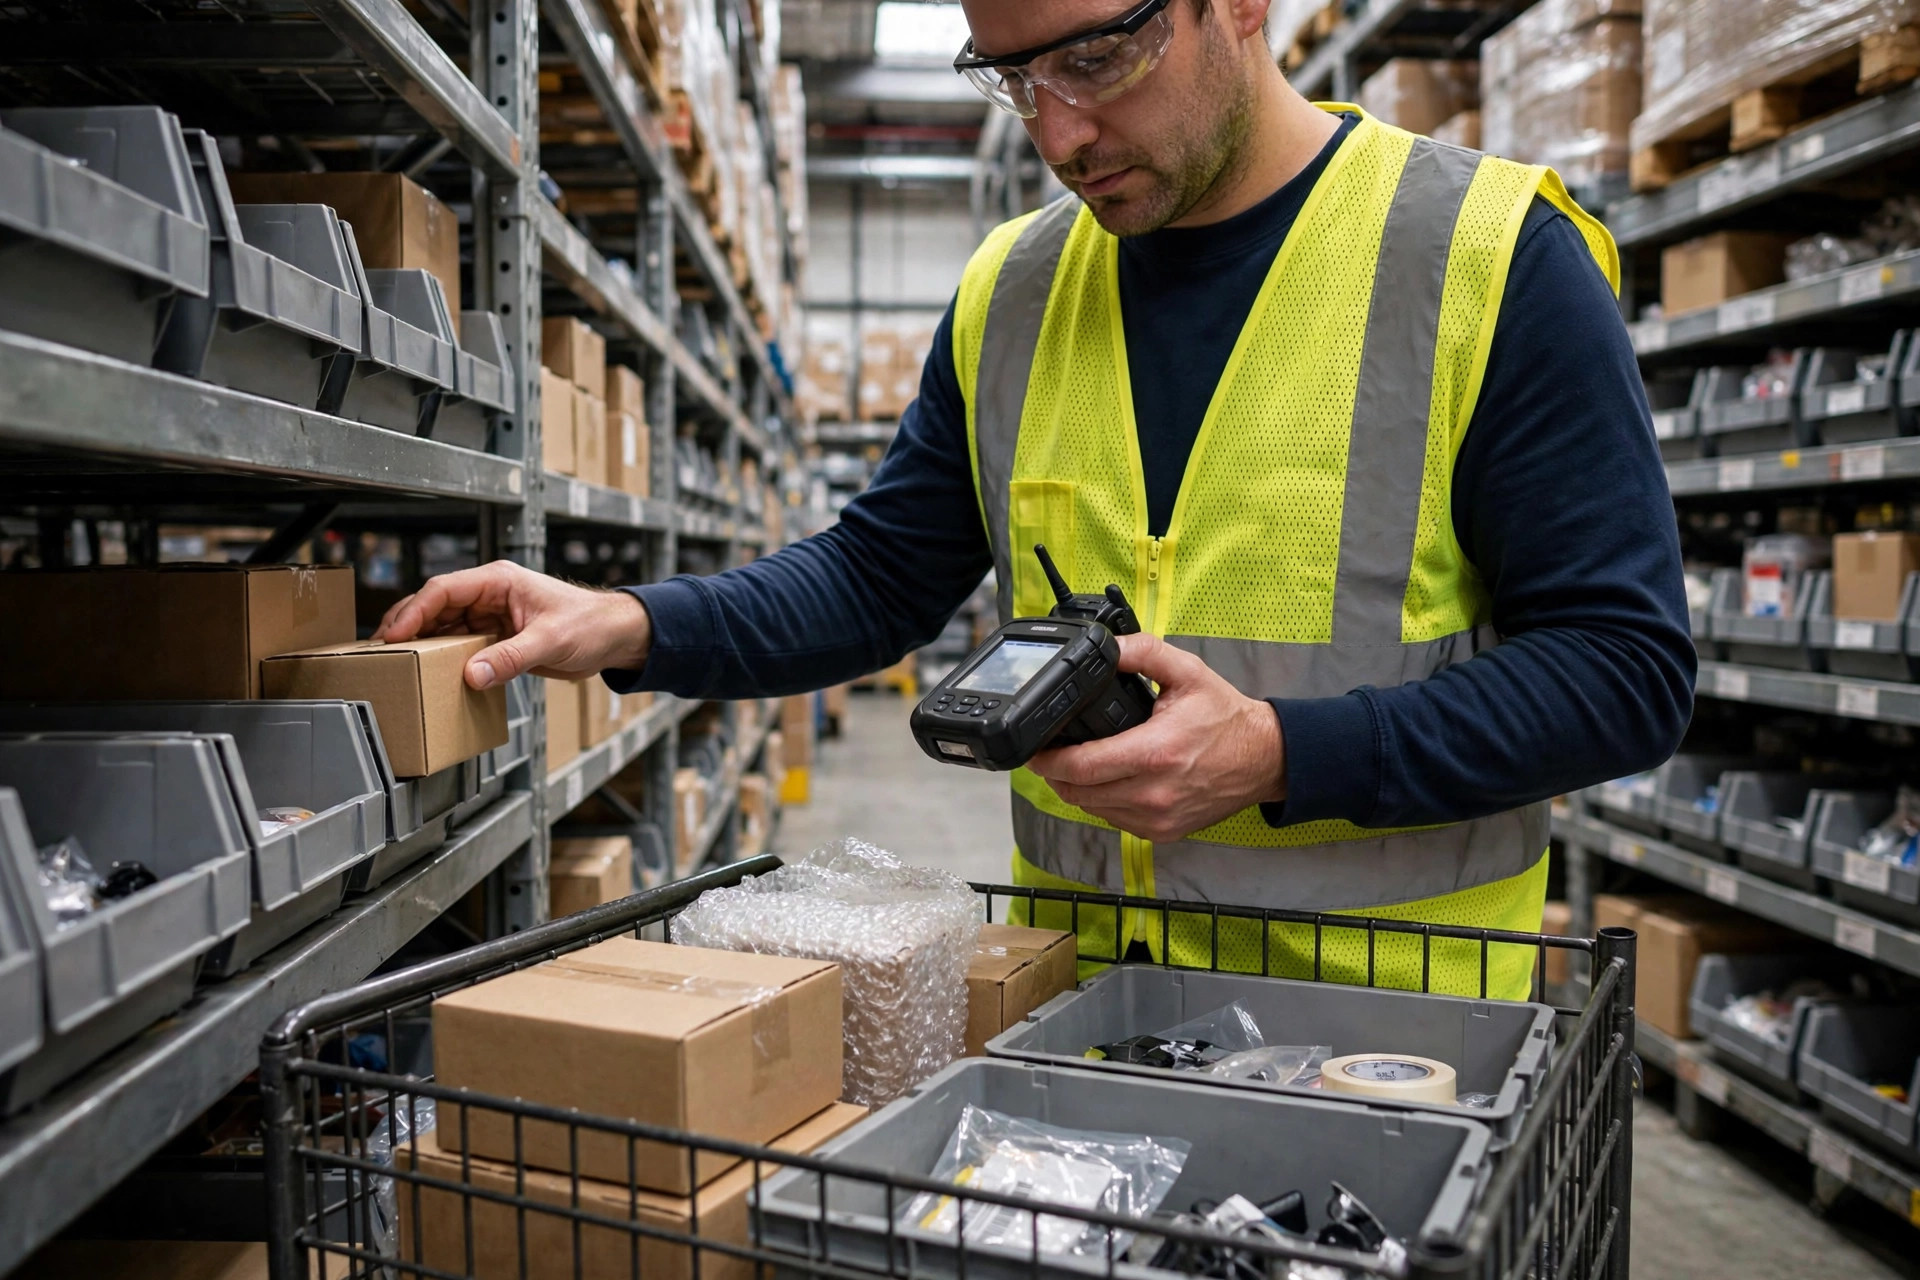
A formula on paper isn't done. A week out, run a half-day stress test at 1.2x peak volume and watch which step clogs first. My go-live checklist has five capacity items: hot SKUs fully replenished at forward pick locations, two days of consumables (cartons, labels, tape) staged, every handheld fully charged, a dedicated exceptions handler on shift, and temps onboarded and trained a day early. Whatever clogs in the test is what explodes on day one of peak.
Common Failure Points When Calculating Warehouse Throughput Capacity
- Staffing to the average. The number-one killer. A site doing 3,000 orders on a normal day and 20,000 at peak, staffed for 5,000, will be queuing at midnight on day one.
- Using nameplate capacity as real capacity. The conveyor rated at 2,000 units/hour was rated empty and ideal. Only measured numbers go in the formula.
- Forgetting exceptions. Damaged goods, stockouts, bad addresses, stuck system orders — they eat 5–10% of labor daily and nobody budgets for them. My habit: take the formula result and multiply by 0.9.
- Scheduling temps at veteran productivity. Covered above. Sixty percent. Write it into the roster.
- Adding packing stations when picking is the bottleneck. Adding height to the tallest stave of the barrel doesn't raise the waterline.
In September 2024, a 3PL client in Jiaxing ran this exact method six weeks out and found checking was the bottleneck — four people, two check scales, product piling up at the check area. The fix: seven checkers, four scales, and a one-way flow redesign in the check zone. That Singles' Day they cleared a 21,000-order peak day same-day, on time. I remember this one because the owner initially insisted on adding packing stations.
Don't wait for peak. Tonight, pull last year's peak-week volumes and order mix from your WMS. Tomorrow, spend one hour measuring per Step 2 — that's your warehouse's real capacity. Calculating this before peak costs you one stress test's worth of labor. Firefighting during peak costs you three days of backlog, a flooded customer service queue, and return shipping. You can do that math yourself.
By Lin Xiao, WMS Implementation Consultant