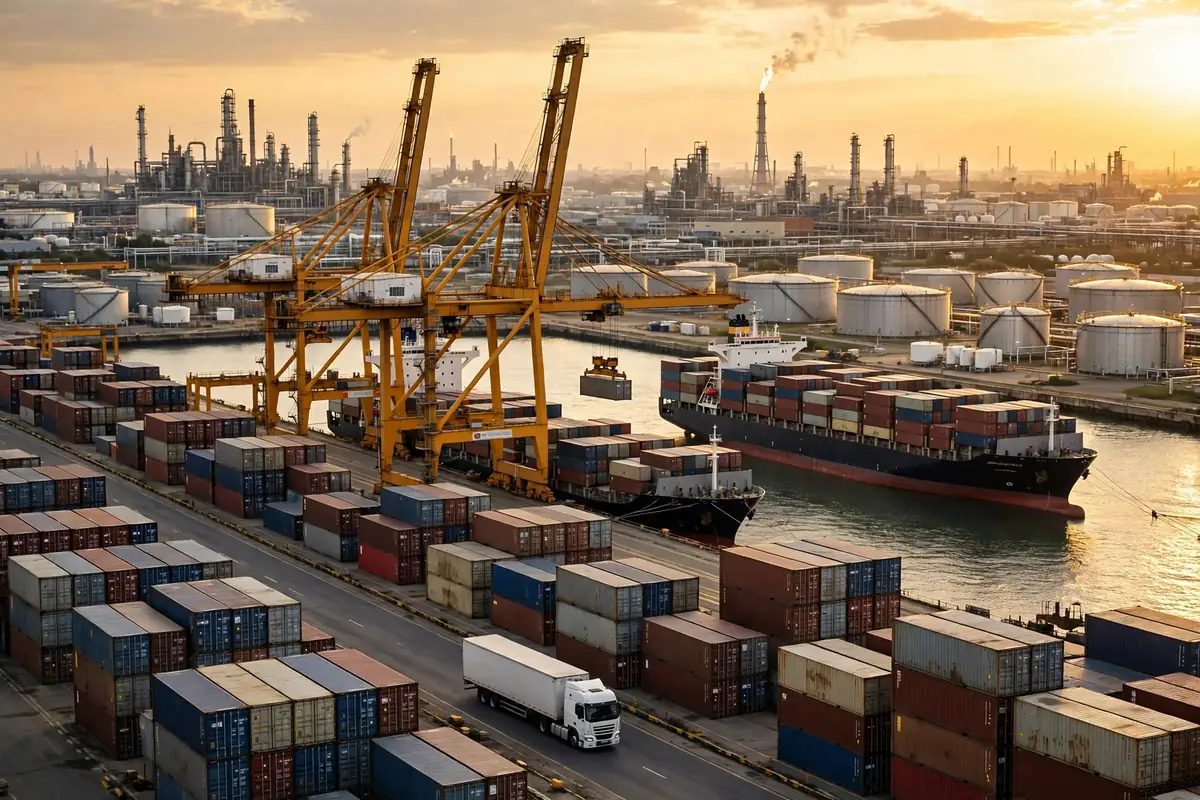
The 2025 figures for Vancouver Canada port warehouse logistics deserve a full reading before any judgement is passed. Total cargo reached 170.4 million tonnes, a record, up 8% year on year. Containers reached 3.78 million TEU, also a record, up 9%, surpassing the previous record of 3.70 million TEU set in 2021. Set against 2024 — 158.4 million tonnes of cargo and 3.47 million TEU — this is not an ordinary rebound. It is a structural step up. According to public data, Vancouver is Canada's largest port, handling more cargo than the next five Canadian ports combined. A port of that scale cannot be understood with the warehousing logic of an ordinary port.
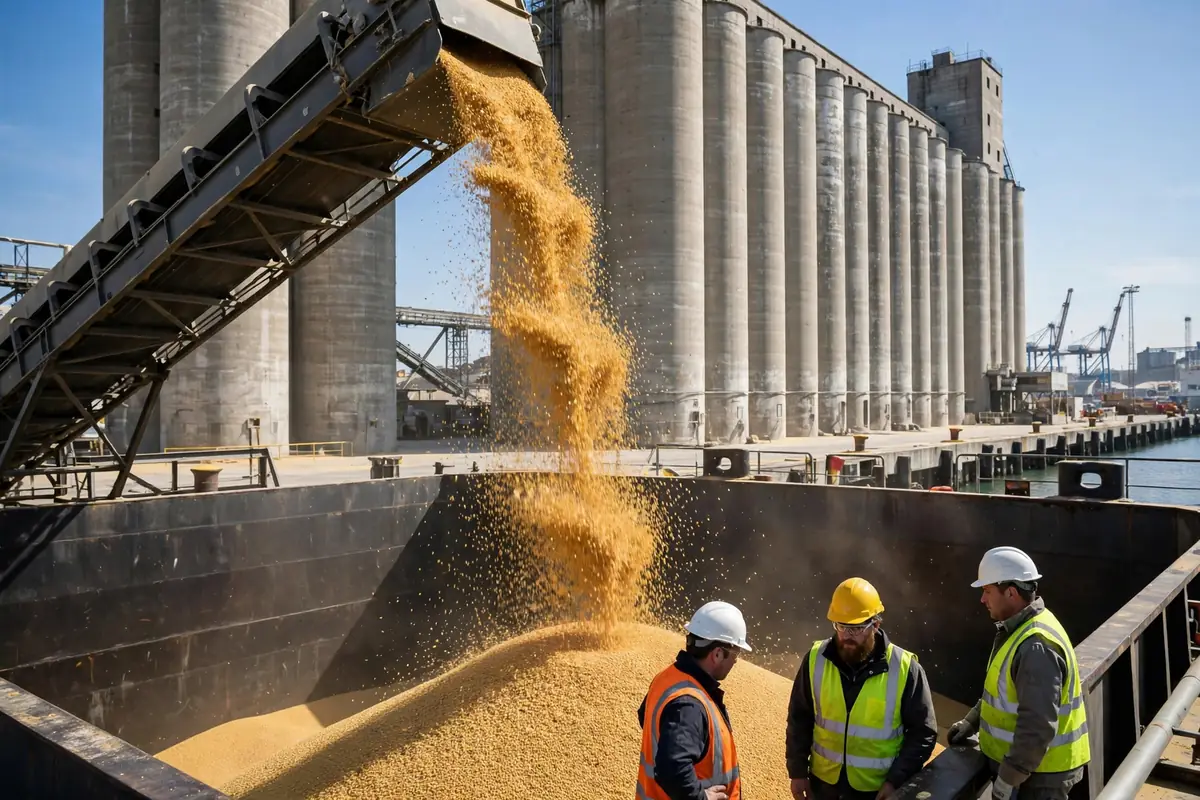
What is more instructive is the composition of the growth. In 2025, grain exports reached 30.3 million tonnes, a record; potash reached 10.5 million tonnes; and crude oil exports doubled to 24.4 million tonnes. In other words, the record year was driven not only by containers but also by bulk cargo — and by three bulk trades with entirely different characters. Containers run on liner schedules, cut-off times and turns. Bulk runs on seasons, railways and large contracts. For one port to set records in both systems at once, the warehousing arithmetic has to be calculated separately for each, and then read together.
The Dual Structure of Vancouver Canada Port Warehouse Logistics: Containers and Bulk on Separate Ledgers
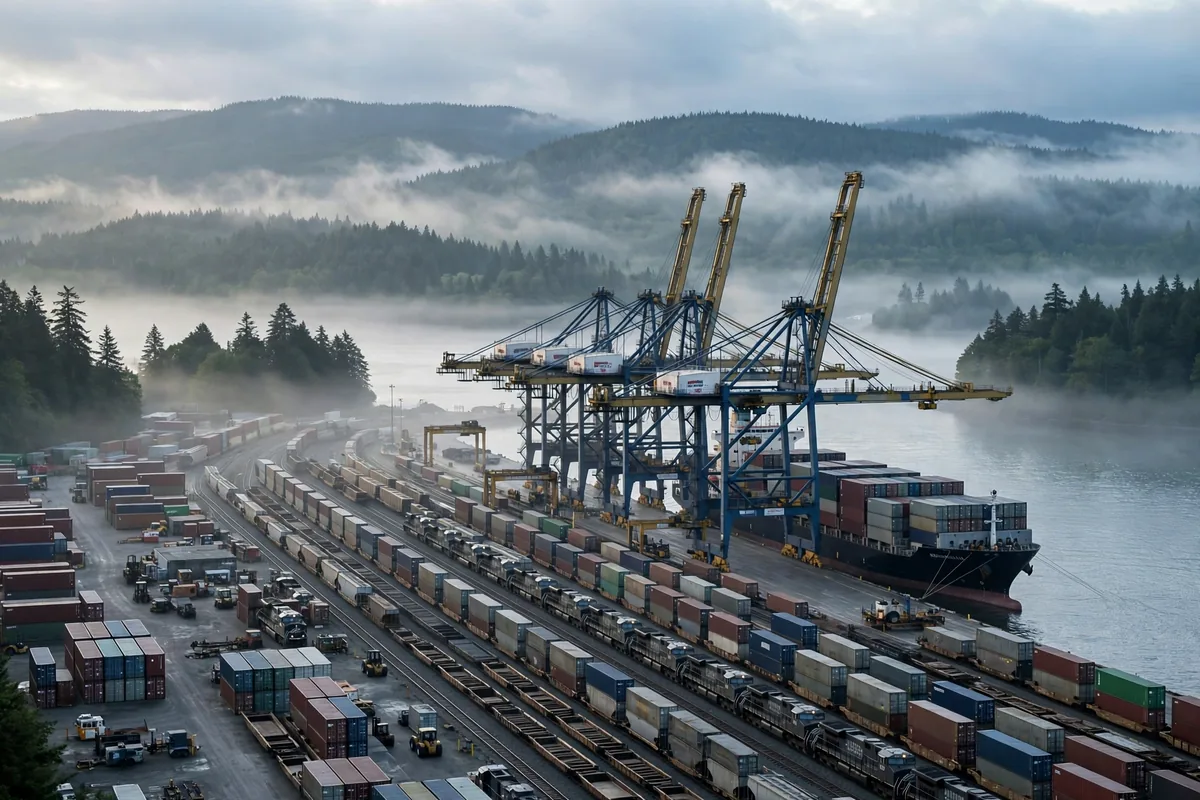
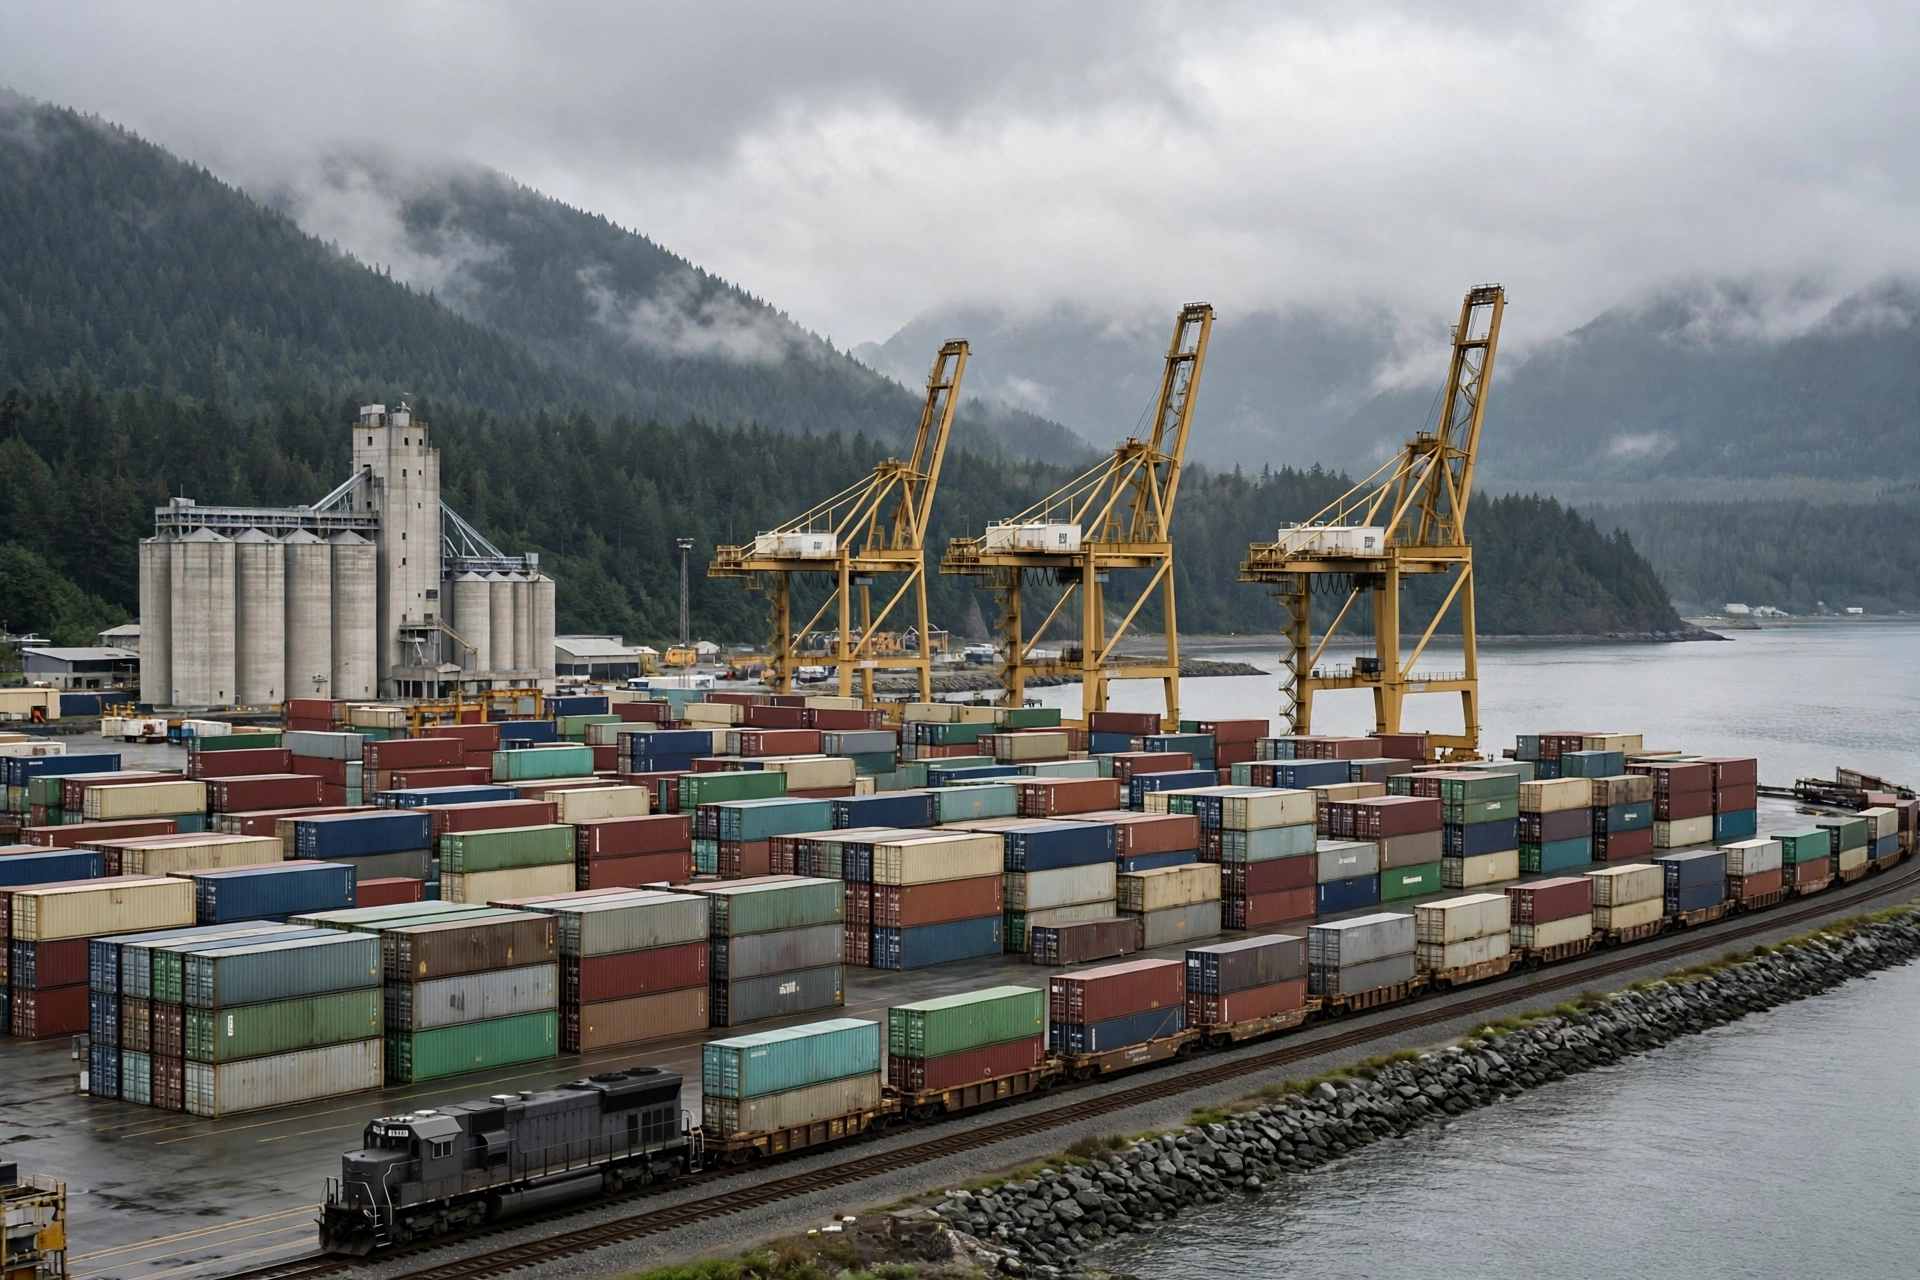
The port has four container terminals, with the Roberts Bank Terminal 2 container terminal in planning and under development. On the container side, a record 3.78 million TEU means yard and terminal turn pressure rose in step. On the bulk side, 30.3 million tonnes of grain, 10.5 million tonnes of potash and 24.4 million tonnes of crude oil mean rail cars into the port, silo turns and tank scheduling all ran at high levels through the year. Two systems share the same port area and the same rail network, and when peak season arrives, the competition for resources between them becomes visible.
The seasonality of grain is the sharpest illustration. When harvest season arrives, rail cars and silos run close to full capacity, and the warehousing bottleneck sits not at the berth but at inland collection points and the handover to port-bound rail. Potash follows a different logic: it depends on long-term export contracts and a steady shipping rhythm, and the warehouse functions as a buffer that smooths the gap between continuous production and discrete vessel sailings. Crude oil is different again. Its doubling to 24.4 million tonnes followed the expansion of the Trans Mountain pipeline, which released new capacity; the port is the outlet of that pipeline, and warehousing plays almost no leading role there — the rhythm of the pipeline and the tankers decides the outcome.
Consider two illustrative scenarios. A grain exporter in harvest season needs to move cargo from the interior to Vancouver while silos and rail cars are fully booked and the vessel sailing is fixed. Its choice is to store the cargo early in an inland warehouse and wait for rail slots, or to pay a premium to secure a port-bound rail window. One costs more storage, the other more freight. Neither is right or wrong; it is a trade-off. A potash exporter faces the opposite problem: contracts are stable and sailings predictable, so its warehouse works as a buffer pool, and the main cost question is whether the pool is sized correctly — not the final leg into the port.
Two bulk trades, two warehousing logics — and containers make a third. Vancouver effectively runs three warehousing ledgers at once. Treating them as one account is the first mistake a new entrant tends to make.
Rail Access and Inland Warehouses in Vancouver Canada Port Warehouse Logistics: The Decisive Variable
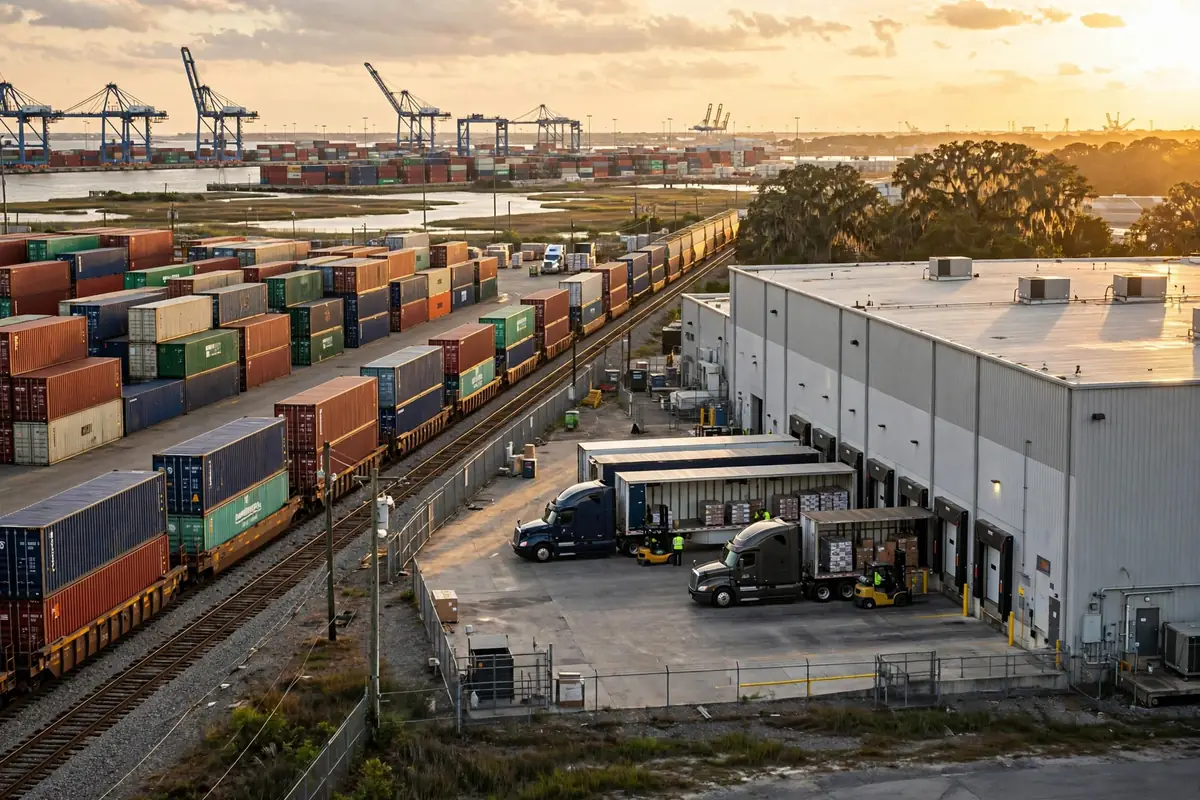
If the container terminals set Vancouver's ceiling, rail access decides whether the port can actually reach it. That is the decisive variable in Vancouver Canada port warehouse logistics. Grain and potash both arrive by rail from the interior, and containers likewise depend heavily on rail for evacuation from the port. A throughput record is never created by the terminal alone. It is the product of rail, inland warehouses and terminals locking together.
The bottleneck effect of rail access appears to be growing. In a record cargo year, rail windows are precisely when they are most valuable. The role of the inland warehouse has therefore shifted: it is no longer just a place to store goods, but a regulating valve — gathering cargo early when rail windows are tight, and feeding it fast when a sailing window opens. The further an inland warehouse sits from the port, the more room it has to regulate, but the slower it responds to vessel schedules. The closer it sits, the faster it responds, but land and operating costs rise and the room to regulate narrows. There is no standard answer to that trade-off. It depends on the shipper's cargo mix and sailing density.
The table below compares the warehousing arithmetic of the three cargo types. Every figure is a hypothetical example, shown only to explain the cost structure — the numbers should not be applied directly:
| Cost item | Container cargo | Grain bulk | Potash bulk |
|---|---|---|---|
| Storage (prorated by dwell) | Medium — fast turns | High — seasonal stockpiling | Medium — buffer-pool model |
| Rail access and evacuation | High — depends on train windows | High — harvest-season windows are tight | Medium — rhythm is predictable |
| Schedule connection risk | Medium — liner sailings are relatively fixed | High — sailings and harvest can misalign | Low — contracts lock sailings |
| Total cost per box/tonne (hypothetical example) | About 100 units | About 90 units | About 85 units |
| Warehousing bottleneck (hypothetical example) | Terminal yard turns | Inland collection and rail windows | Buffer-pool sizing |
The table makes a single point: there is no unified solution for Vancouver warehousing. The container bottleneck is the yard, the grain bottleneck is the rail window, and the potash bottleneck is the size of the buffer pool. Managing all three cargo types the same way guarantees that one of them will fail.
Trade Diversification and Roberts Bank Terminal 2: What to Watch Next
According to public trends, Canada's trade diversification is changing the composition of cargo flowing through Vancouver. Reducing dependence on a single market, the United States, means more cargo bound for Asia and other regions moves through the west coast, and Vancouver, as Canada's largest port, is the natural first choice to absorb that increment. The effect on warehousing is gradual but definite: as cargo directions change, the warehouses' customer base changes with them, and a warehousing rhythm designed for North American inland trade has to be re-fitted to longer ocean chains and more dispersed destinations.
Roberts Bank Terminal 2, in planning and under development, is a variable that has to be read on a longer timeline. Its significance is not how much congestion it can relieve today, but whether Vancouver's container capacity ceiling keeps rising. If 3.78 million TEU is simply the high-water mark of the existing four container terminals, then the progress of Terminal 2 will decide whether that record is a cyclical peak or the start of a new normal. The answer depends on whether construction progress and cargo growth stay in step.
Finally, a counterintuitive judgement — and one with evidence behind it. The doubling of crude oil exports to 24.4 million tonnes in 2025 looks like a great victory for the Port of Vancouver, but the main credit belongs not to the port itself but to the expansion of the Trans Mountain pipeline. Once the pipeline opened, the oil came; the port's role was to receive it, not to create it. The same logic applies to expectations for Terminal 2: building the terminal does not automatically bring the cargo. Cargo arrives because trade flows and industrial geography got there first. Before planning warehouse capacity, it is worth separating how much of a port's growth is the port's own capability and how much is the realisation of external conditions. That distinction may be the difference between a sound investment and a misjudgement.
The warehousing ledger of Vancouver, in the end, is not about one record year. It is about a structure: how bulk and containers share the railway, how inland warehouses regulate vessel schedules, and where warehouses should follow once trade directions shift. Those questions are worth revisiting when the next round of data arrives.
By Dr. Chen, Supply Chain Researcher