The US Midwest grain storage warehouse system looks like a collection of bins and a river. In practice it is a season-long cash-flow problem. According to the USDA National Agricultural Statistics Service Crop Production 2025 Summary, released in January 2026, the United States produced a record 16.96 billion bushels of corn in 2025 at a record 186.5 bushels per acre, alongside 4.26 billion bushels of soybeans. When production keeps setting records while storage capacity barely moves, where grain goes, how long it stays, and in what condition become questions to answer with numbers rather than habit.
US Midwest Grain Storage Warehouse Capacity: How Close to the Ceiling
USDA's December 2025 Grain Stocks report put total US grain storage capacity at 25.5 billion bushels: 13.6 billion on farms and 11.9 billion in commercial off-farm facilities, a split of roughly 53% to 47%. Agricultural economist Joe Janzen of the University of Illinois noted in early 2026 that from 2000 to 2019, capacity grew about 350 million bushels a year while production grew roughly 340 million, the two lines moving in step. Since 2020, capacity has grown by only 337 million bushels in total over six years, less than one typical year of growth in the earlier period. Extrapolating the 2000–2019 trend would put capacity near 27.5 billion bushels today; the actual figure is about 25.5 billion, and by December 2025 production had come within 5% of total capacity, the tightest margin in the data.
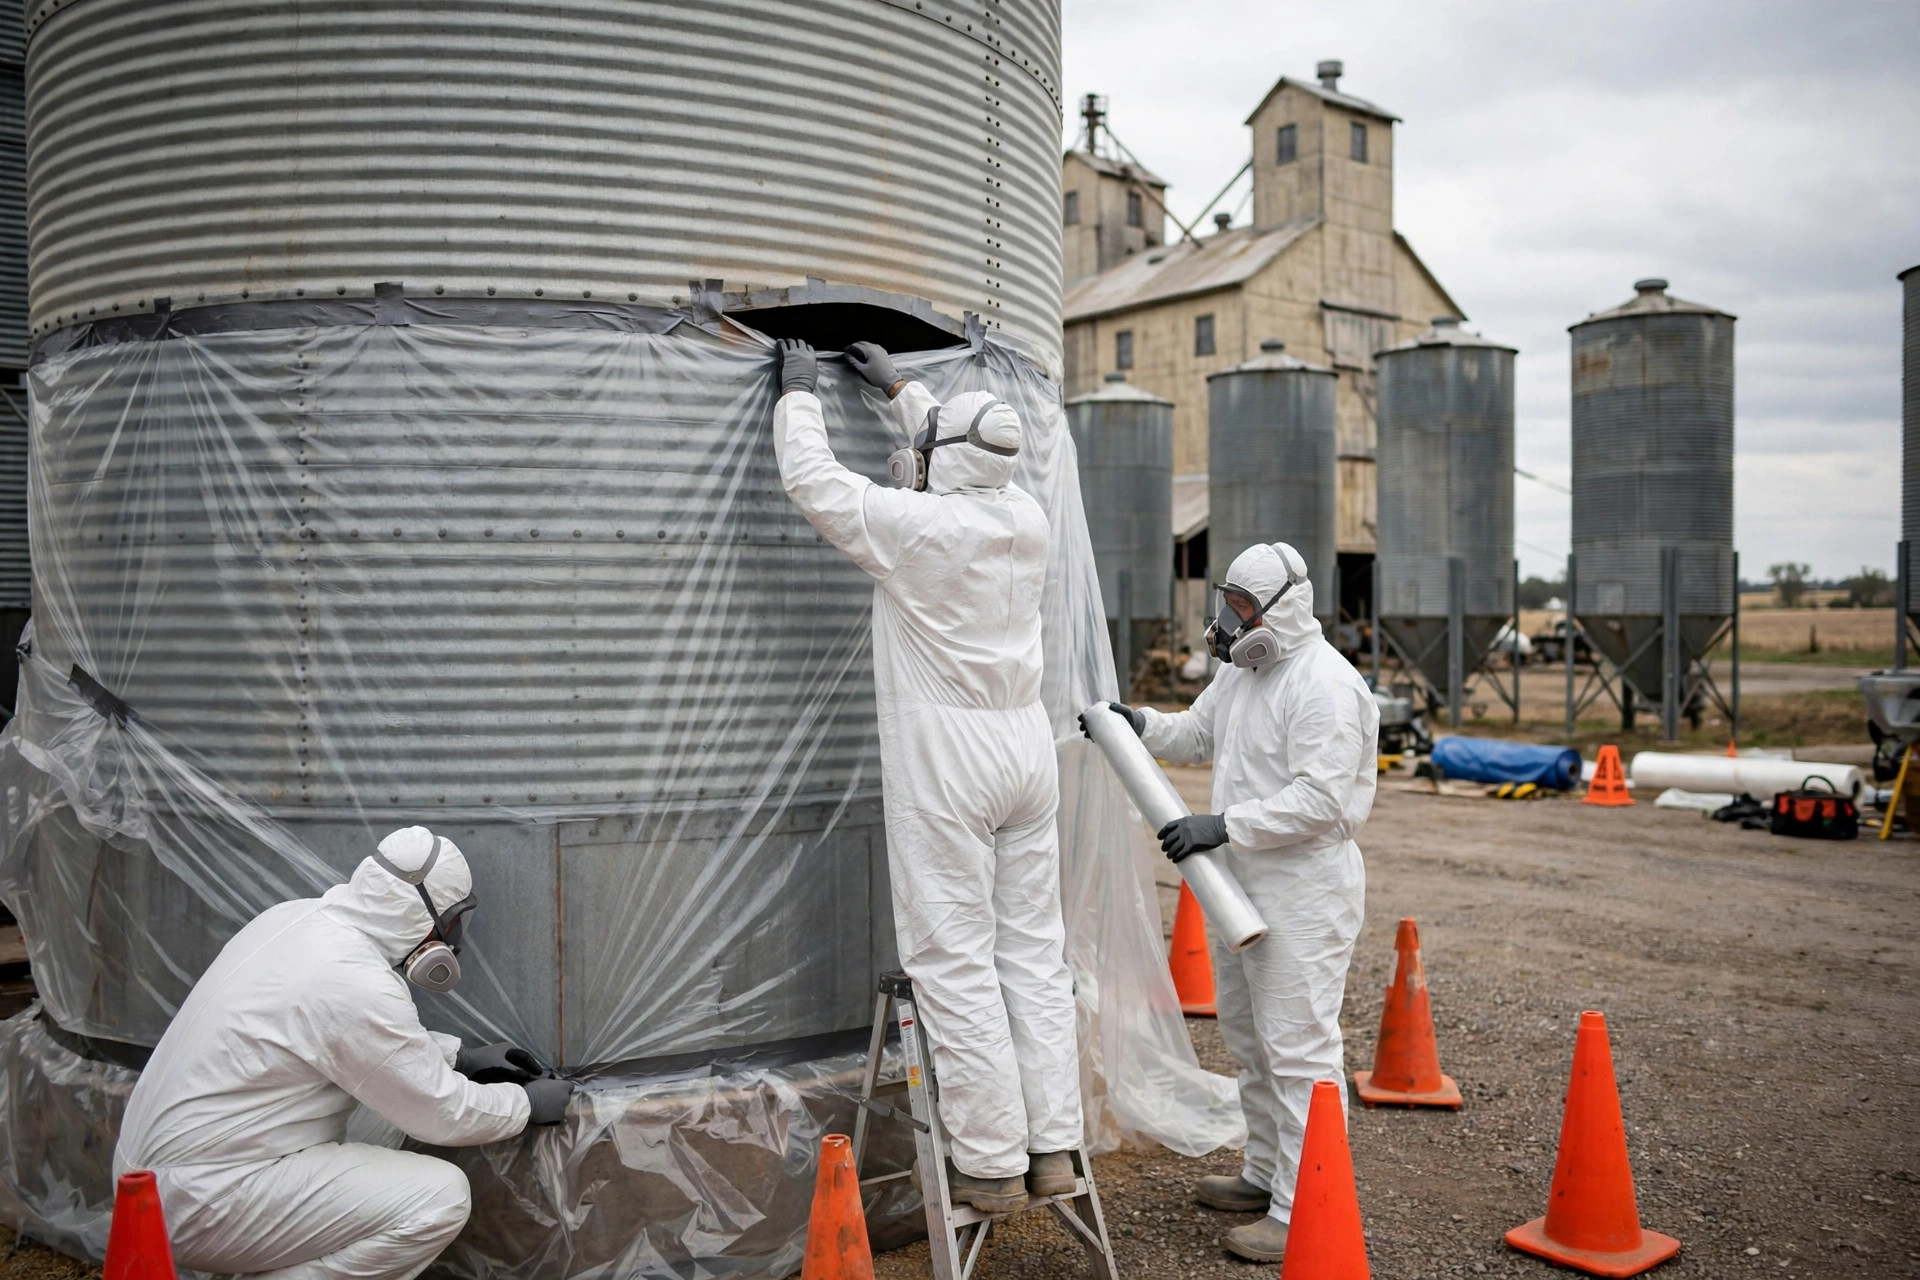
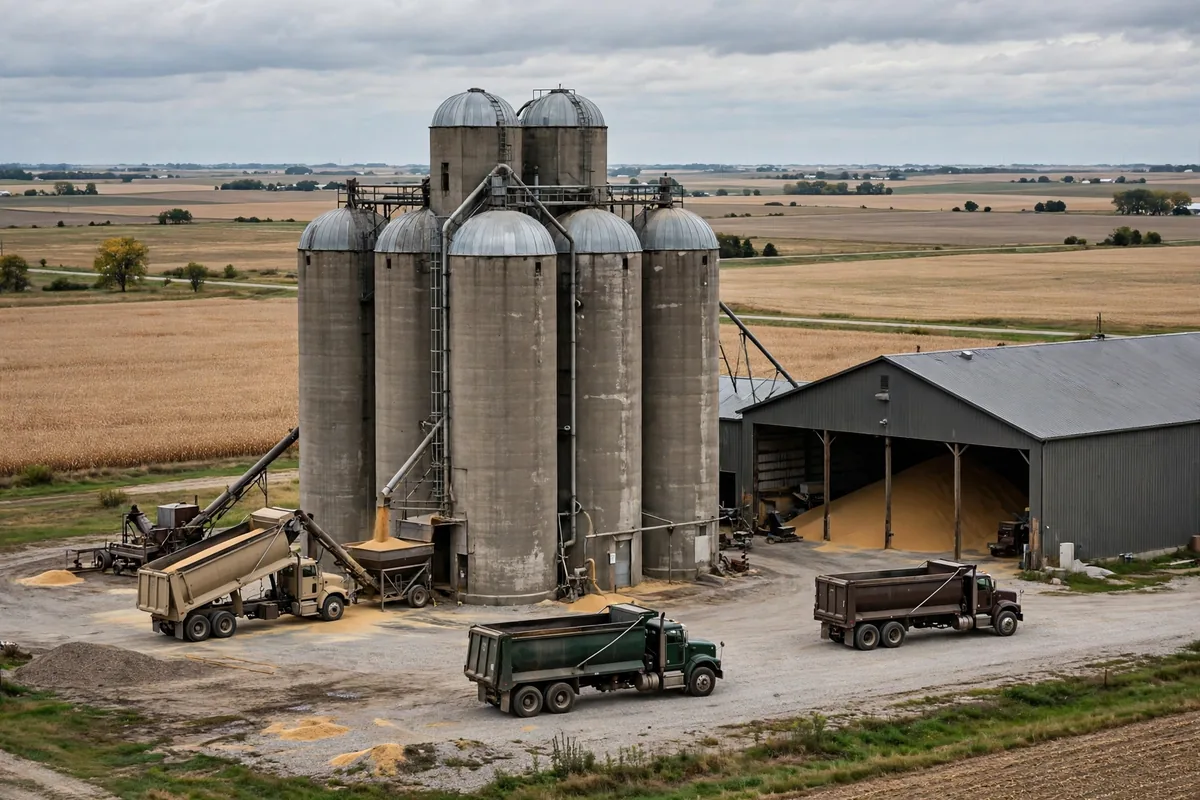
That margin shows up in concrete places. During the 2025 harvest, a grower in Iowa farming roughly 2,000 acres of corn finished his last field in mid-October to find all six of his farm bins full and the local cooperative's receiving line backed up for more than a week. About 80,000 bushels went into a temporary outdoor pile under tarps, with only basic ground ventilation ducts underneath. North Dakota State University Extension data shows that a single inch of rain can raise the moisture content of a one-foot layer of corn by 9 percentage points, from 14% to 23%. Once water gets into a ground pile, aeration alone rarely dries it back out, and the clock on mold starts running immediately.
Capacity pressure is also unevenly distributed. More than 13.5 billion bushels of capacity sits in the states between Ohio and Nebraska, while the Western Corn Belt and Northern Great Plains, farther from ports and end users, carry proportionally more on-farm storage. Near the Mississippi, the constraint is shipping rhythm; far from the river, it is physical space.
Moisture and Insects: Where US Midwest Grain Storage Warehouse Money Actually Goes
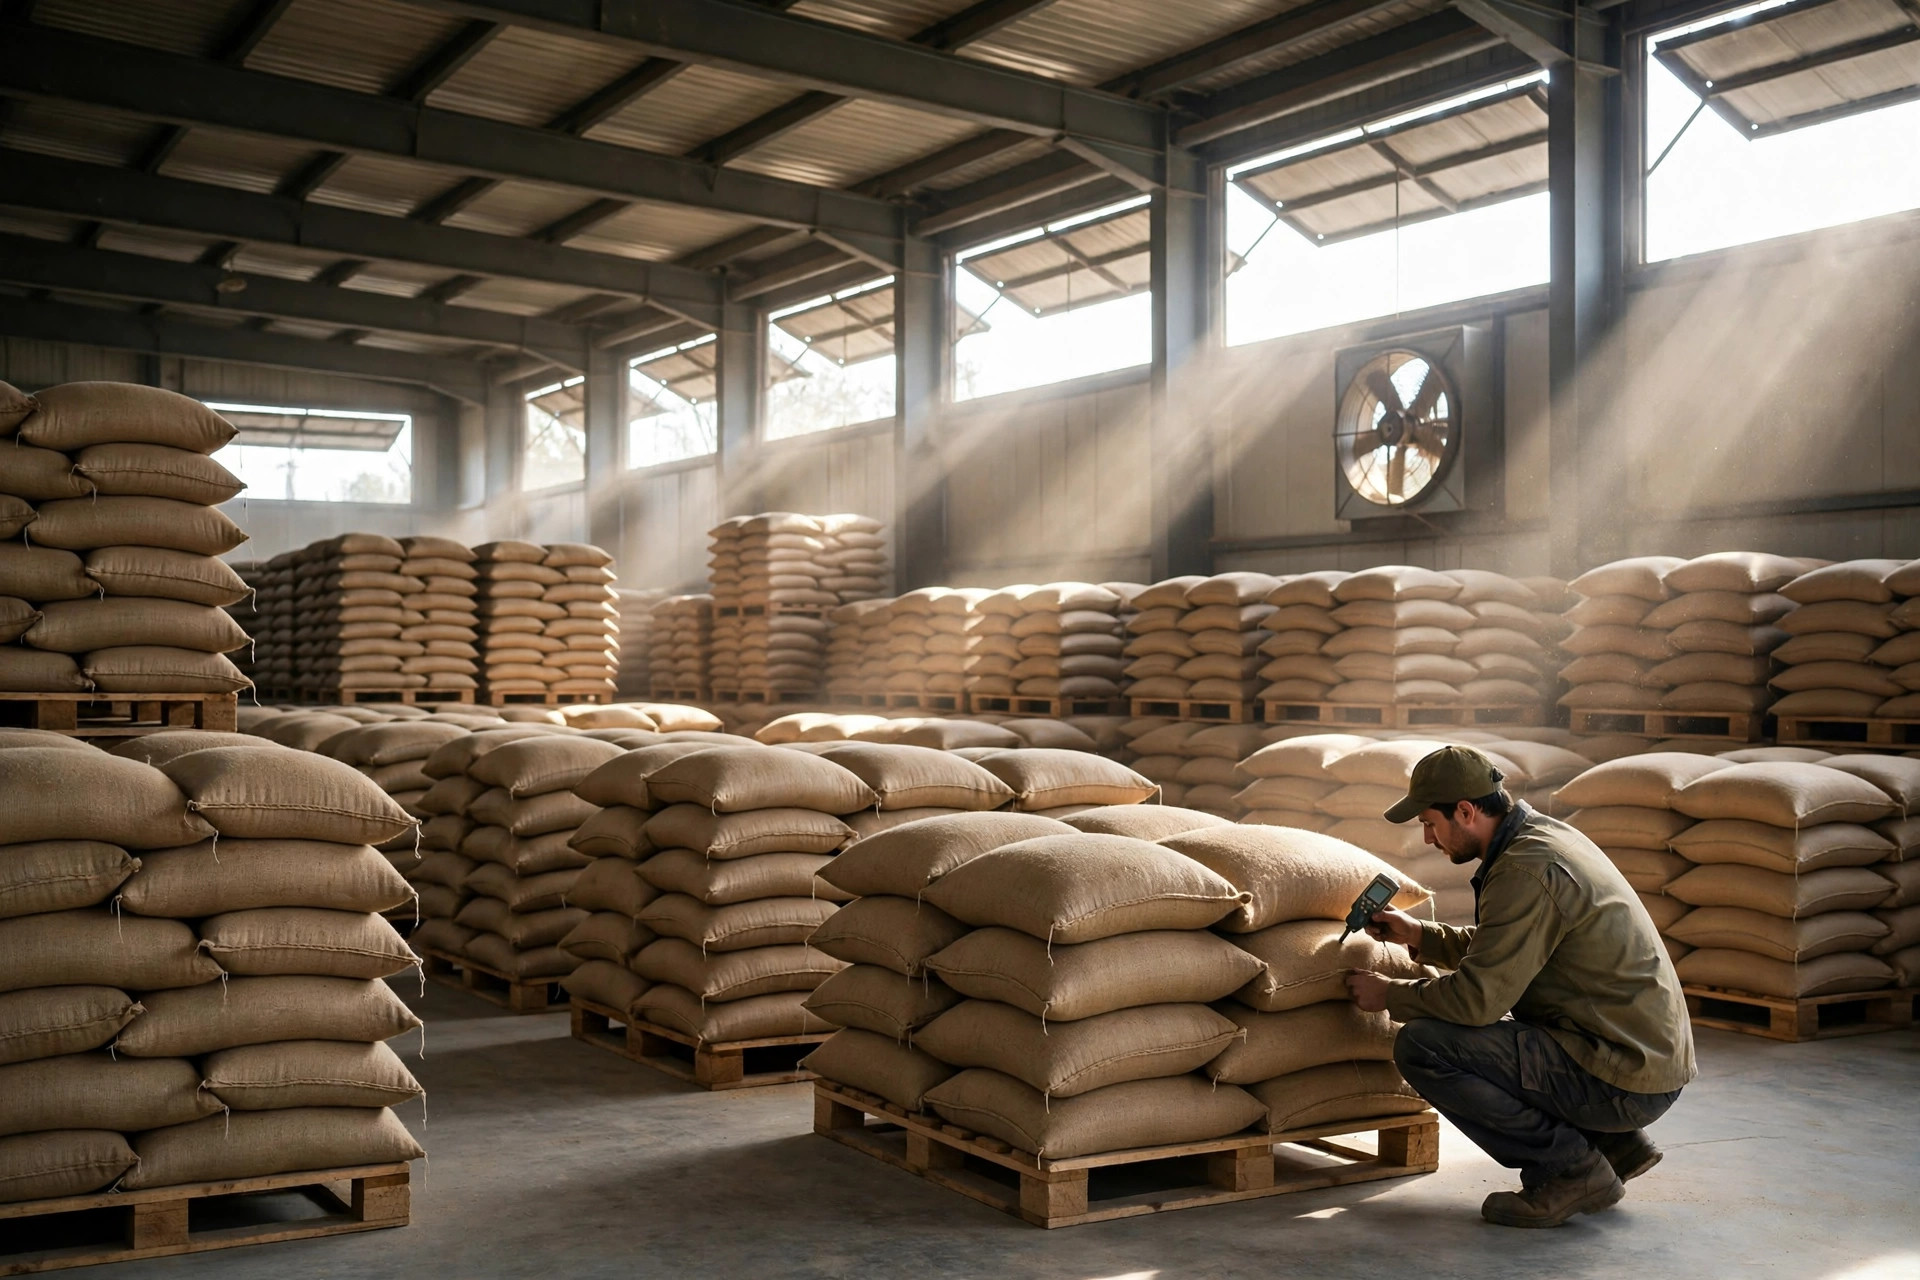
The real cost center of grain storage was never construction. It is management. North Dakota State University Extension recommends corn at 15%–16% moisture short-term and 13%–14% long-term, soybeans at 13% short-term and 11%–12% long-term. Purdue University Extension adds that clean, undamaged, properly cooled corn holds for a year at 14% moisture, while corn above 15% moisture at 25°C spoils within 6 to 8 weeks without active aeration. Temperature is the other lever: insects slow below about 70°F, go dormant below about 50°F, and die after a few weeks below 30°F. Allowable storage time roughly doubles with each 10°F reduction in grain temperature.
That is why the most money a Midwestern grower spends at harvest often goes to dryers and aeration fans rather than bigger bins. A common error is treating "moisture is in range" as "storage is safe," ignoring temperature gradients. When the grain core runs about 20°F warmer than the outer layer, moisture migrates upward and re-wets the top two to three feet of the bin. Purdue's guidance is a minimum aeration rate of 0.1 cubic feet per minute per bushel, cooling grain to near winter norms in late November or early December and warming it evenly to about 50°F in spring. The procedure is not complicated, but it requires continuous monitoring, and monitoring labor is exactly where many farms cut corners. Insect control follows the same logic: fumigation only works in a well-sealed bin, and temperature control is gaining ground in commercial elevators as fumigant regulation tightens, because one failed fumigation can cost more in grade discounts than a year of cooling electricity.
From Bin to Barge: The Shipping Math of US Midwest Grain Storage
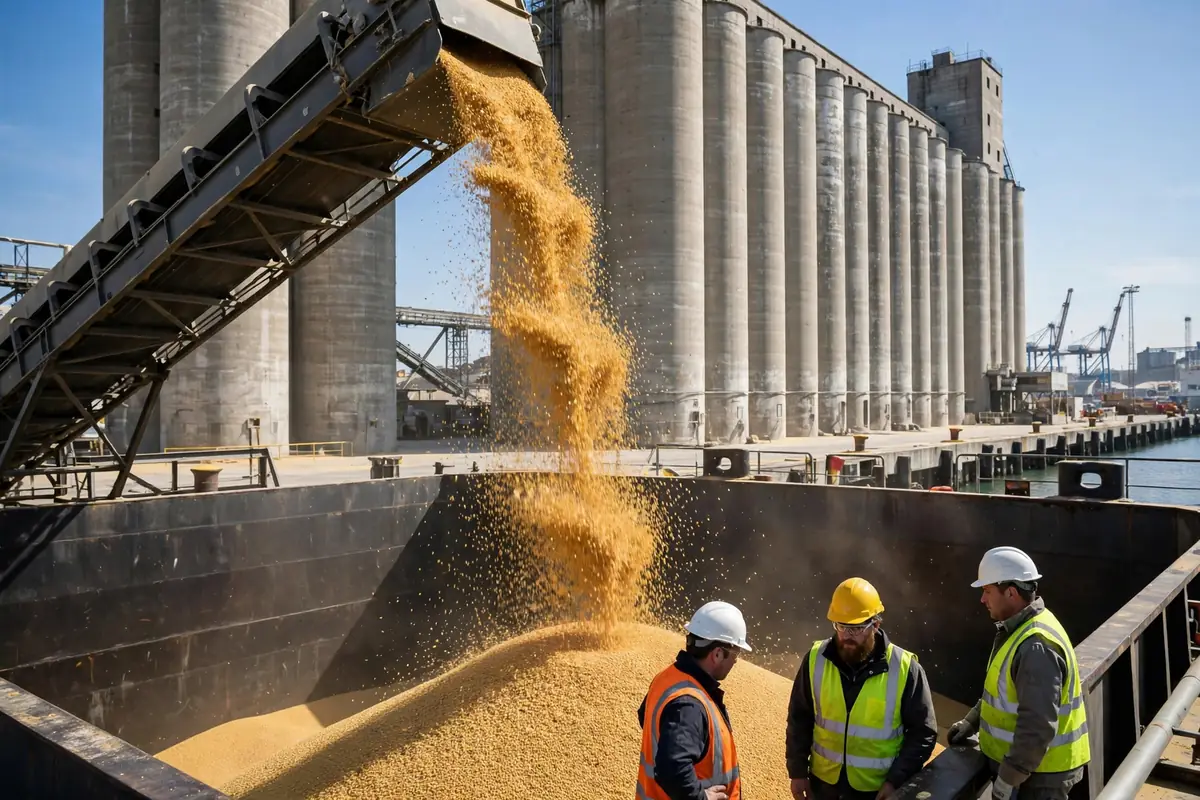
Grain only realizes its value when it ships, and the Midwest ships on the Mississippi River. According to USDA's Agricultural Marketing Service, inland hopper barges carry roughly half of US corn and soybean exports and about one-third of wheat exports through the Mississippi Gulf region. Army Corps of Engineers data shows grain and soybean barge volumes of 71.7 million short tons in 2022, about 41,000 barge loads. A single barge carries roughly 1,750 tons, close to 60,000 bushels, and a standard 15-barge tow moves as much as about 1,000 semi-trucks.
A CoBank report published in November 2026 put the US inland hopper barge fleet at 19,668 vessels in 2026, down 1,617 vessels or 7.6% over the past decade, with average age rising from 13.8 years in 2016 to 17.6 years. The fleet is projected to shrink to about 16,240 vessels by 2035, a 17.4% decline, if current trends continue. Over the same horizon, USDA projects US grain and oilseed exports to grow about 9%. Shrinking capacity against growing export demand is a gap that eventually shows up in basis: when barge rates rise, country elevator bids fall, and the farmer's loss appears at the moment of sale, not on a freight invoice.
Low water is the recurring wildcard. The Mississippi ran low through 2022 to 2024, forcing barges to load lighter, tow fewer barges, and accept longer transit times. USDA data shows southbound Mississippi grain shipments falling from 2.4 million short tons to 502,000 short tons within about a month in the fall of 2025, a 79% drop. Shipping plans cannot be built on normal river conditions alone: inventory buffers have to absorb low-water delays, or full bins and no boats will strand grain past its best marketing window.
Hold or Sell: A Decision Framework You Can Plug Numbers Into
Put the numbers together and the core storage decision is one question: when, at what cost, and to whom do you sell? The table breaks that decision into four comparable cost items; any grower or elevator operator can substitute their own figures.
| Cost item | Hold until spring | Sell at harvest | | Storage and carrying cost | Bin depreciation, aeration power, insurance, interest, typically several cents to more than a dime per bushel | None | | Quality risk | Moisture or insect mismanagement triggering grade discounts | None | | Basis gain | Selling off-peak may capture better basis, depending on local supply and demand | Accept harvest basis | | Shipping risk | Low water and a tight barge fleet can raise freight costs and depress bids | Freight locked at current rates |
The counterintuitive part of this framework is that the most overestimated benefit of holding grain is "waiting for a higher price," while the most underestimated cost is "losing grade." Futures prices can be hedged and basis can be locked in, but no financial instrument rescues a bin of moldy corn. The first money storage earns is the money from not making a mistake; the money from timing the market comes second. Yet USDA data shows on-farm capacity growing by only about 12 million bushels a year on average over the past five years. Managing existing bins well and timing shipments precisely is often worth more than building another one.
Trend outlook: three lines converging.
Three trends are converging. First, capacity: production has closed to within 5% of total storage capacity, so any bumper crop can create genuine local shortages, and temporary storage will keep being needed. Second, shipping: an aging, shrinking barge fleet is a decade-scale change, and with recurring low-water events, Mississippi River capacity is more likely to tighten than loosen, which could widen basis volatility inland. Third, management: as sensors get cheaper, grain monitoring is shifting from running the fan by feel to running it by data, which matters most for mid-size farms that cannot absorb one major quality failure.
Those three lines point to the same question: as production grows, storage capacity stops keeping pace, and shipping capacity contracts, the buffer in the US Midwest grain storage system is thinning. A thinner buffer does not mean the system breaks; it means every bad call costs more. Worth watching: whether on-farm storage investment accelerates again, whether new barge orders can reverse the fleet's decline, and whether digital grain monitoring moves from large commercial elevators down to ordinary farms. The answers will decide whether, in the next bumper year, grain sits in a bin waiting for a good price or under a tarp waiting for rain.
By Dr. Chen, Supply Chain Researcher