Let me tell you something. After 15 years hauling refrigerated freight all over this country, I've learned one thing the hard way: when a pharma customer refuses to ship until they've seen your warehouse's temperature mapping study, they're not being difficult. They're being smart.
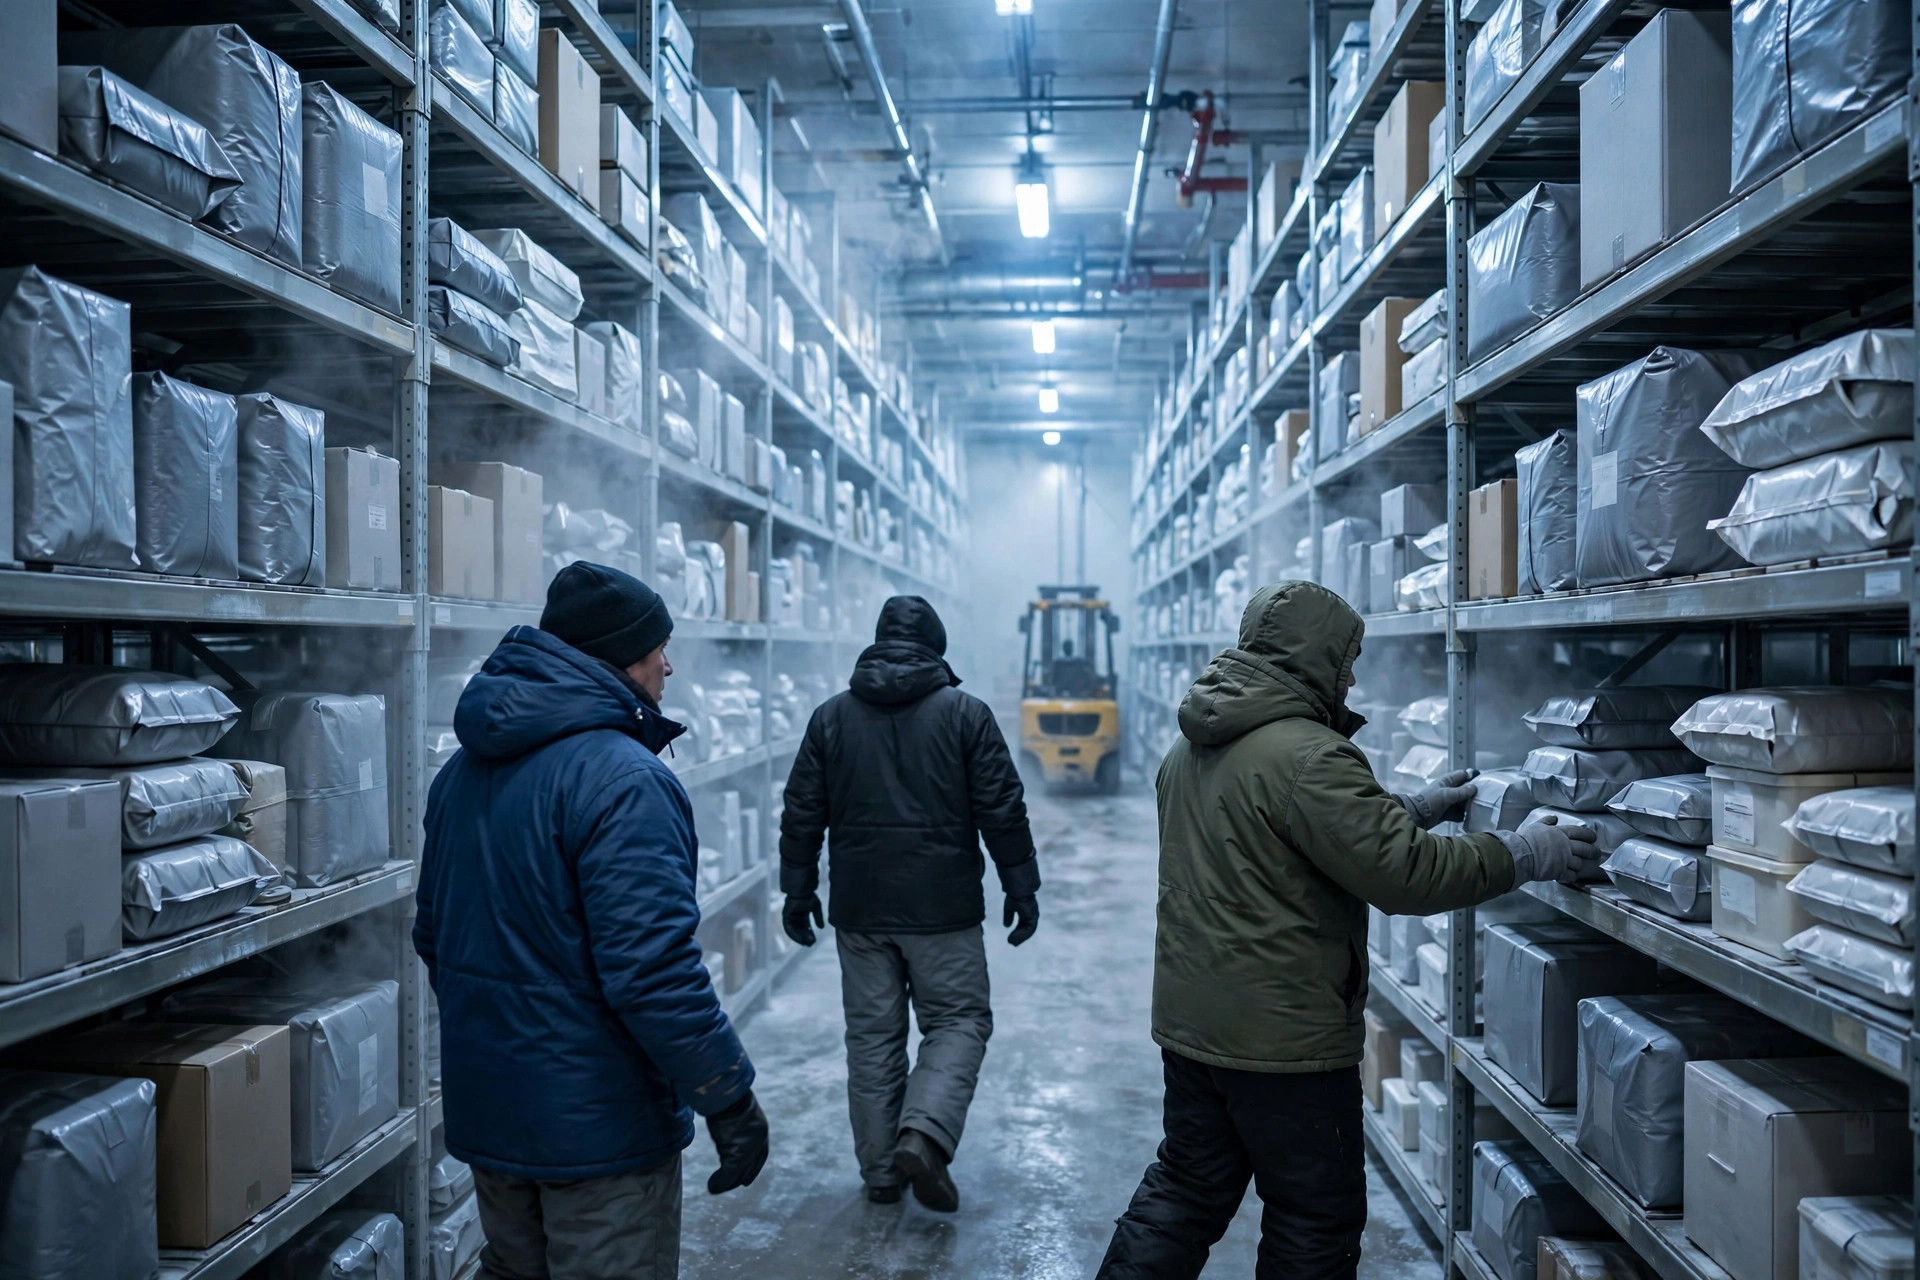
Fall of 2023. I'm sitting in my cab outside a pharma 3PL warehouse in Columbus, Ohio, waiting on a load. Inside the building, the customer's auditor asks the warehouse manager one simple question: "Show me your temperature mapping report." The guy shuffles some papers and produces a three-year-old report — done empty, never re-done loaded. The auditor's face changes. "Where's the loaded study? Where's the data for the points by the door?" Major finding, written up on the spot. That load — hundreds of thousands of dollars in product — sat for two extra weeks, and the warehouse lost three points off its quarterly service fee.
After watching that circus, I started asking around, and now I can explain this whole temperature validation business in plain English. Here goes.
What a Temperature Mapping Study Actually Proves: No Dead Zones, Period
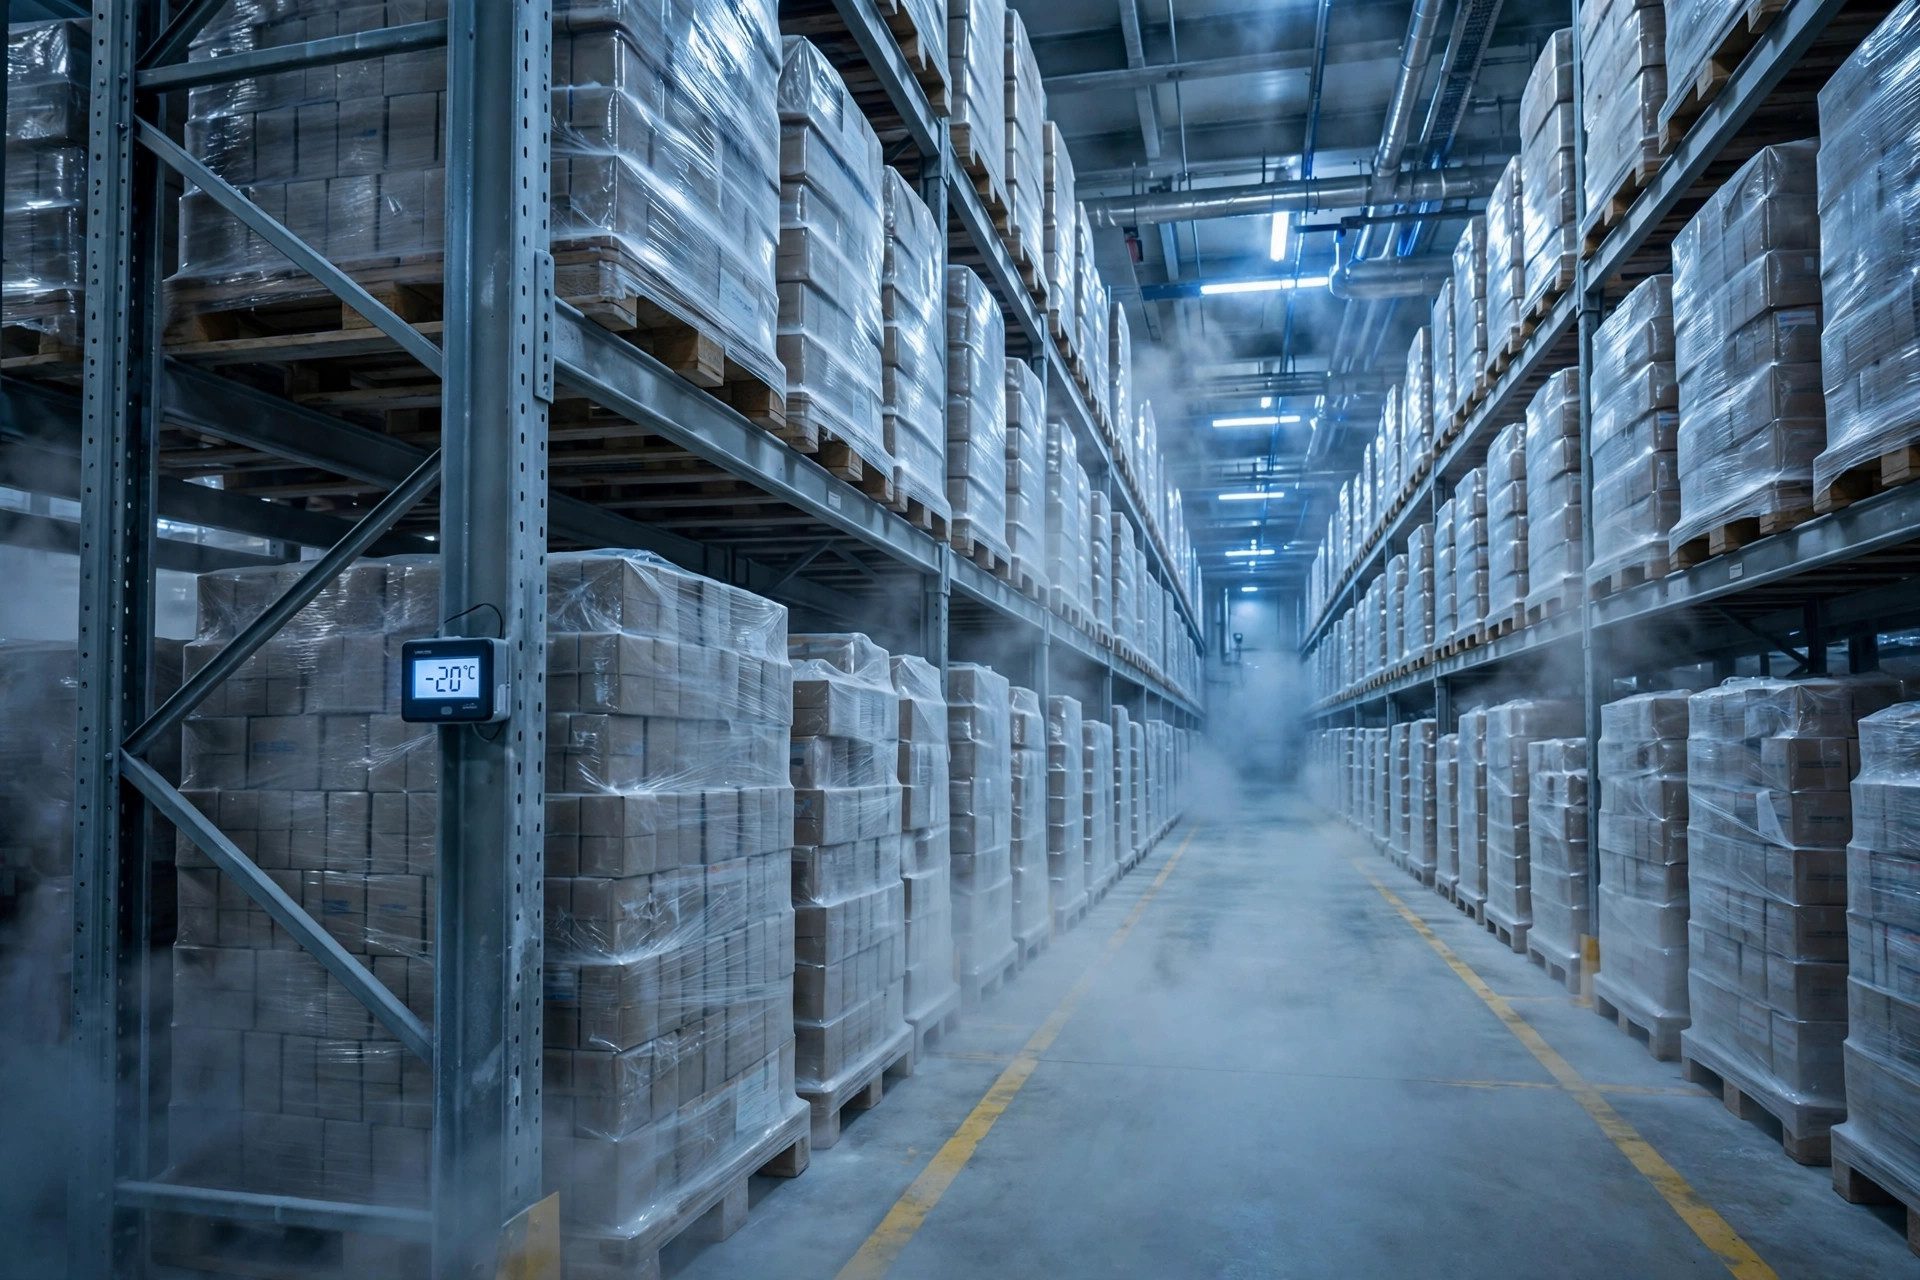
A thermal mapping study is simple in concept: you place a bunch of calibrated temperature data loggers all over the warehouse, run the facility empty once and fully loaded once, and each logger records a reading every 5 to 15 minutes for 24 to 72 hours straight. The result is a report proving that every corner of that building — door to back wall, floor to ceiling — stays within spec. For refrigerated pharma, that usually means 2-8°C.
Why do pharma customers care so much? Because drugs aren't electronics. If a pallet of consumer goods drifts two degrees, it's a shrug. If a shipment of vaccines or insulin drifts two degrees, the whole batch is scrap — hundreds of thousands of dollars gone, plus potential lawsuits. The regulations back the customers up, too: FDA 21 CFR Part 211, EU GMP, and the WHO guidelines all expect storage conditions to be validated (check the latest official policy for current details). When a customer asks for the report, they're really asking one question: is this warehouse the real deal?
Auditors look for three things in these reports: first, the high, low, and average at every point — did anything step outside the 2-8°C band; second, if something did go out of range, how long it stayed there and what was happening at the time; third, whether the loggers' calibration certificates were current. All three clean, the report passes. My advice to shippers: before you tender a load, ask the warehouse for three things — the latest mapping report (empty AND loaded), the daily temperature monitoring logs, and the record of how past excursions were handled. If the warehouse hems and haws, think twice about that load.

Temperature Mapping Point Layout: Nine Points Is the Floor
This is where most warehouses get it wrong, so pay attention.
Minimum: nine points. Remember it as a grid: three heights (low, middle, high) times three depths (front, middle, back). The door side is "front," the far wall is "back." Low means about a foot off the floor, middle is mid-rack, high is about a foot below the ceiling. Three times three is nine — the absolute floor, no matter how small the building.
Big warehouses: 30 to 50 points. The bigger the box, the weirder the airflow. I've seen hundred-thousand-square-foot pharma distribution centers mapped with forty-plus loggers, with extra points at the doors, across from the evaporator fans, and in all four ceiling corners.
Two runs, not one: empty AND loaded. The empty run tells you whether the building itself holds temperature. The loaded run tells you whether it still holds once the racks are full of product blocking the airflow. Plenty of warehouses skip the loaded run to save money — that Columbus warehouse was one of them. Stack the racks full, and points that passed empty can swing 1-2 degrees.
Here's what the layout looks like from the side (● = logger):
Ceiling ┌──────────────────────────┐
High    │ ●back corner  ●mid  ●over door │ ← hot air rises; worst data lives here
        │     ┌──────────────┐     │
Middle  │     │  ●mid-rack   │     │
        │     │  loaded racks │     │
Low     │ ●back      ●mid    ●inside door│ ← door cycling hits hardest here
Floor   └──────────────────────────┘
         Back (far wall)    Front (doors)
The 5-step execution checklist:
| Step | What to do | Key numbers |
|---|---|---|
| 1. Prep | Rent or buy calibrated loggers; calibration certs must be current | Expired calibration = wasted study |
| 2. Place | Grid of heights × depths; add points at high-risk spots | 9+ points small sites; 30-50 for large ones |
| 3. Empty run | Run the building empty (or at safety stock), doors operating normally | 24-72 hours, readings every 5-15 min |
| 4. Loaded run | Repeat with racks normally stocked, same points | Same protocol; best done in the hottest/coldest season |
| 5. Report + fix | Remediate any failures, re-test until everything passes | File the report — auditors will ask for it |
Do the math: a mapping study from a third-party firm costs a fraction of one truckload's freight bill — a trip or two of revenue. One scrapped batch of out-of-range product? That runs into the hundreds of thousands, plus claims and lost business. Every warehouse owner can do that arithmetic — the trouble is the ones who try to save the small money and end up losing the big money. That Columbus warehouse's lost service fees plus two weeks of re-testing downtime cost them many times what ten mapping studies would have.
Where Mapping Studies Usually Fail: The Door, the Ceiling Corners, and Across from the Coolers
Fifteen years of watching these reports, and the ugliest numbers always come from the same three places:
First, the doors. Summer is the killer. August 2019, I'm waiting on a load at a cold storage facility outside Dallas. It's pushing a hundred degrees outside, forklifts running in and out, and that dock door basically never closed all morning. Their mapping report later showed the point above the door peaking at 10.2°C — against an 8°C limit, more than 2 degrees over. The shipper went ballistic: the whole shipment quarantined, a month of stability assessments. The fix? They installed an air curtain plus PVC strip curtains and staggered their inbound and outbound windows. Re-test passed.
Second, the ceiling corners. Here's the counterintuitive one — most people assume the door is the hottest spot. It's not. Hot air rises, and ceiling corners have the worst ventilation in the building; heat just parks up there and never leaves. The worst-looking data in a mapping report is up top more often than not. When placing loggers, don't skip a single upper corner — miss one and you might miss the real hotspot entirely.
Third, across from the refrigeration units. Dead zones the cold air never reaches, or spots where two units' airflow collides — temperatures there can run 2-3 degrees warmer than at the evaporator discharge. Your everyday fixed probes never cover these spots. Without a mapping study, you'd never know they exist.
Out of Spec? Three Fixes, Don't Panic
A study that passes everywhere on the first try is luck. A few points failing is normal. When it happens, three moves:
Fix one: air curtains and strip doors. Door failures are a door problem nine times out of ten. An air curtain keeps the hot air out, and it works fast — that's exactly how the Dallas facility got back in line.
Fix two: move the product. Ceiling corner running hot? Lower that rack level, or stop storing temperature-sensitive product there and switch it to packaging materials. Dead zone across from the coolers? Reorient the pallet stacks so they stop blocking airflow.
Fix three: turn failed points into permanent monitoring points. Every hotspot the study found should get a fixed probe wired into the daily monitoring system, with tight alarm thresholds. That's called learning from your mistakes. Next audit, when the auditor sees you're watching every spot that ever failed, that's an instant credibility boost.
One more thing: a mapping study isn't one-and-done. Renovate the building, overhaul the refrigeration, or reshuffle the racking — you re-map. Nothing changed? Re-run it about once a year. That Columbus report was three years old, and the auditor spotted it in ten seconds.
I'll leave you with an old saying from the road: an ounce of prevention beats a pound of cure — and in pharma cold chain, temperature is the whole business. One excursion and the entire batch is done; nobody can afford that blame. Spend the small money on a proper mapping study, keep the report solid, and everybody sleeps at night — the customer and you. That's a trade worth making.
By Shifu Zhao, Trucking Veteran (15 yrs)