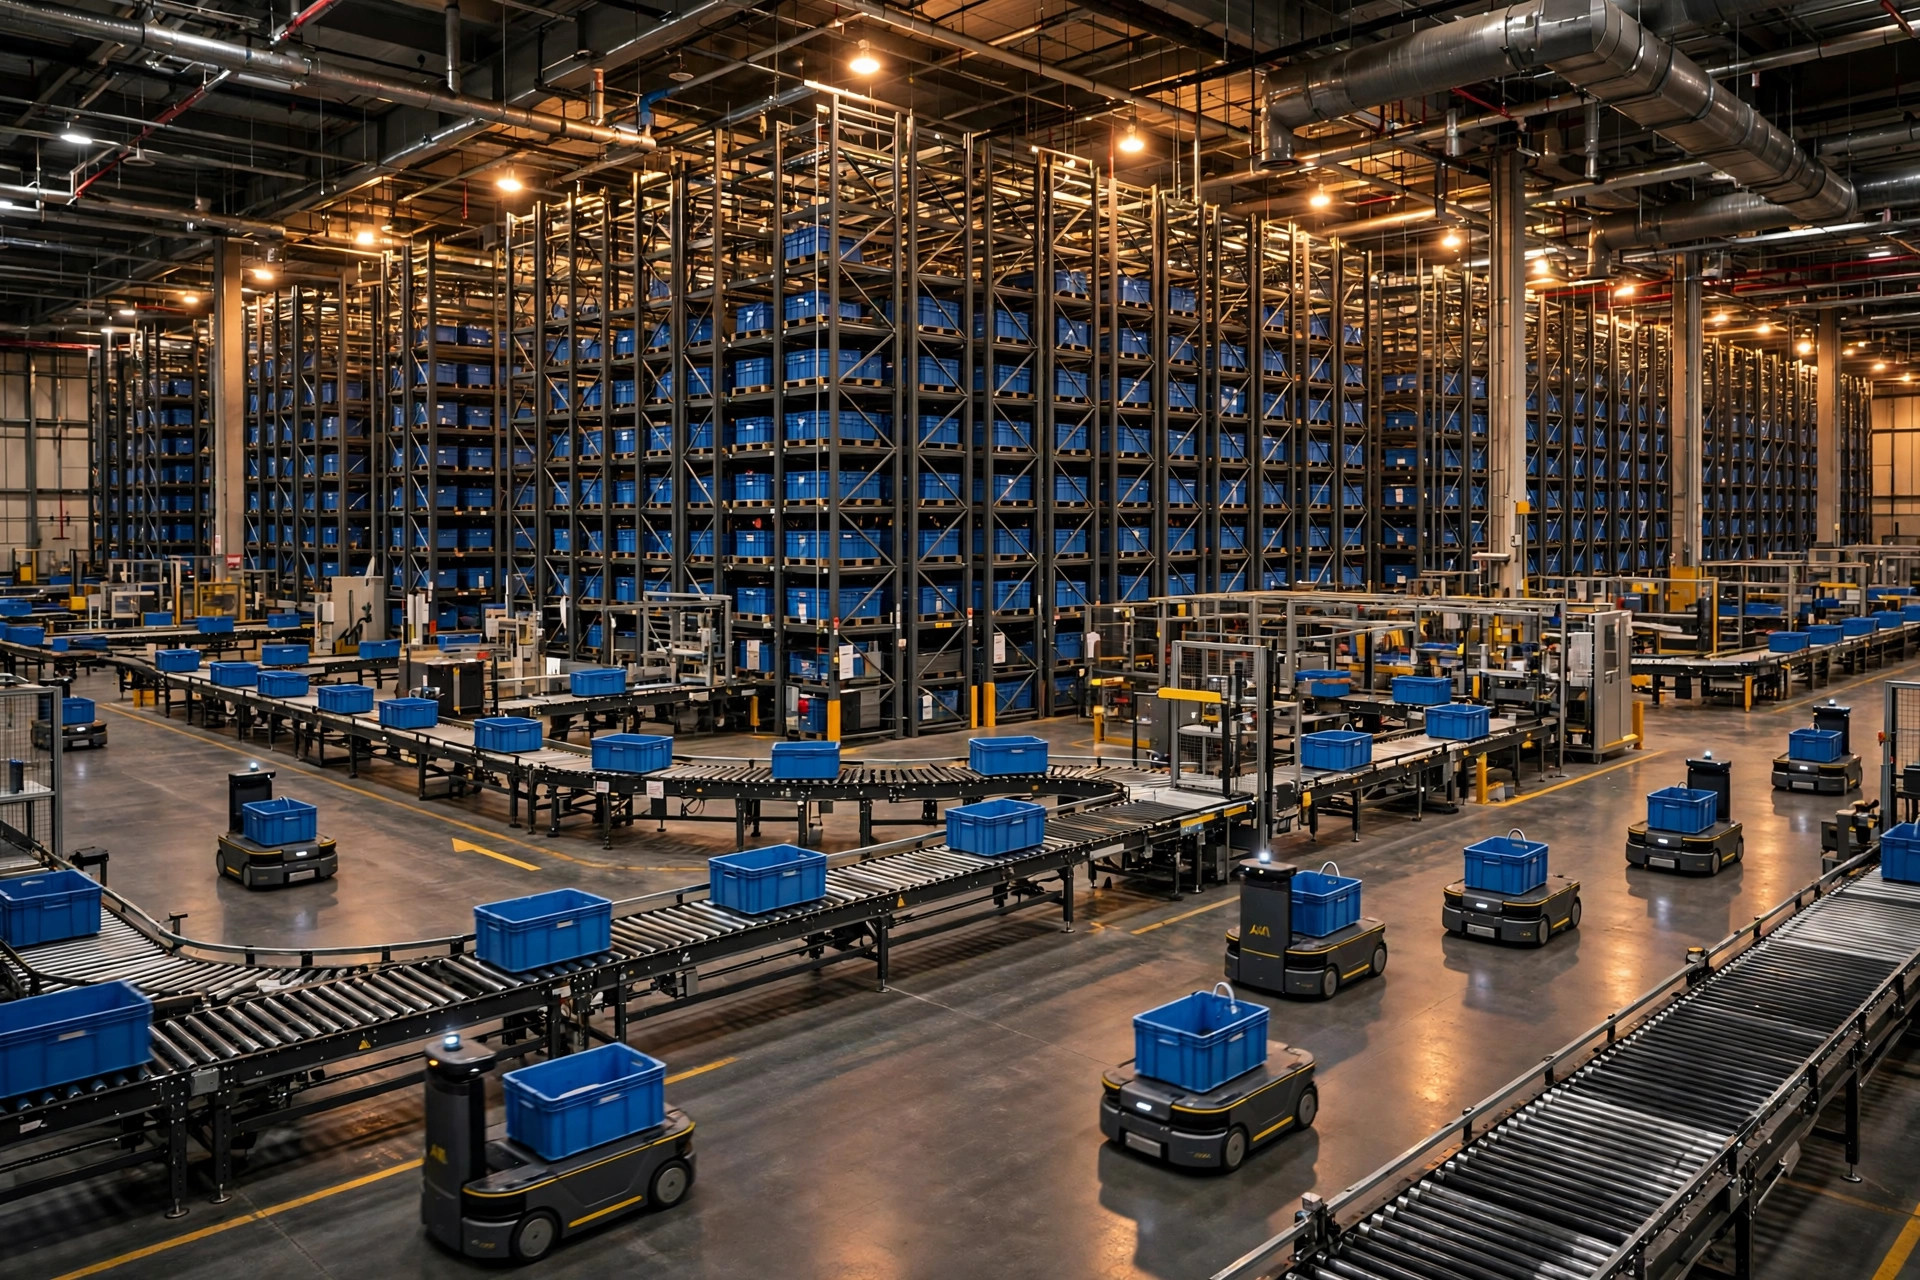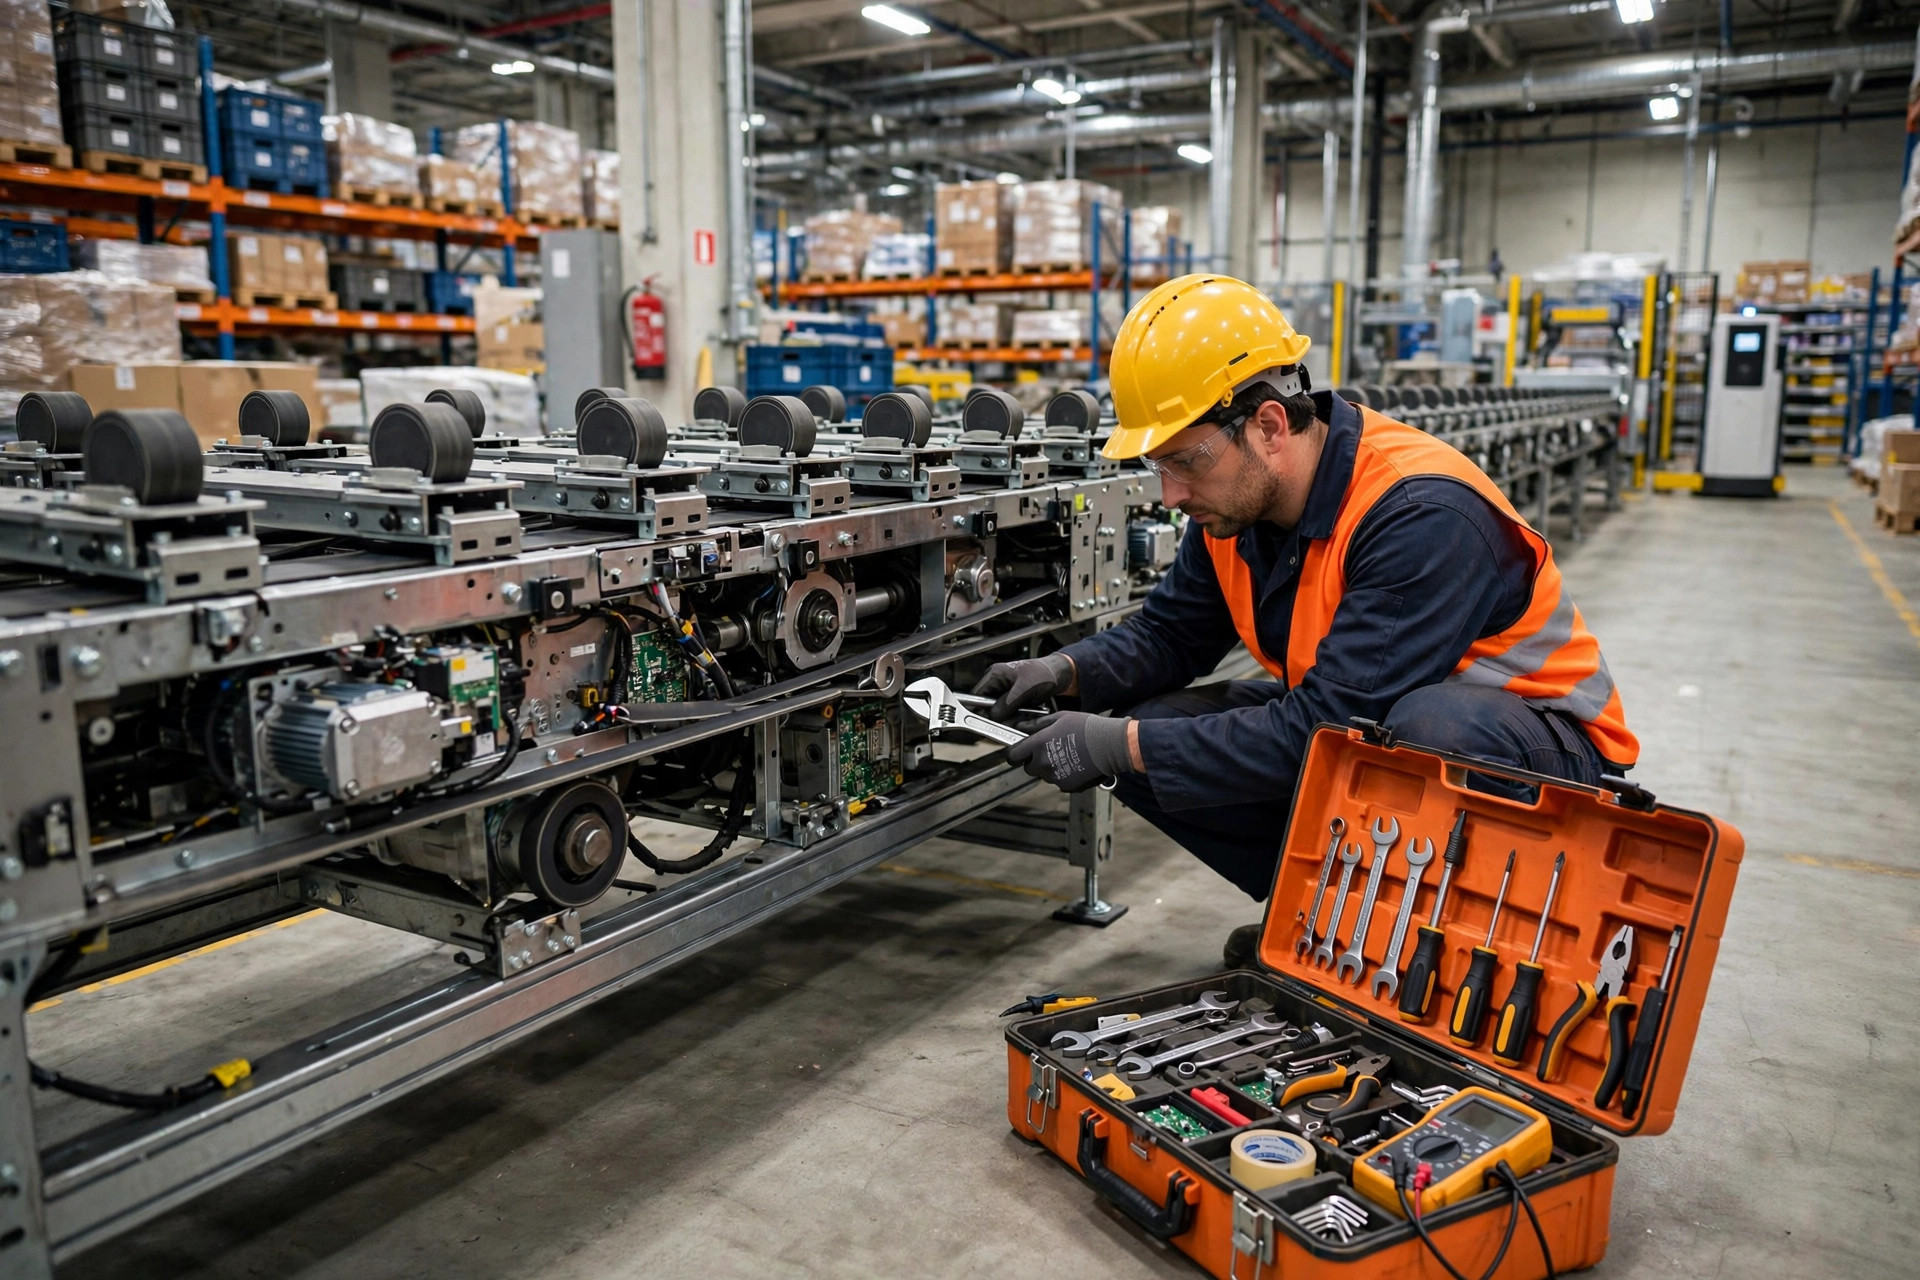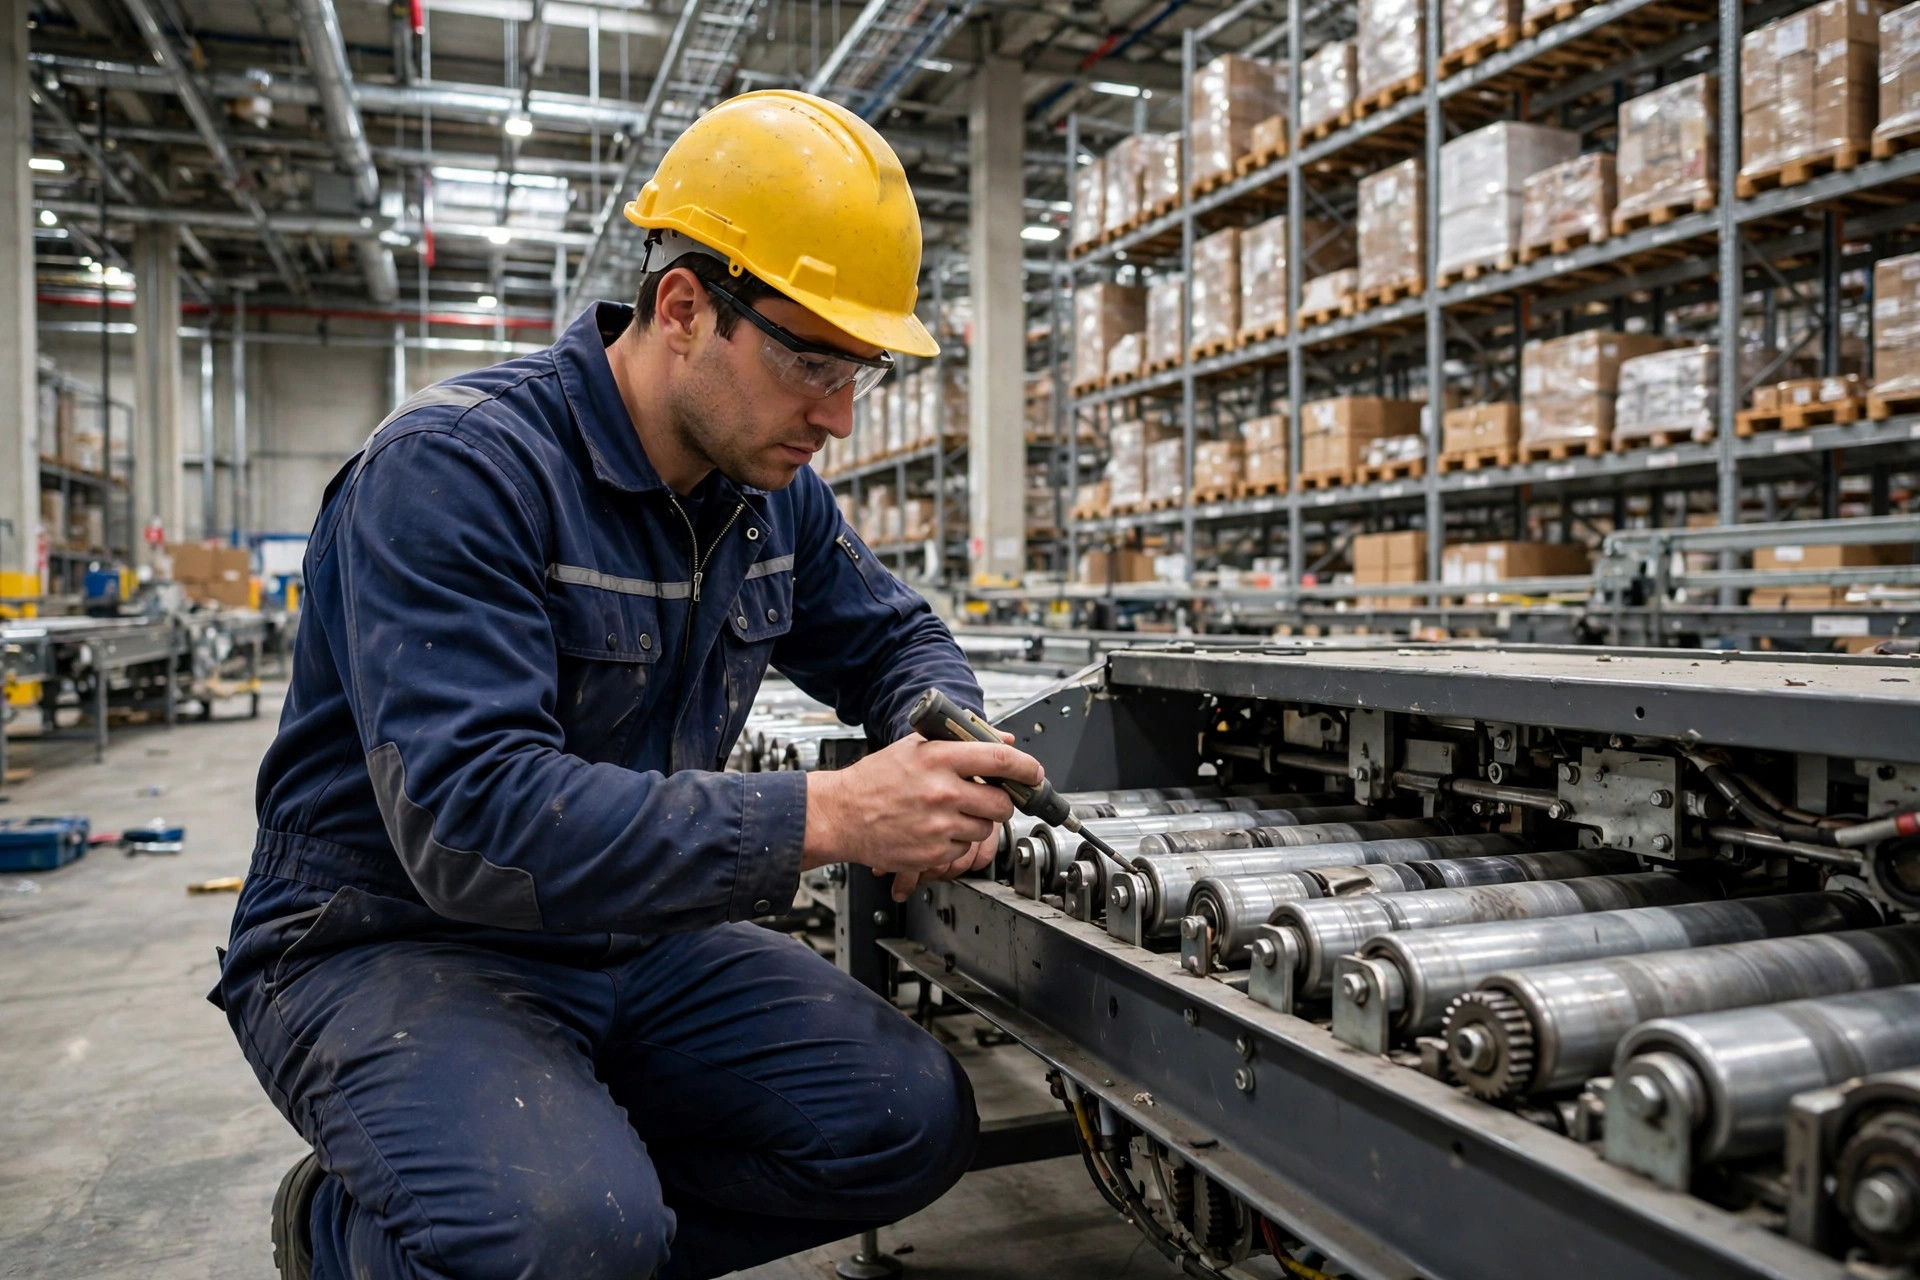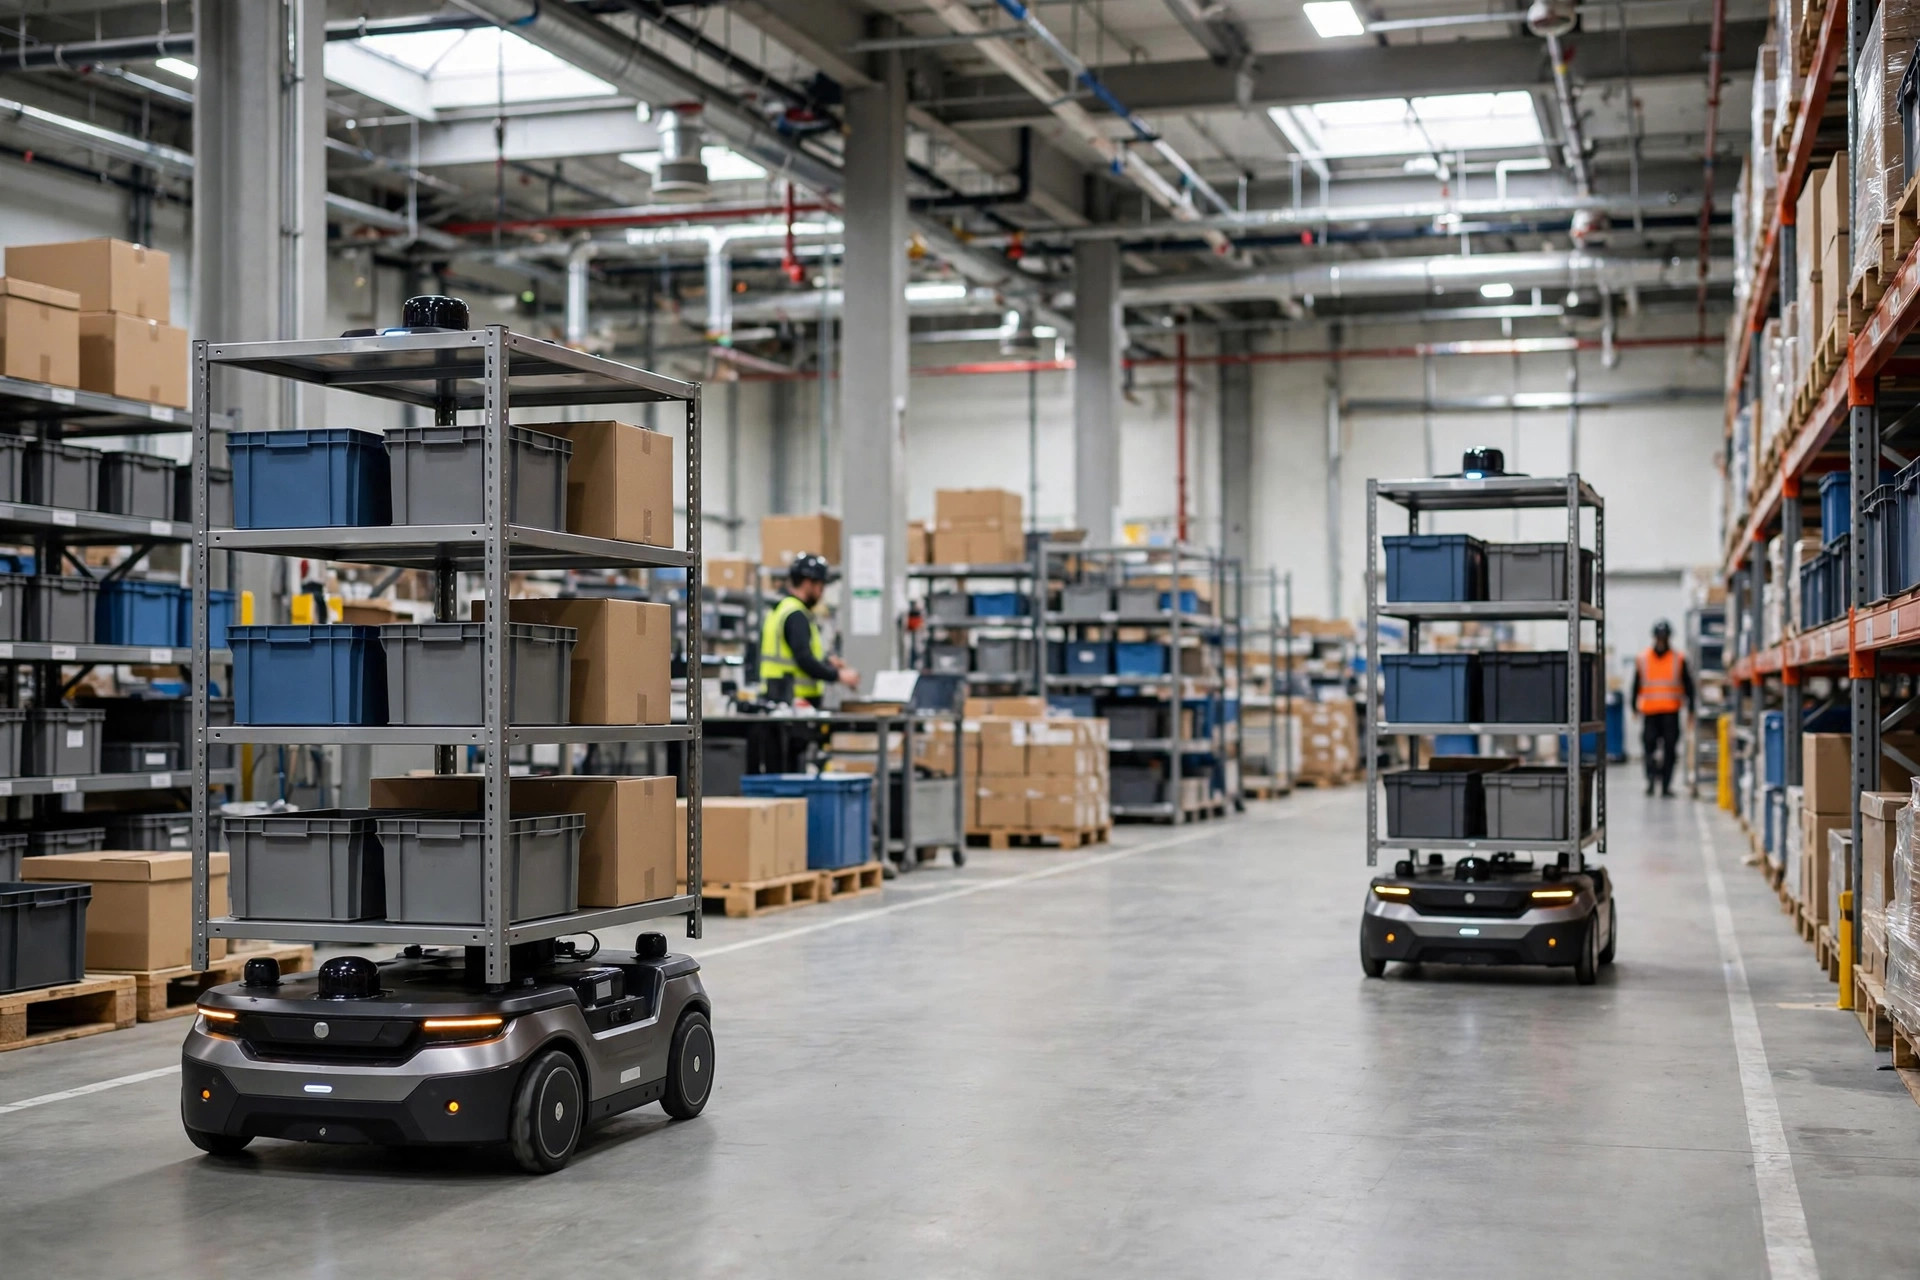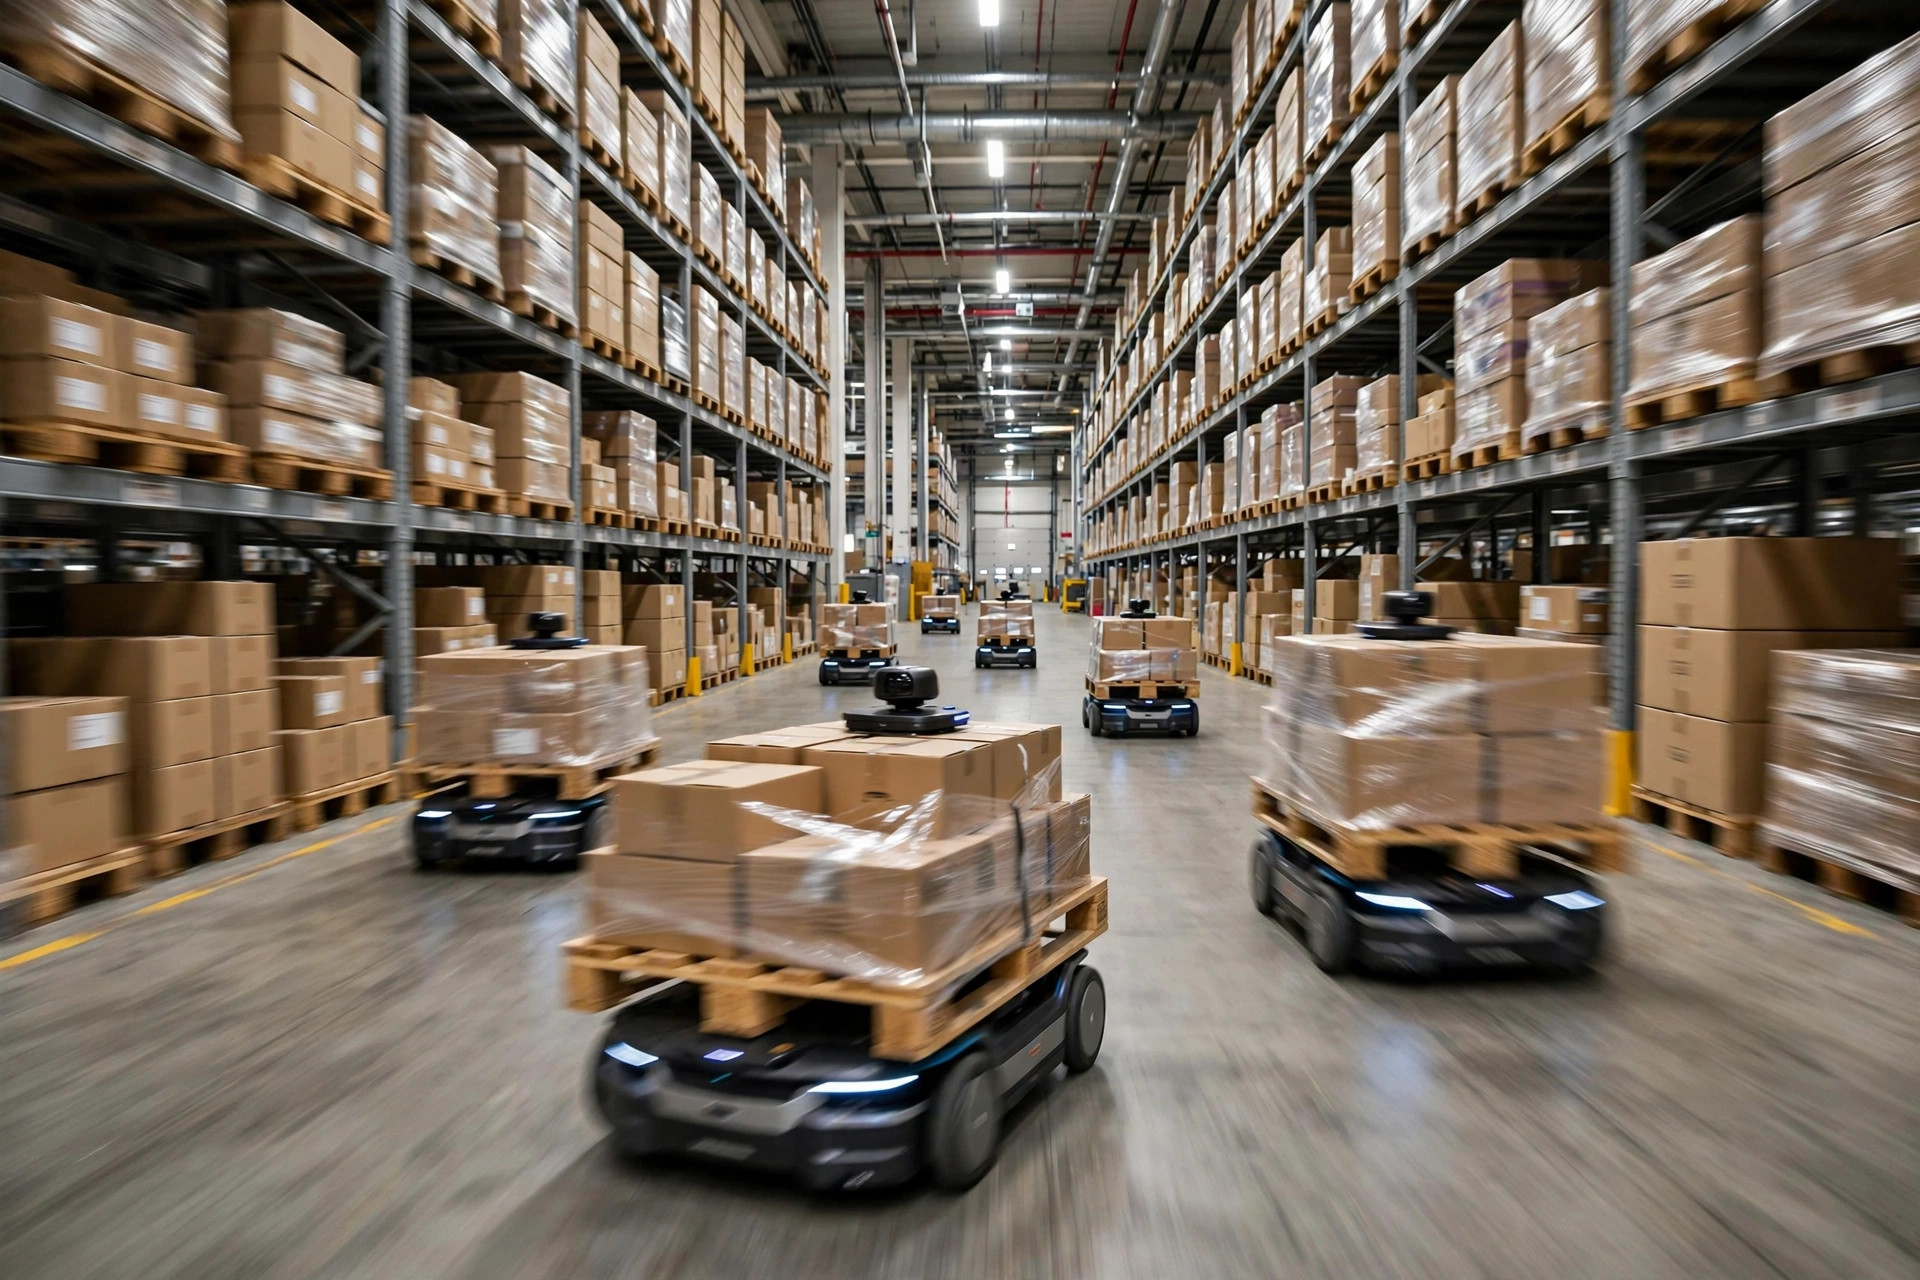
An apparel e-commerce warehouse went into its November 2023 peak season with 8 AMRs — bought without anyone seriously answering "how many AMRs do I need." By noon on day one, more than 300 transport tasks were queued waiting for a robot. Pickers stood idle. Orders didn't ship. The owner called in temp labor — 40-plus extra hands for three days, plus a few late-shipment penalties. Afterward, finance added it up: those three days of firefighting cost more than two additional robots would have. The money wasn't wasted on expensive robots. It was wasted on never calculating how many were actually needed.
The answer doesn't require mysticism. It requires three numbers. The method below survived dozens of AMR project post-mortems I've reviewed. Take it and use it.
How Many AMRs Do I Need? Do the Math First
The fleet sizing formula fits on one line:
N = T × C ÷ (60 × A)
- T: peak-hour transport tasks (tasks/hour). Peak, not average.
- C: full robot cycle time in minutes, measured on your floor — dispatch, deadhead to pickup, lift, travel, drop, return to staging.
- A: fleet availability — the share of time the fleet is actually working after charging, obstacle slowdowns, and idle gaps.
Example: 120 tasks/hour at peak, 4-minute cycle, 85% availability.
N = 120 × 4 ÷ (60 × 0.85) = 480 ÷ 51 ≈ 9.4, round up to 10, add 1 spare: 11 robots.
Three inputs, three traps. Size T from averages and peak season will kill you — e-commerce peaks routinely run 2–3× normal volume (typical figures compiled from multiple warehouse reviews). Take C from the vendor brochure and you're believing marketing — vendors test on an empty floor driving straight lines; your warehouse has turns, people, and pallets in the way, so C must be stopwatch-measured across 50 real tasks. Assume A = 100% and you're pretending robots never charge — the next section prices that fantasy.
The Charging Tax Nobody Budgets For
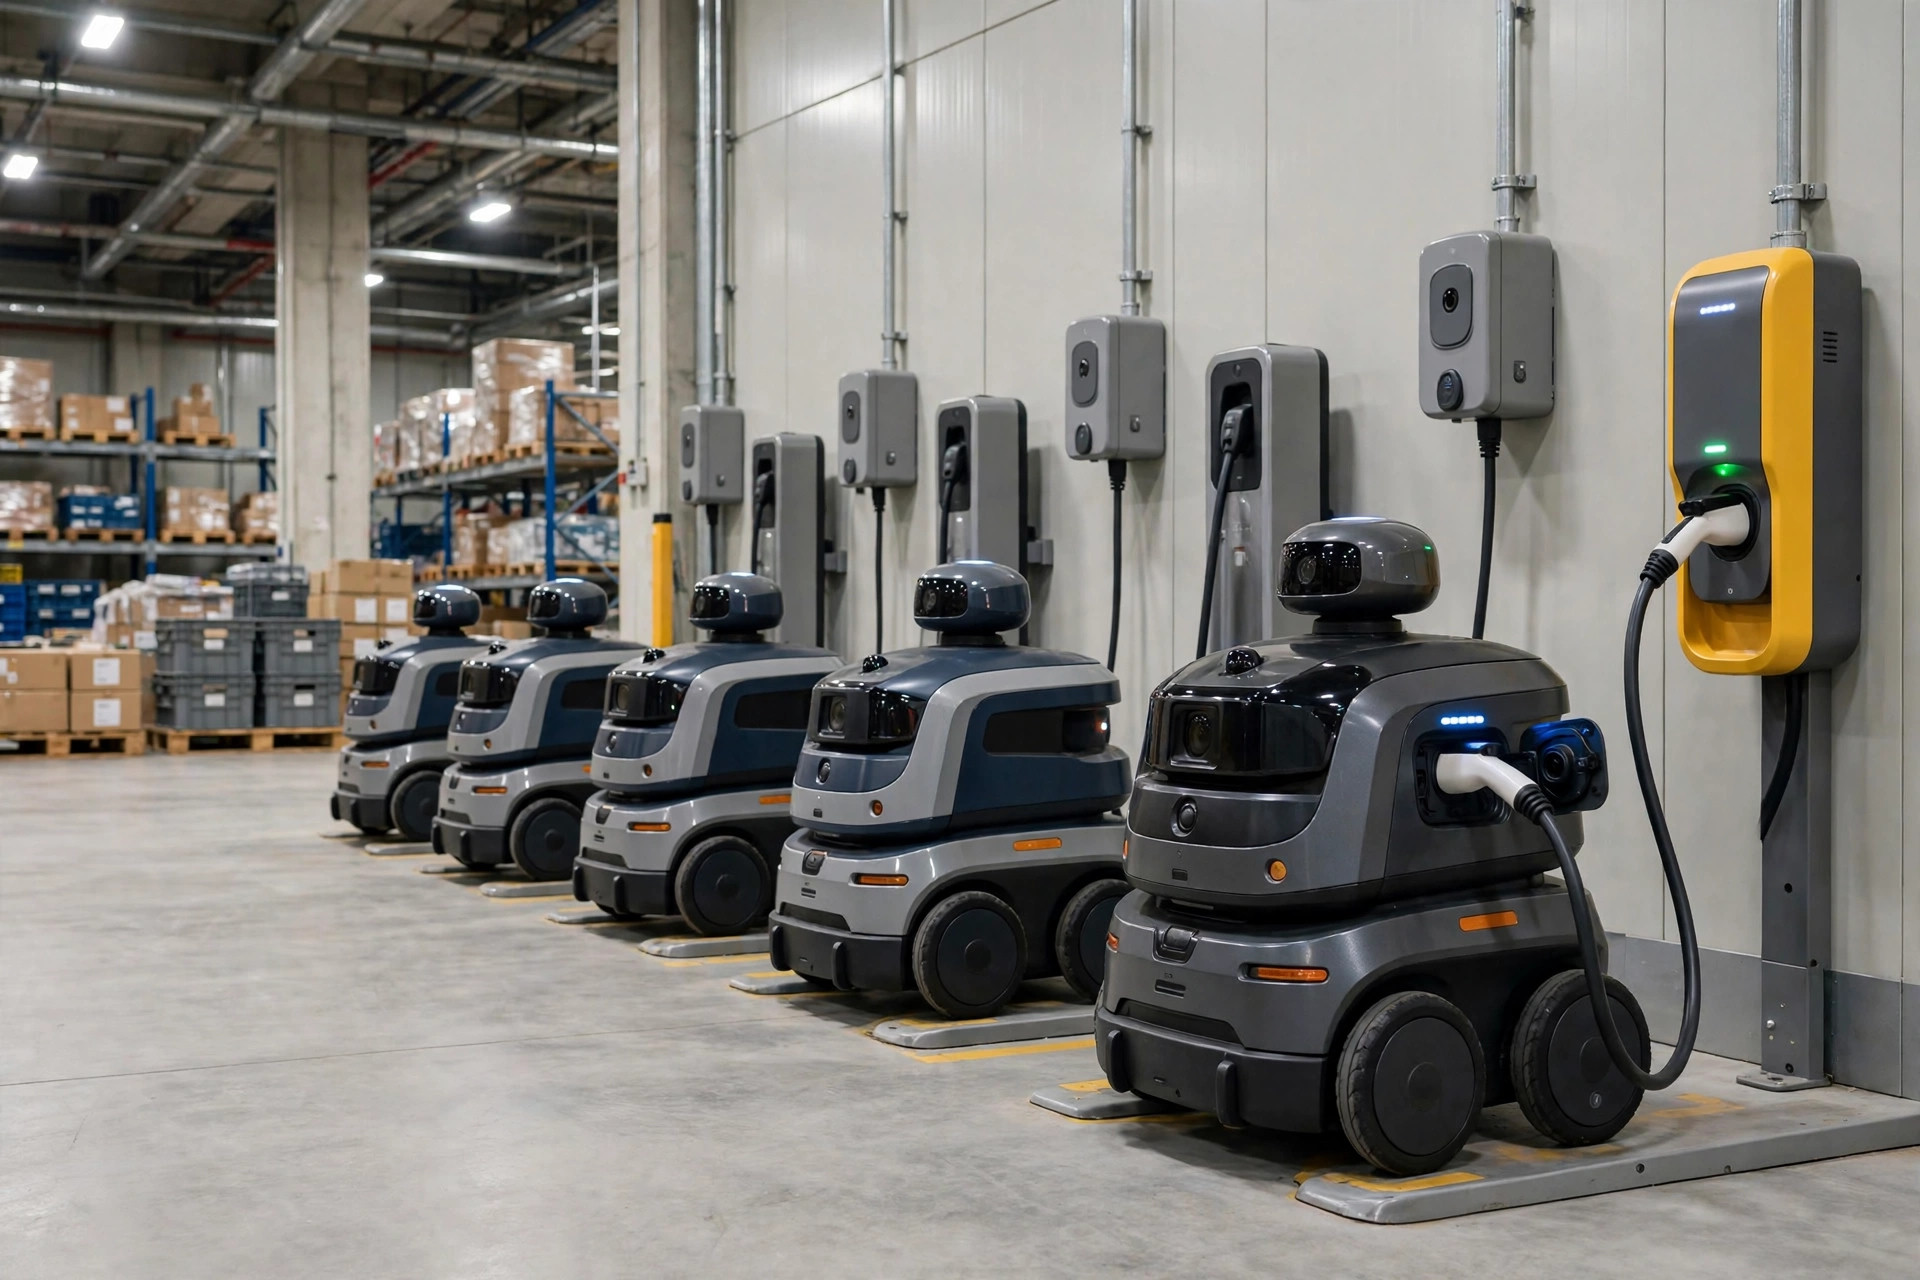
Published vendor data puts a full charge at 12–15 hours of continuous runtime, with robots auto-docking to top up when idle. Sounds generous — now convert it. Two shifts is 16 hours, so that's at least one full charge cycle per day; even fast charging takes 1–2 hours. Add robots sitting at the dock during task lulls and slowdowns around obstacles, and 85% availability is optimistic. 80% is the safer planning number.
What does that 15% cost in robots? Back to the example: dropping A from 100% to 85% moves N from 8 to 9.4 — a two-robot difference after rounding. The most common way pilot projects die is sizing at A = 100%, buying two robots short, and learning the lesson on day one of peak.
What Under-Buying Actually Costs: One Peak Season, Itemized
Composite case below — typical figures compiled from post-peak reviews at several e-commerce warehouses. Not one specific company, but every line item happened somewhere real:
- Normal days: 60 tasks/hour. Eight robots deliver 8 × 60 × 0.85 ÷ 4 = 102 tasks/hour of capacity — comfortable headroom.
- Peak: 140 tasks/hour.
- The formula says: 140 × 4 ÷ 51 ≈ 10.98, round up to 11 robots. Actual fleet: 8. Short by 27%.
Consequences: task queues, idle pickers, average fulfillment time stretched from 2 hours to 9. Firefighting: 40-plus temp workers over 3 days, late-shipment penalties, and the management cost of overnight chaos. Post-mortem math: three days of firefighting for "the 3 robots we didn't buy" cost more than two robots' purchase price. The money saved by buying fewer robots was paid back with interest in three days — plus the customer experience damage, which never appears on an invoice. Money wasted.
Over-Buy vs. Under-Buy, Side by Side
| 2 robots too many | 2 robots too few | |
|---|---|---|
| Extra cost | Purchase + depreciation on 2 units | Peak-season temp labor + late penalties |
| Probability | 100% — already spent | Near-certain, every peak season |
| Duration | Spread over 5-year depreciation | Recurs every peak |
| Worst case | Idle robots, ugly utilization | Orders don't ship, customers churn |
| Reversibility | Resell or redeploy to another site | Emergency rentals: expensive, maybe unavailable |
Anyone with a finance background understands this: a certain, bounded, amortizable loss beats an uncertain, recurring one with reputation damage attached. Over-buying costs are fixed, finite, and depreciable. Under-buying costs are uncertain, repeat annually, and carry goodwill losses that never show up on the invoice.
Renting Your Peak: RaaS as a Pressure Valve
Another composite case: a US 3PL needs 10 robots normally and 14 in Q4. Their answer: buy 10, rent 4 more on RaaS (robotics-as-a-service, monthly billing) for the season. RaaS lets operations scale peak hardware without upfront capital expense, then return the units. Buying all 14 outright means 4 robots sit idle 9 months a year; renting means paying for 3 months. Which is cheaper? Put both quotes side by side and multiply — but first, calculate how many you're actually short. Back to the formula in section one.
The Uncomfortable Truth: It's Not the Robots That Are Expensive
Two judgments most buyers get backwards:
First, under-buying costs more than over-buying. The table above already proved it.
Second, a fleet running under 60% utilization is money parked at the charging dock. AMRs are engineered as 24/7 machines; running them a single shift doubles the cost per task. Before buying, ask yourself: do I have enough tasks to feed these robots? If not, what you need right now isn't robots — it's volume. Getting fleet size wrong kills two ways: too few and peak season collapses; too many and depreciation bleeds you on quiet days. The second one at least doesn't lose customers.
The Lookup Table
Assumptions: 4-minute measured cycle time, 85% availability, round up, then add 1 spare.
| Peak tasks/hour | Formula result | Buy (with spare) |
|---|---|---|
| 60 | 5 | 6 |
| 120 | 10 | 11 |
| 200 | 16 | 17 |
Running 6-minute cycles (bulky goods, long hauls)? Multiply by 1.5. Running three shifts around the clock? Re-run with 80% availability.
Three Numbers, Your Answer to How Many AMRs You Need
Don't ask the salesperson "how many do warehouses like mine usually buy" — they'd love to sell you more. Don't guess either. Pull three numbers: first, last year's peak-day hourly task curve from your WMS; second, a stopwatch-measured cycle time across 50 real tasks; third, availability at 85% to start. Plug into N = T × C ÷ (60 × A), round up, add one spare. That number is your answer to how many AMRs you need. Do the math before negotiating price — get the order backwards, and every dollar is wasted.
By Lao Zhou, Logistics Cost Analyst