Let me open with a number, not an opinion.
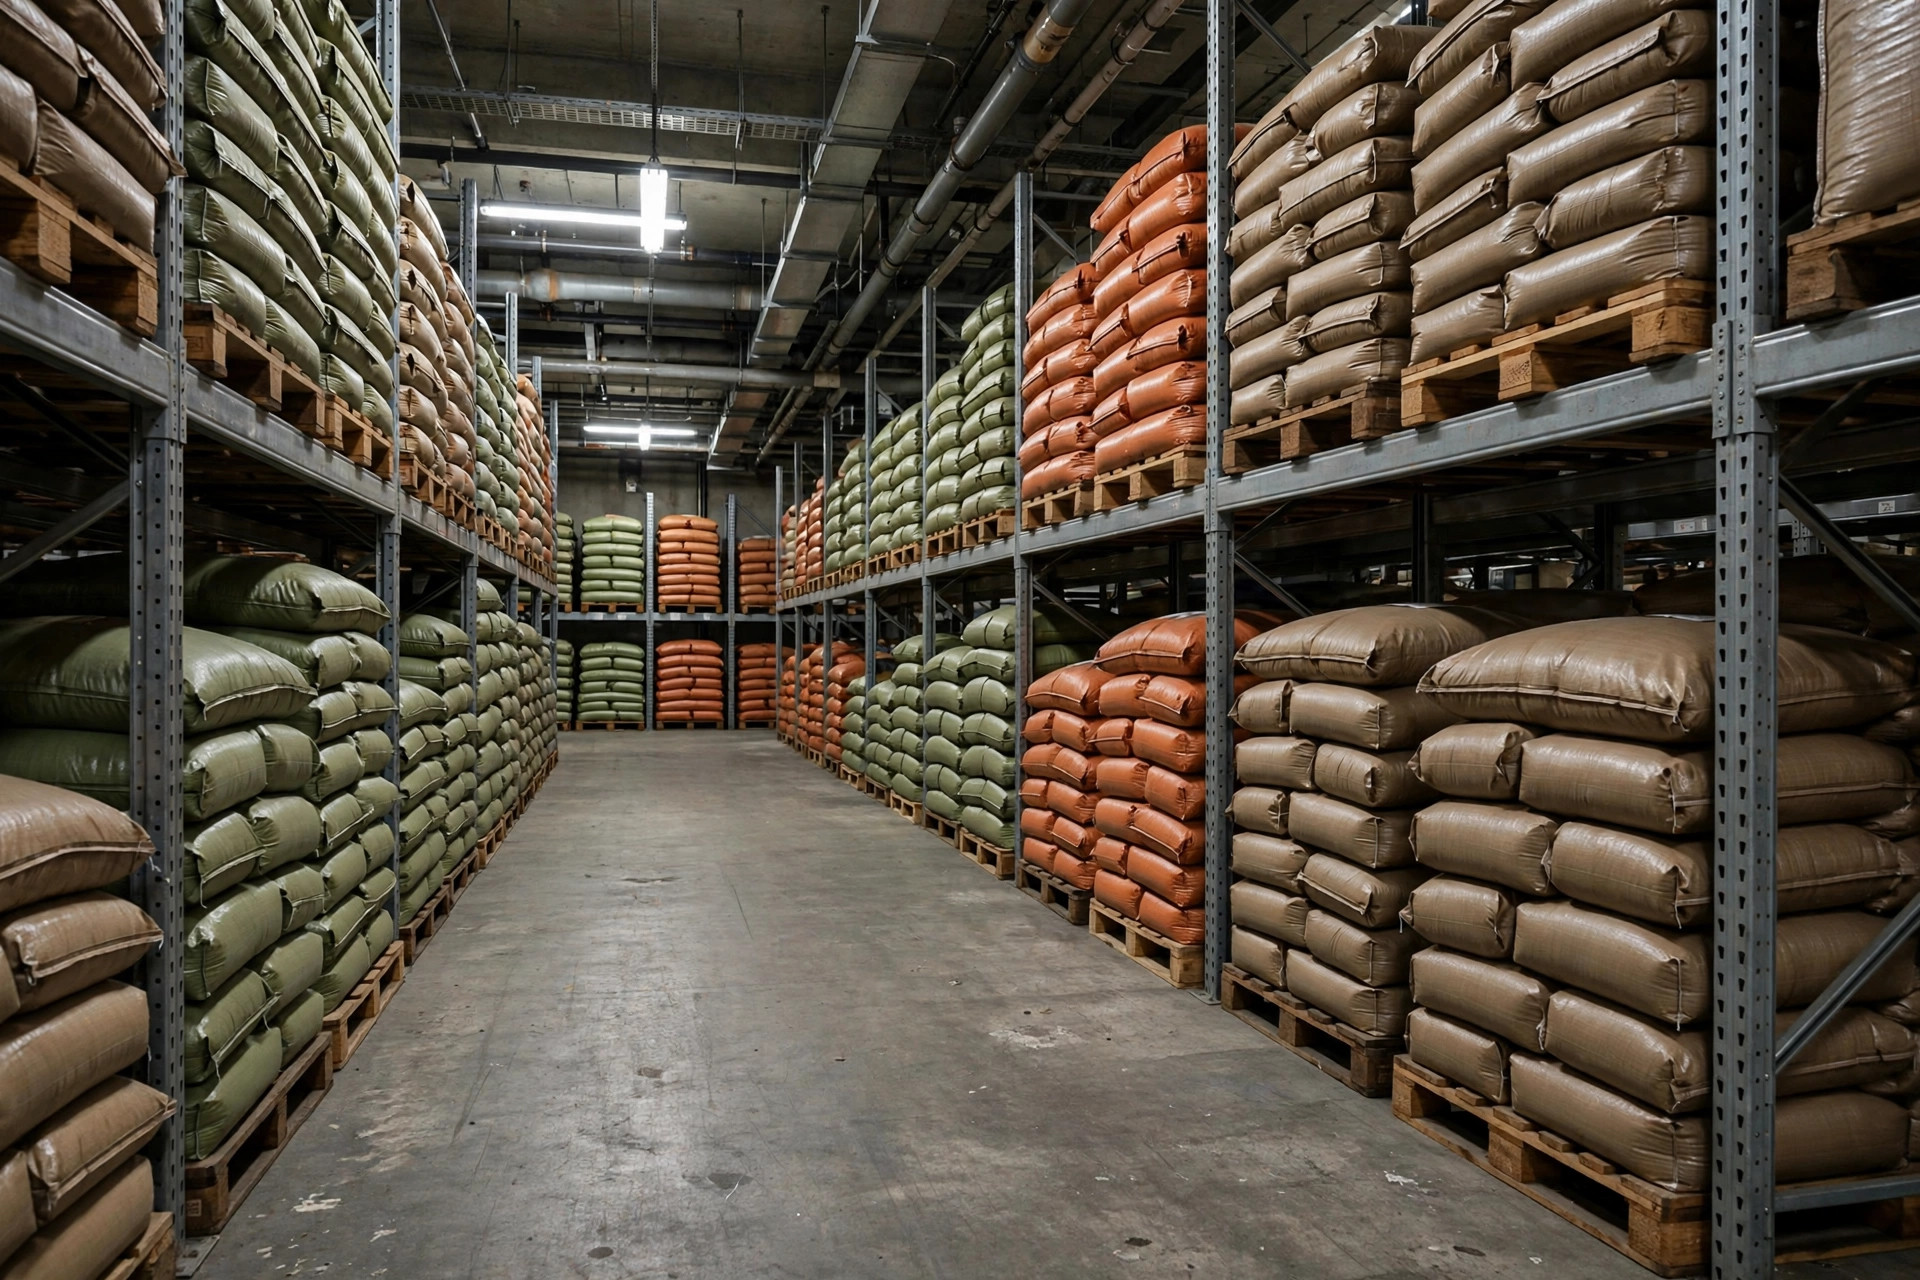
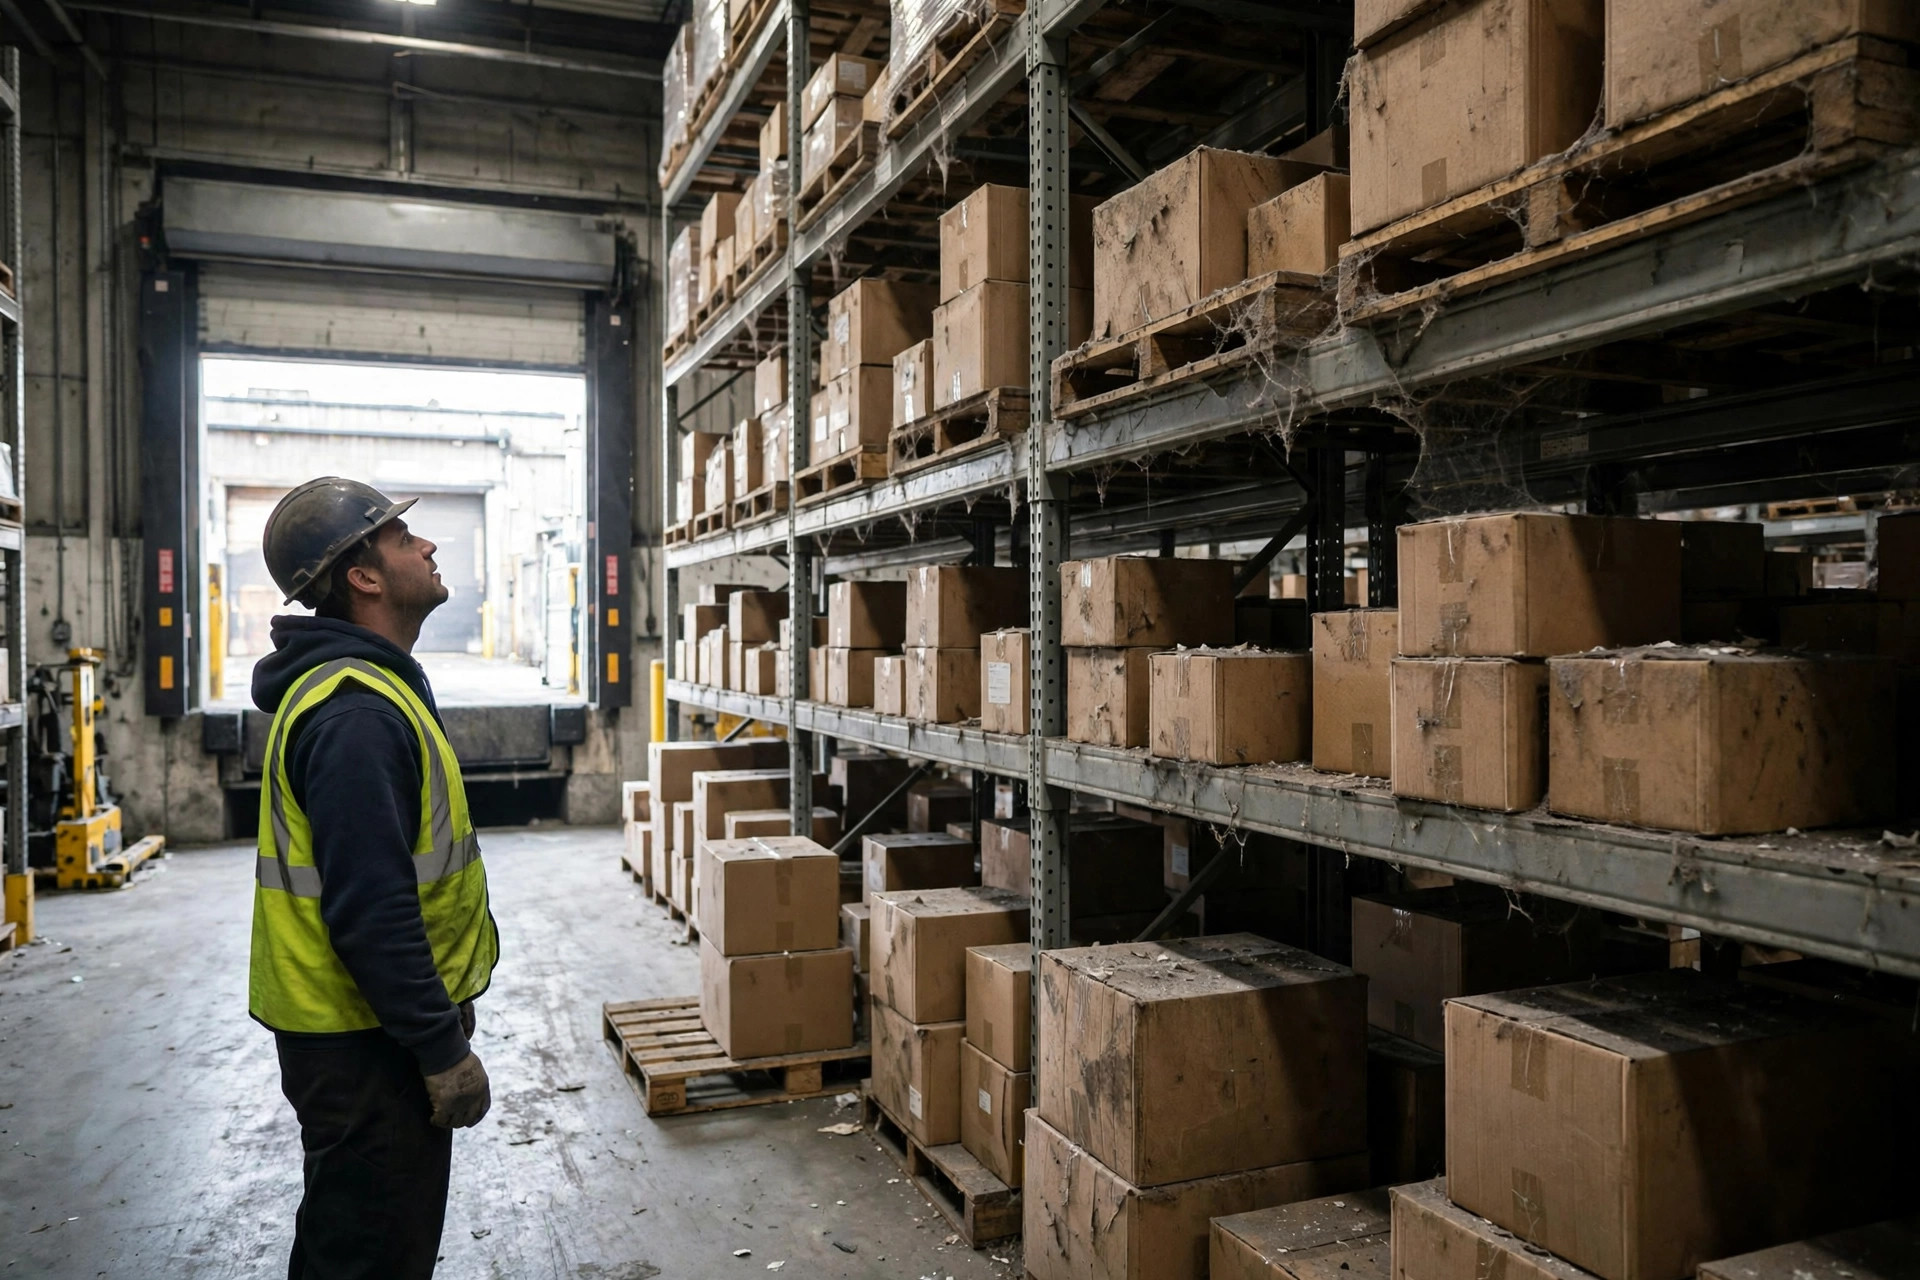
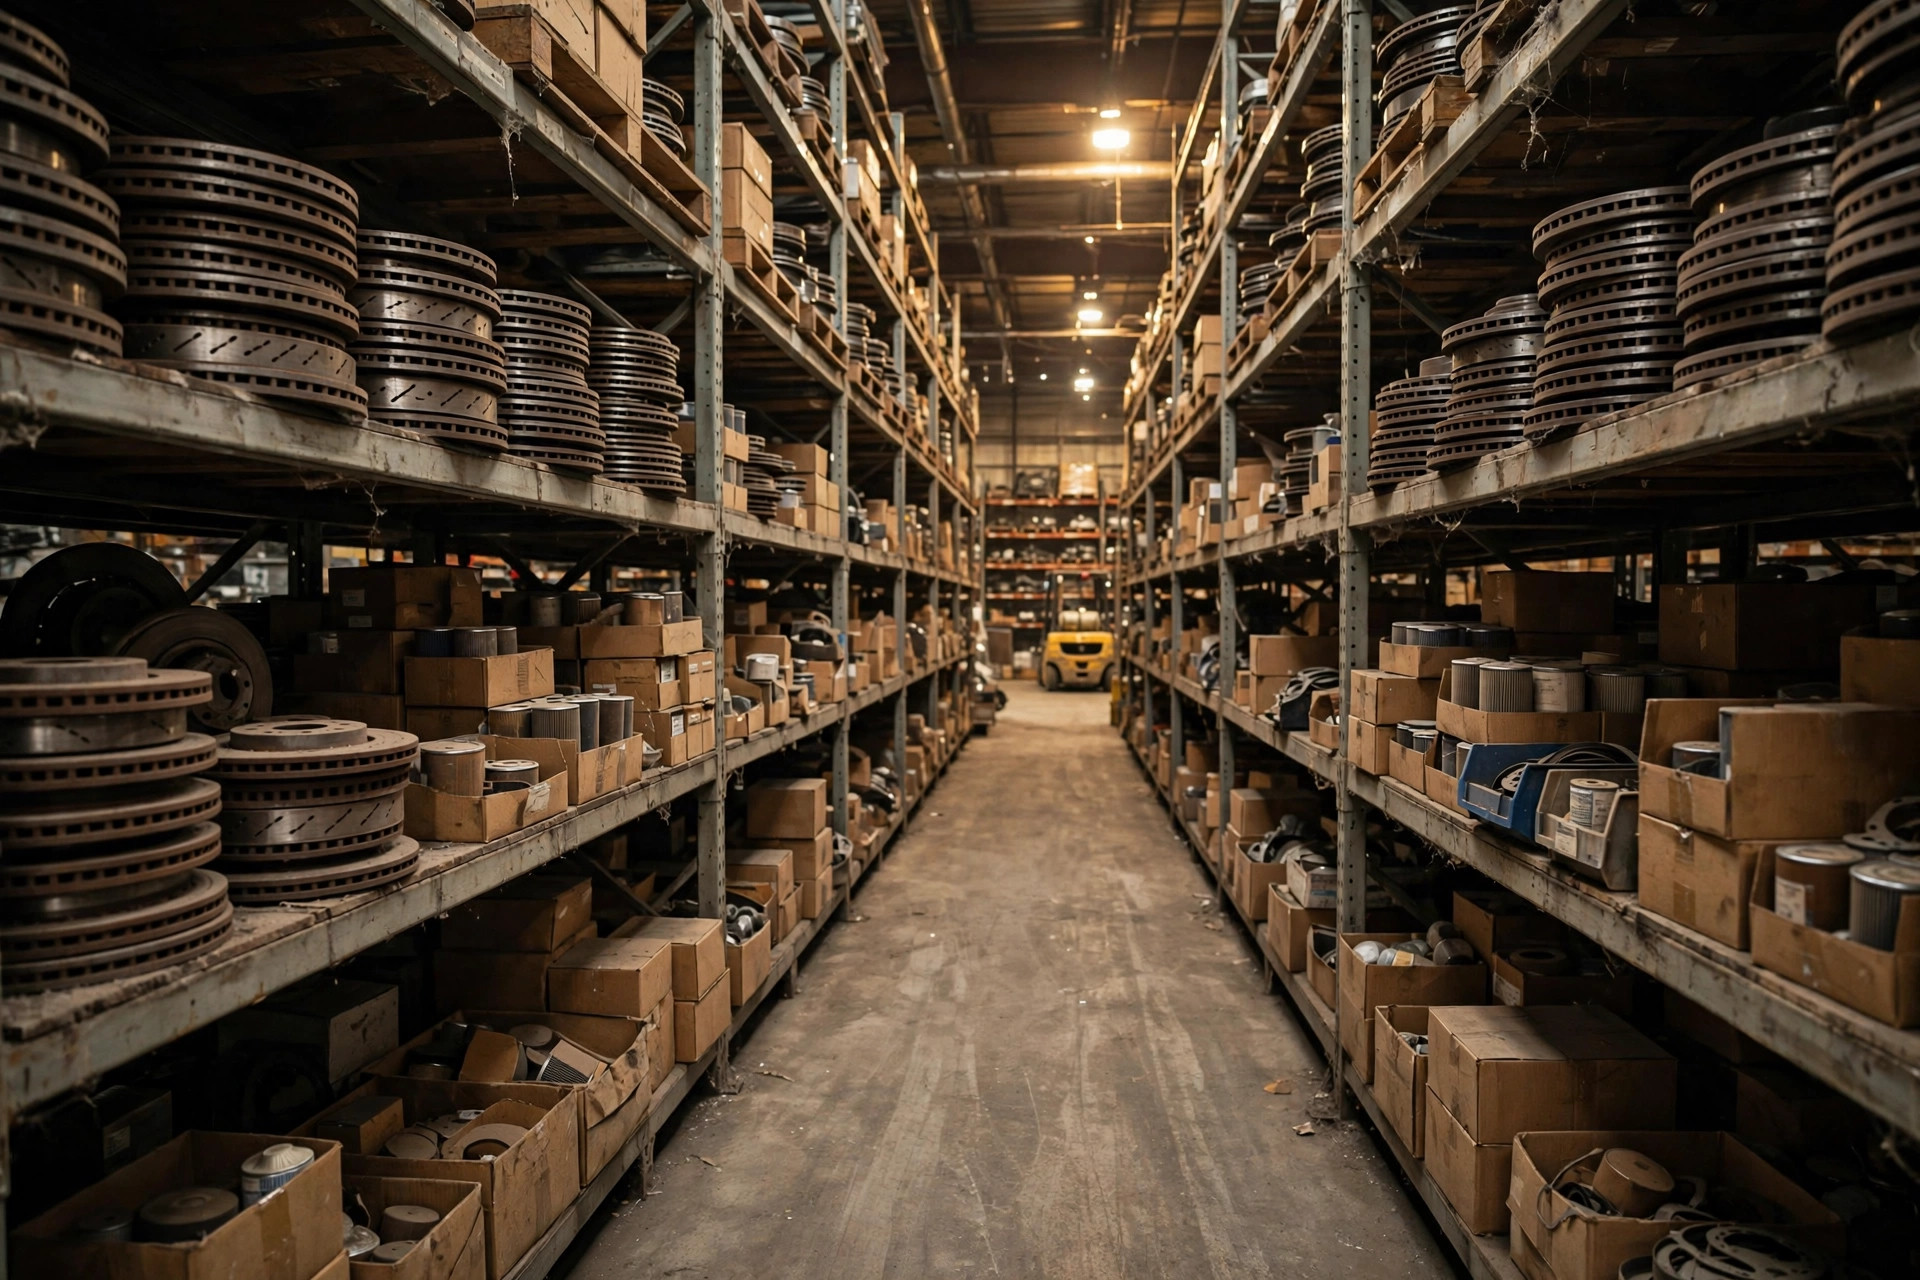
In 2024 I walked a 3PL warehouse in Ontario, California, and counted four pallets of brake pads — 2,400 sets, fitment for the 2013–2017 Honda Accord, dead stock the moment the 2018 redesign killed demand overnight. The seller couldn't bring himself to write them off, so they sat. I ran the math: 4 pallet positions at $16 each per month (all rates below are estimate ranges — check your actual warehouse contract), that's $768 a year in storage. The landed cost was $17,280; at an 8% annual cost of capital, that's another $1,382 tied up. Sitting still cost $2,150 a year — 12.4% of the inventory's value, every year. By then it had sat for two years. The holding cost alone could have funded a fresh batch of current-model parts.
That is the truth about dead stock in auto parts ecommerce: it is not a one-time write-off, it is a monthly bleed. A model gets discontinued and the long-tail parts turn into obsolete inventory. The longer they sit, the more they cost.
Holding cost is really three separate bills, and every one of them is visible. First, storage: pallet positions billed monthly, no volume mercy. Second, cost of capital: cash frozen on a shelf that could be turning over elsewhere — at an 8% annual rate (an assumption for illustration; use your own financing cost), $17,280 of parts costs $1,382 a year just to own. Third, and most ignored: depreciation risk. The secondary market price of long-tail auto parts declines monotonically — the longer a model has been dead, the less anyone will pay. Take the Ontario brake pads: at the original 30% gross margin, the book profit was $5,184. Two years of holding costs burned $4,300 — 83% of the margin gone. One more year and the lot flips from profit to loss. The break-even point sits around month 29. The seller thought "sitting there costs nothing." The ledger disagrees.
Why Dead Stock Explodes in Auto Parts Ecommerce
Auto parts SKU counts multiply; they don't add. One brake pad family: SKU count = model years × models × engines × configurations. Ten Accord model years (2013–2022), two engines, with and without electronic parking brake — 40 SKUs from a single brake pad.
A real case: in early 2025, a New Jersey seller specializing in Ford truck parts ran the numbers on his headlight assemblies. The F-150's 2015–2020 generation, halogen vs. LED, left and right — 24 SKUs. The 2021 redesign turned all 24 into long-tail overnight. Nine of those SKUs dropped under 50 sets sold per year, yet storage plus capital costs ran $3,100 a year against a $22,000 total landed cost.
Auto parts inventory is structurally long-tail: 20% of SKUs drive 80% of revenue, and the remaining 80% hides a graveyard of discontinued-model parts. The question is never "do we have dead stock" — it's "how much, what is it costing, and when do we act."
Dead Stock vs. Obsolete Inventory: Drawing the Line
My dead-stock rule has two conditions, both required:
- Inventory age exceeds 365 days — counted from the last inbound receipt, not the first listing date.
- Last 90 days of sales can't cover 6 months of on-hand stock — i.e., average monthly sales × 6 < current inventory.
Hit both, and the SKU goes straight into the clearance lane. No more meetings. Why 365 days? Because holding cost for auto parts (storage + cost of capital) typically runs 20%–25% of inventory value per year. Two years of sitting eats half the value. Almost any clearance recovery beats "one more year."
Clearance Paths Compared
Five exits exist. Here is the recovery-rate, timeline, and hidden-cost comparison (recovery as a share of landed cost; ranges are typical industry observations, actual results vary):
| Clearance Path | Recovery | Timeline | Hidden Cost | Best For |
|---|---|---|---|---|
| Self-run discount sale | 30%–50% | 3–6 months | Keeps eating storage; burns ops time | Parts with residual demand |
| Bulk sale to liquidator | 10%–25% | 1–2 weeks | Near zero; one-shot handover | Large lots; urgent space needs |
| Vendor return | 40%–70% | 1–3 months | Freight on you; possible restocking fee | Purchase contracts with return terms |
| Donation for tax deduction | ≈25%–35% in tax value | 2–4 weeks | Compliance paperwork | US-based sellers at higher tax rates |
| Scrap/recycling | 5%–10% | 1 week | Disposal fees | Zero market; damaged goods |
The New Jersey seller ran three paths in parallel: vendor returns clawed back 55% of cost on 6 SKUs; 4 SKUs went to a liquidator at 18%; the last 2 SKUs with zero buyers were donated for roughly 30% in tax value. Blended recovery: 41%. His comment was honest: "If I'd acted a year earlier, those liquidator SKUs would have cleared at 35% instead of 18%." Recovery rates decay with time. Delay is itself a cost.
I audited his execution afterward, and the details are worth copying. The vendor return was negotiated in March 2025: 6 SKUs, 840 sets, the supplier agreed to credit 55% of cost against future purchases — but freight was on him, and the LTL shipment from New Jersey to Ohio ran $620, pulling actual recovery to about 51%. The 4 discount-sale SKUs sat on eBay and his own storefront for four months at 60% of landed cost, moving 70% of units; the remaining 30% went to the liquidator — which explains the 18%: liquidators buy other people's leftovers and price accordingly. The donated 2 SKUs went through a proper process with a 501(c)(3) organization, appraised at 70% of cost; at the 21% federal corporate rate the tax value worked out to roughly 30% of cost, though paperwork and appraisal took three weeks.
All three paths together: about $1,400 in execution costs (freight, labor, appraisal fees), $7,600 net recovered. Leaving all 12 SKUs to "wait for an opportunity" would have burned another estimated $2,700 in holding costs that year. Clearance is not admitting defeat — it is stopping the bleed. The sunk cost is already spent; what you are stopping is next month's cash outflow.

Priority order, no exceptions: vendor return → discount sale → bulk liquidator → donation → scrap. Return what you can. Discount what you can't return. Bulk-sell what won't discount. Donate what won't sell. Scrap the rest. At each step, run the number: expected discount-sale recovery minus 3–6 months of additional holding cost — if that's below the liquidator's offer, skip the discount and go straight to bulk.
Here is the calculable conclusion. For every SKU:
12-month holding cost = storage/month × 12 + landed cost × annual cost-of-capital rate
Immediate clearance net recovery = estimated recovery rate × landed cost − execution cost
If the second number is bigger than the first, start clearing today. "It might still sell" has no place in an inventory review. Numbers don't lie; shelves do.
By Lao Zhou, Logistics Cost Analyst