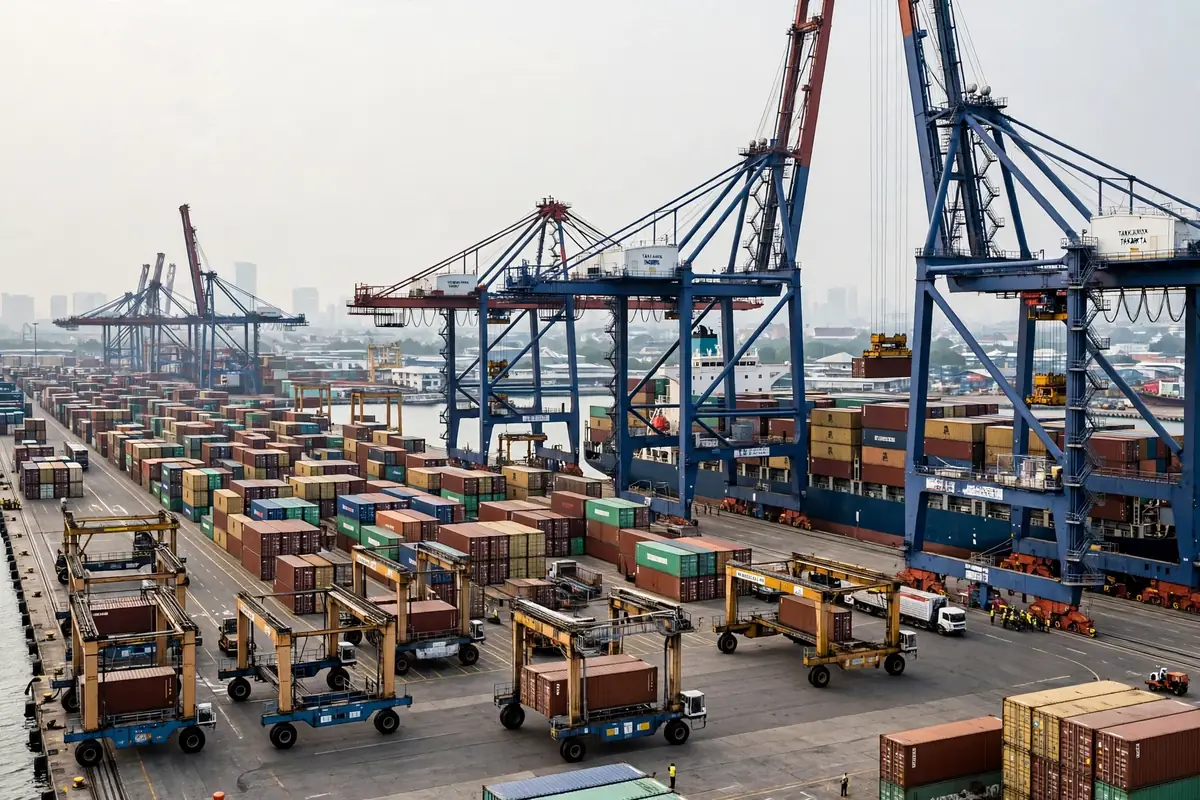
According to published port statistics, Tanjung Priok handled 7.6 million TEU in 2024, with roughly 14,089 vessel calls. The figure is worth pausing over, because Tanjung Priok Jakarta port warehouse logistics is not a niche topic for shipping specialists. This is Indonesia's largest and busiest container port, carrying more than half of the country's containerised trade, and Indonesia is the world's fourth most populous nation. The Jakarta metropolitan area alone holds more than 30 million people, and Java concentrates most of the country's industry and consumption. In effect, the efficiency of one port is close to the efficiency of half a nation's imports and exports.
What 7.6 Million TEU Actually Means at Tanjung Priok
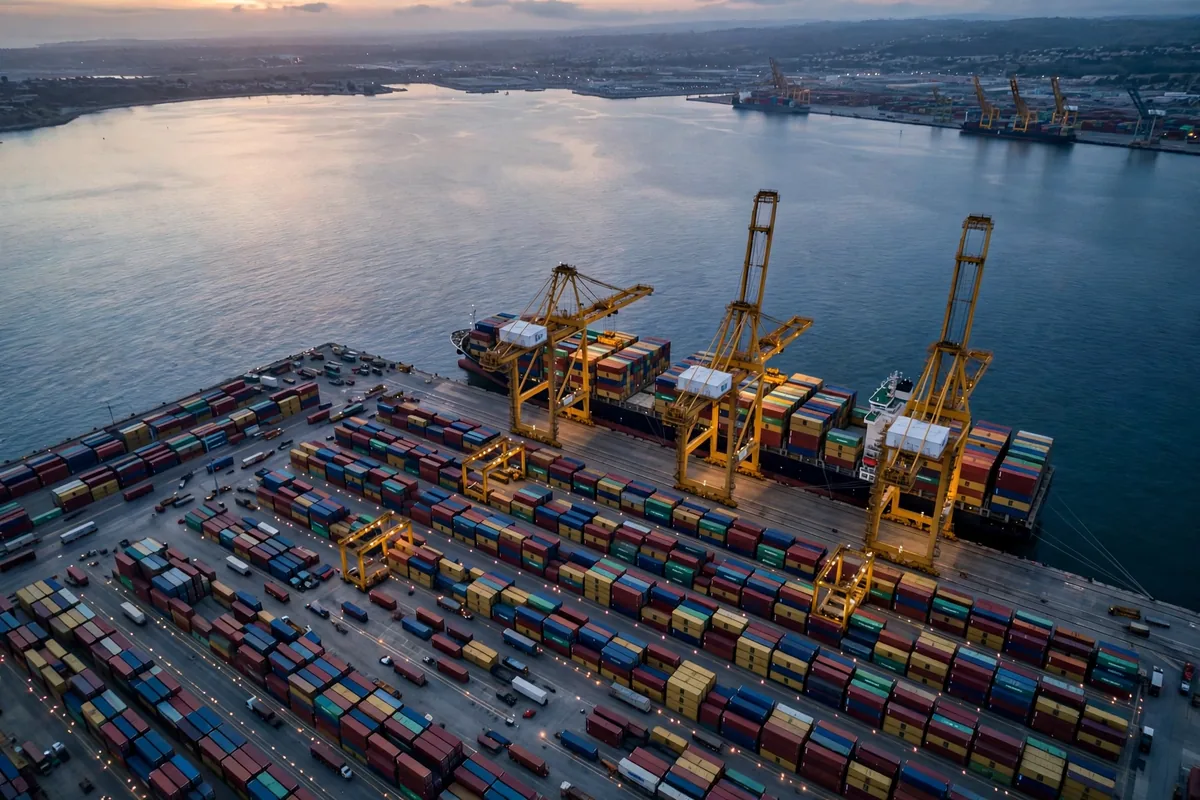
Tanjung Priok is operated by the state-owned port operator Pelindo, and its complex holds 20 terminals. The main container terminals are JICT, TPK Koja and NPCT1, the first phase of the New Priok expansion. NPCT1 began commercial operations in August 2016, with a design capacity of 1.5 million TEU a year, a 32-hectare yard, an 850-metre quay and a 16-metre draft, allowing it to receive large container vessels. Before it opened, the largest ships Tanjung Priok could handle were in the 3,500 to 4,000 TEU range. That single fact explains why NPCT1 mattered: it changed what kind of ship could call at Jakarta at all.
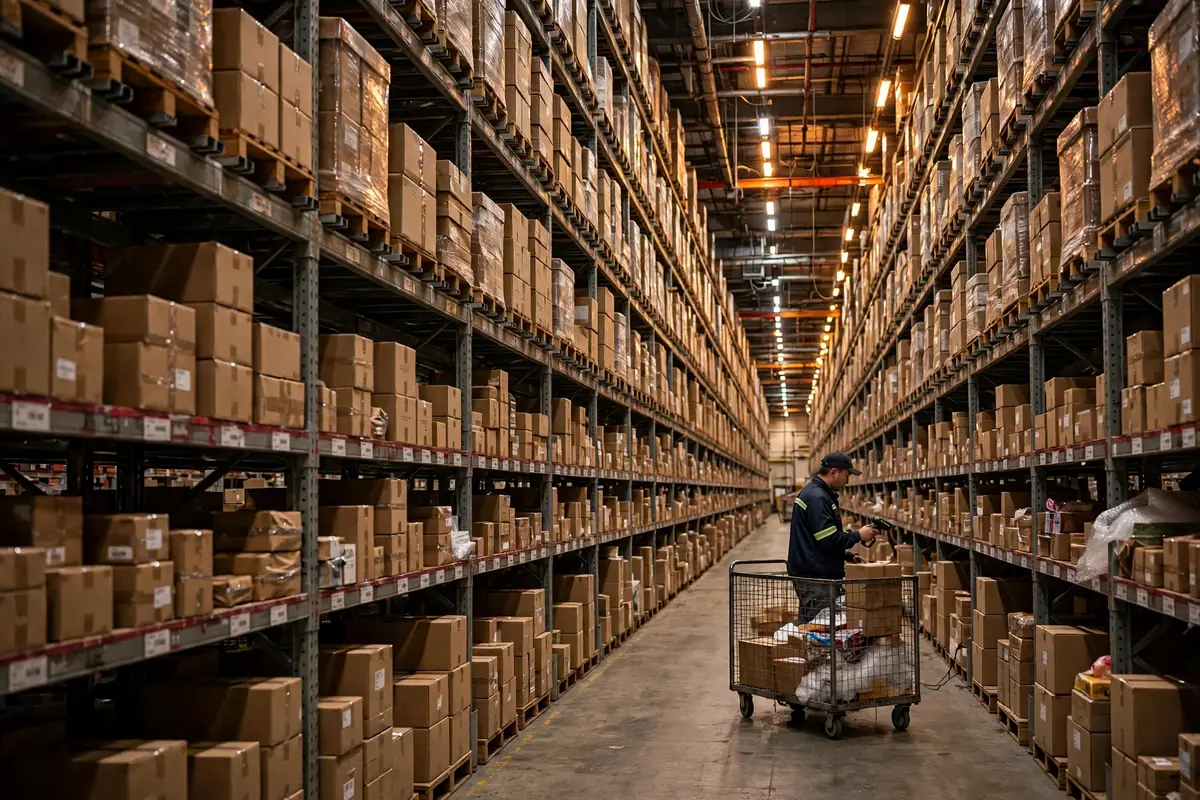
The structure of the port itself is not complicated. What is complicated is its relationship with the hinterland. Jakarta and Java are the cargo base, and the port, the yard, the warehouse and the access roads form one chain. When any link slows down, the delay shows up as boxes stacked in the yard. On 1 August 2026, Pelindo began trial operations at Terminal 2, the port's second container terminal, with the first berthing of the MV Meratus Konawe. Pelindo TPK, the Pelindo subsidiary operating the main container terminals, reported throughput of 6.63 million TEU in the first half of 2026, up 5.51 percent year on year. Volumes are still rising and terminals are still expanding. The question the numbers raise is not whether growth exists, but whether the landside can keep up with it.
Why Warehousing Never Seems to Be Enough: A Dwell Time Calculation
If you look only at terminal capacity, Tanjung Priok reads like a successful expansion story. If you look at how long a box sits in the port, the story changes. According to earlier World Bank research, the average dwell time for import containers at Tanjung Priok rose from 4.8 days in 2010 to 6.4 days in 2013. After NPCT1 opened, dwell time was at one point pushed back toward roughly three days. Put together, the two data points support the same conclusion: hardware can be solved with investment, but dwell time depends on customs clearance, pick-up scheduling, road capacity and warehousing working together. When any one of them slips, the time creeps back up.
For anyone running warehousing and distribution, dwell time is not an abstract indicator. It converts directly into cost. The table below is a scenario illustration for one 40-foot container, using assumed daily holding costs; actual rates should be confirmed against the latest terminal and carrier tariff tables.
| Dwell time | Assumed daily holding cost | Total per 40ft box | Note |
|---|---|---|---|
| 3 days | about USD 60 | about USD 180 | Close to the target level after NPCT1 opened |
| 6 days | about USD 90 | about USD 540 | Storage charges rise sharply once progressive rates apply |
| 10 days | about USD 140 | about USD 1,400 | Includes demurrage, rebooked pick-up and extra warehousing |
The point of the illustration is not any precise figure but a structural fact: dwell cost is non-linear, and three extra days is not the same kind of bill as seven extra days. Industry reporting from early November 2026 confirms the mechanism. Vessel bunching overwhelmed roads and depots that were already at full capacity, and the Jakarta to Shanghai rate for a 40-foot box rose 9 percent in a week, to USD 81. The ships arrived; the roads did not keep up; the price absorbed the congestion first.
The Fire of 21 September: More Than 51 Tank Containers
On the afternoon of 21 September 2026, a fire broke out in the dangerous goods zone at NPCT1, at Kade 820, DG Block. It was discovered by terminal staff at around 15:20 local time. According to post-incident statistics from the Indonesian police, 51 ISO tank containers and one ordinary dangerous goods container were completely destroyed. No casualties were reported, and the cause of the fire is subject to the final findings of the police investigation with the national police forensic laboratory. On 23 September, NPCT1 confirmed that overall terminal operations had entered a steady recovery phase, with conventional container business largely back to normal and the dangerous goods area restarting in an orderly way.
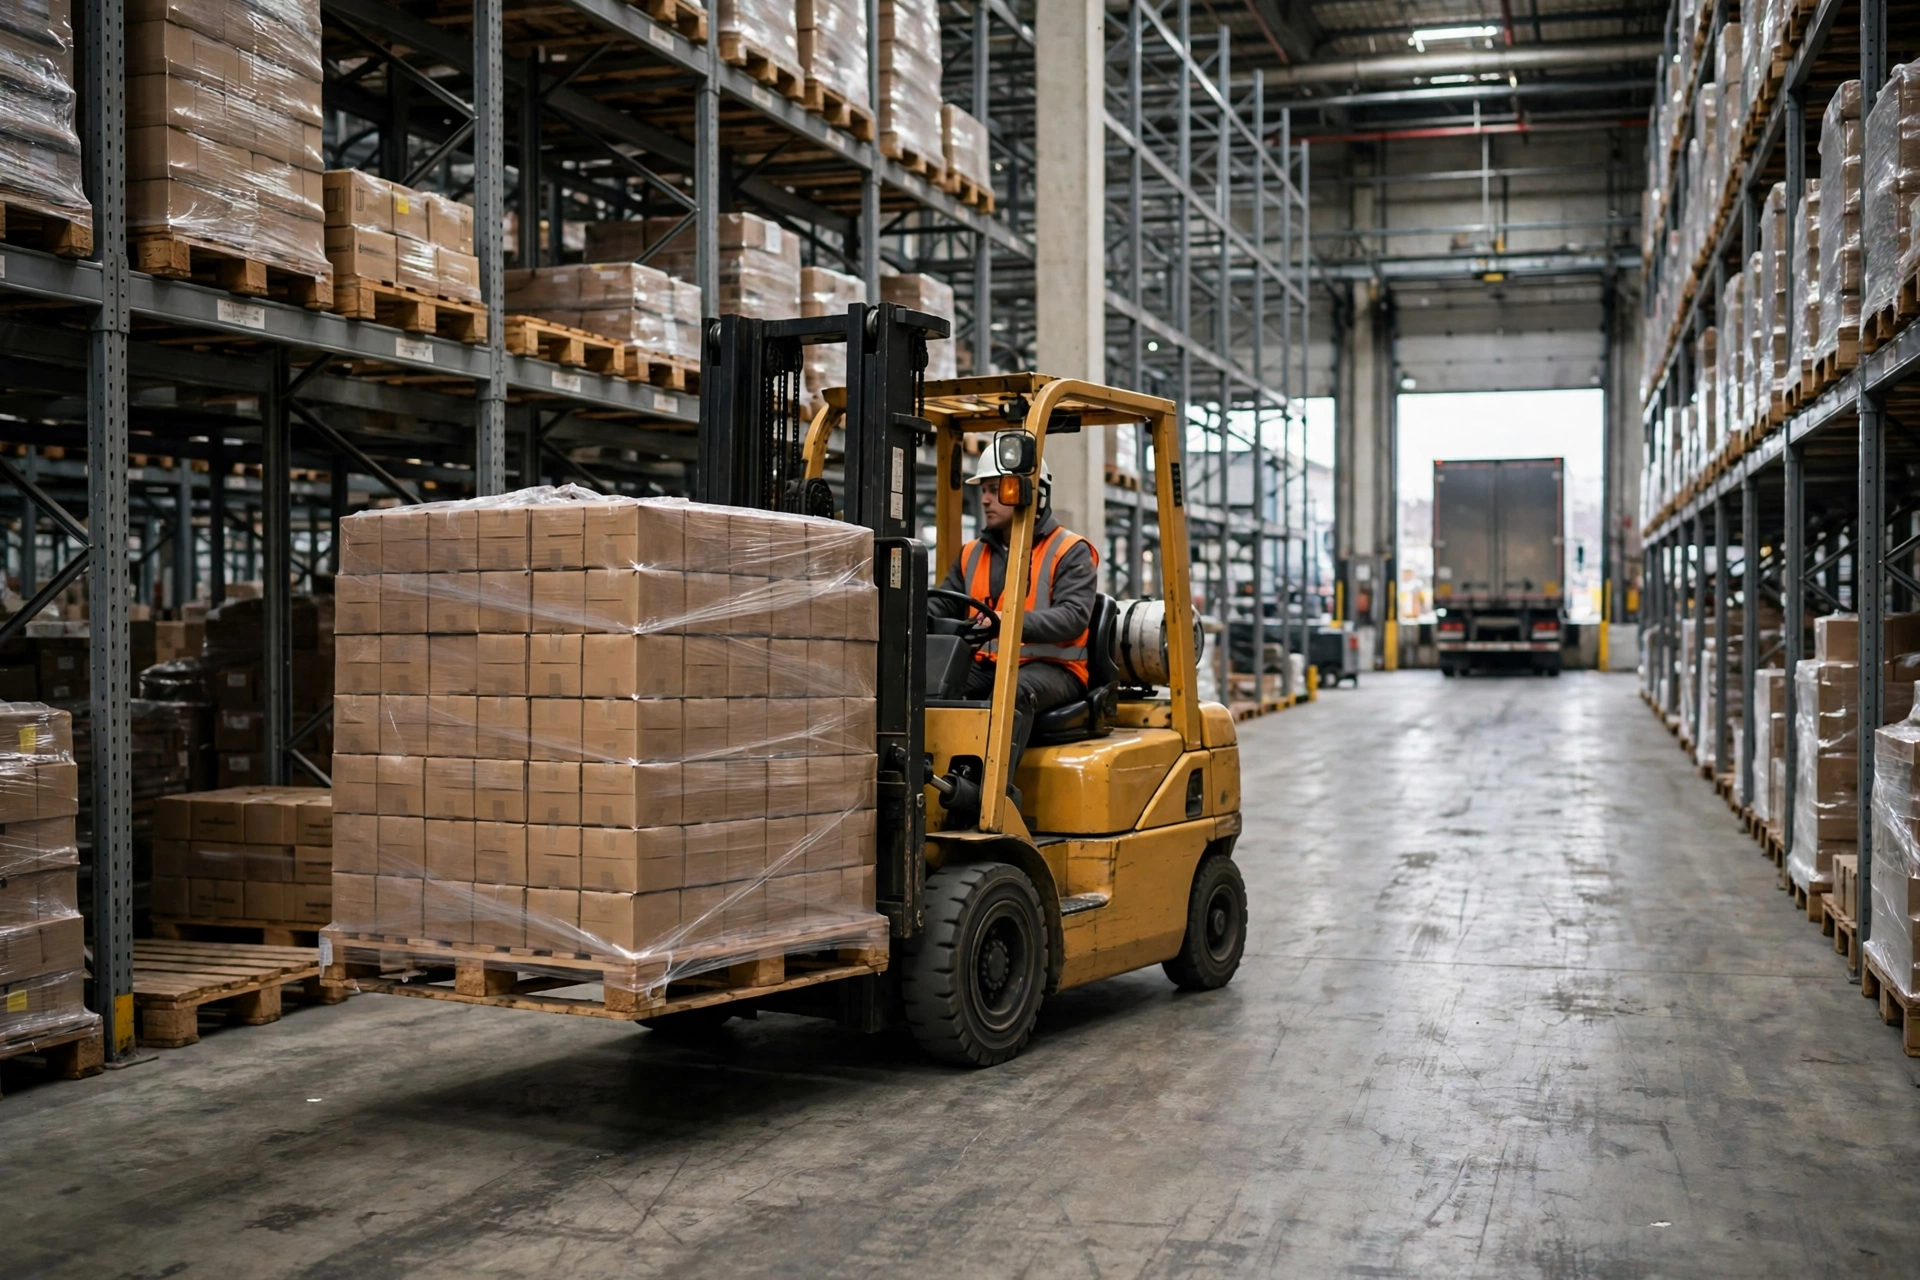
The fire belongs in a warehousing guide not because it was unusual, but because it exposes a counterintuitive judgement: the greatest risk at a port is often not at the quayside but in the yard. NPCT1 handled around 1.39 million TEU between January and November 2025, close to its 1.5 million TEU design capacity, with yard occupancy running at roughly 51 to 60 percent, and management prioritising scheduled window calls while scaling back ad hoc services. When a terminal operates that close to full capacity for that long, any localised interruption transmits quickly to the whole hinterland. A suspended dangerous goods zone means chemical and energy cargo must be rerouted, and rerouting means new pick-up plans, new yard slots and new costs.
For Chinese sellers and forwarders, the lessons are practical. First, dangerous goods and general cargo need separate contingency plans, not a shared pick-up timetable. Second, at a high-density terminal such as NPCT1, vessel schedules and pick-up windows should be booked around the terminal's preference for scheduled calls, not on a turn-up-and-see basis, especially in peak season. Third, insurance and contracts should spell out who bears the cost when a terminal suspends operations; the argument afterwards usually costs more than the extra days of storage.
18 Million TEU by 2030: Can Tanjung Priok's Expansion Keep Up With Demand?
Under the New Priok expansion plan, Tanjung Priok's total handling capacity is targeted to reach 18 million TEU by 2030, more than twice the 7.6 million TEU actually handled in 2024. The logic is clear: after NPCT1, further terminals NPCT2 and NPCT3 are planned, Terminal 2 has begun trial operations, and deeper drafts and a wider two-way sea lane are meant to turn Jakarta from a feeder port into a hub that can receive 18,000 TEU vessels directly.
But the data points to a trend worth watching more carefully: the bottleneck is moving from the waterside to the landside. Industry reporting in November 2026 noted that congestion at Tanjung Priok came from sudden, unscheduled multi-ship arrivals overwhelming bottlenecked roads and container depots already at full capacity, while construction of the New Priok Eastern Access road, meant to improve access, only started in July 2026 and will take 20 months to finish. One forwarder put it plainly: landside logistics had not caught up with improvements in terminal capacity, shipping lines were reluctant to absorb the cost of repositioning empty containers, and the local equipment shortage was pushing up the price of available boxes.
That leaves an open question. If the 18 million TEU target for 2030 is met on schedule, but customs efficiency, road capacity and warehouse layout remain at today's level, will warehousing and distribution in Jakarta become cheaper or more expensive? Between 7.6 million TEU in 2024 and 18 million TEU in 2030 lies more than two new terminals. It also contains three tests running at once: clearance speed, landside capacity and warehouse planning. For companies considering a warehouse in Indonesia, the answer is probably not in the port's master plan. It will be in the next peak season, and in the next unexpected disruption.
By Dr. Chen, Supply Chain Researcher