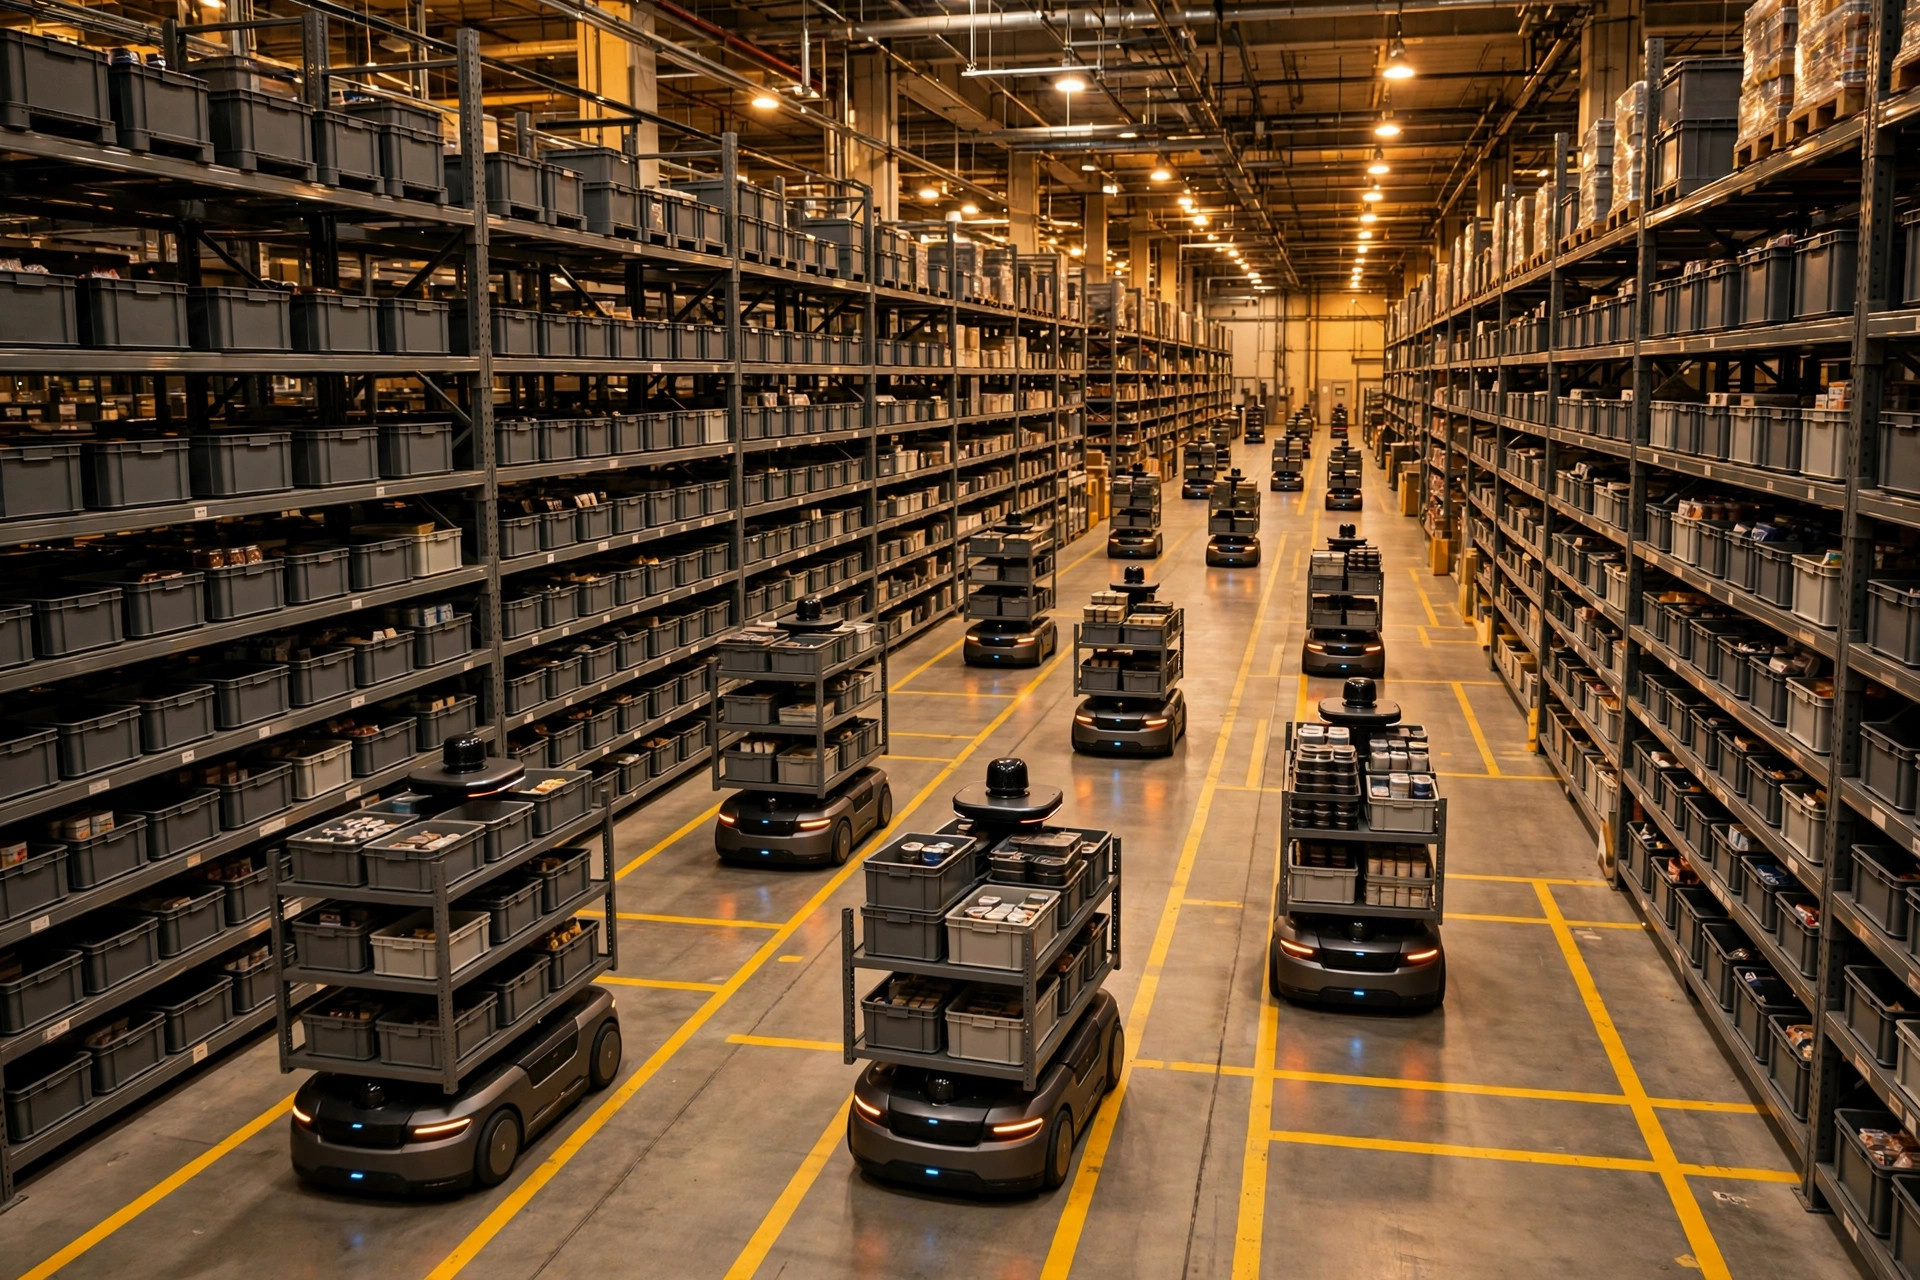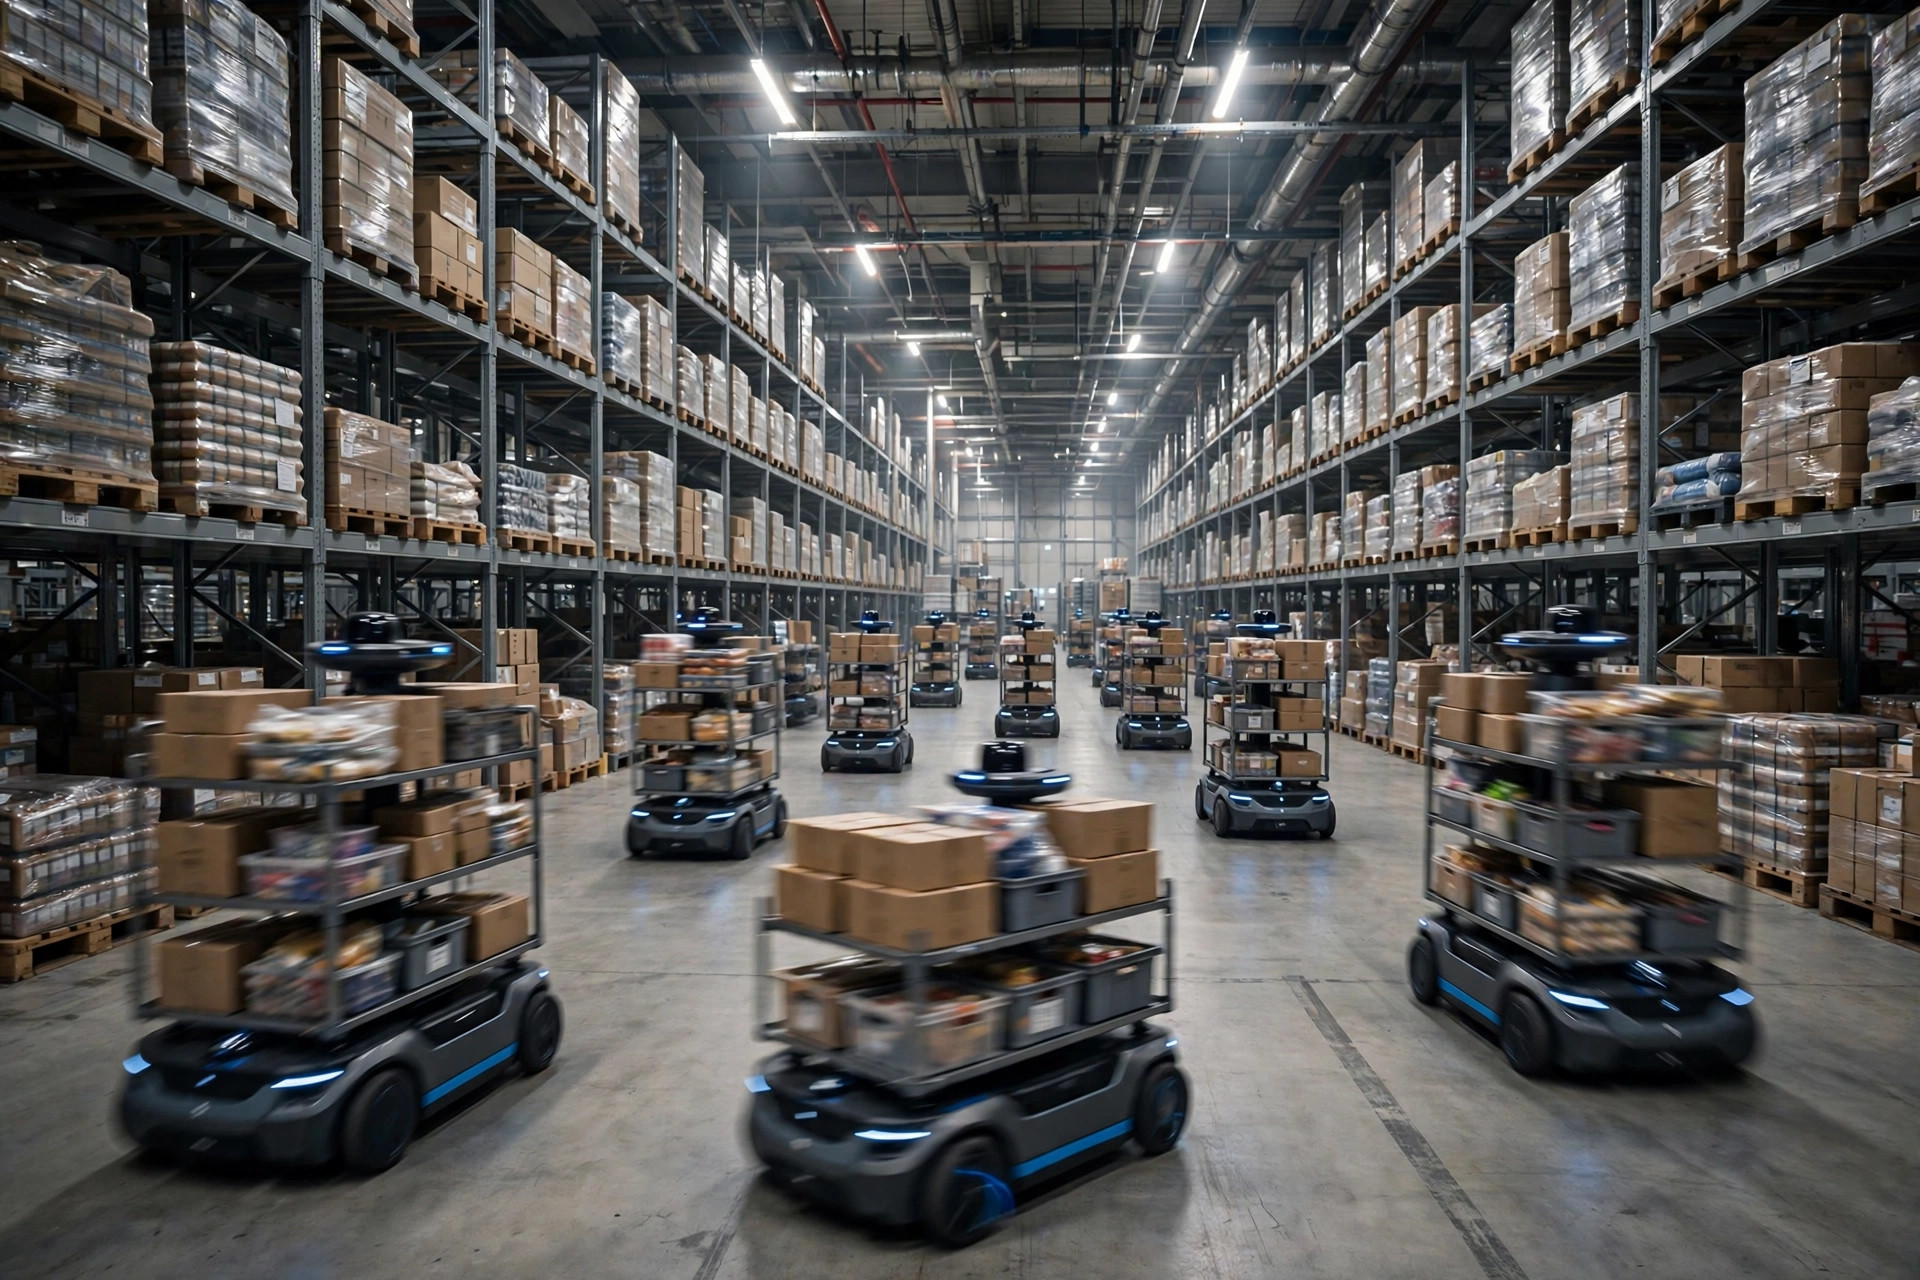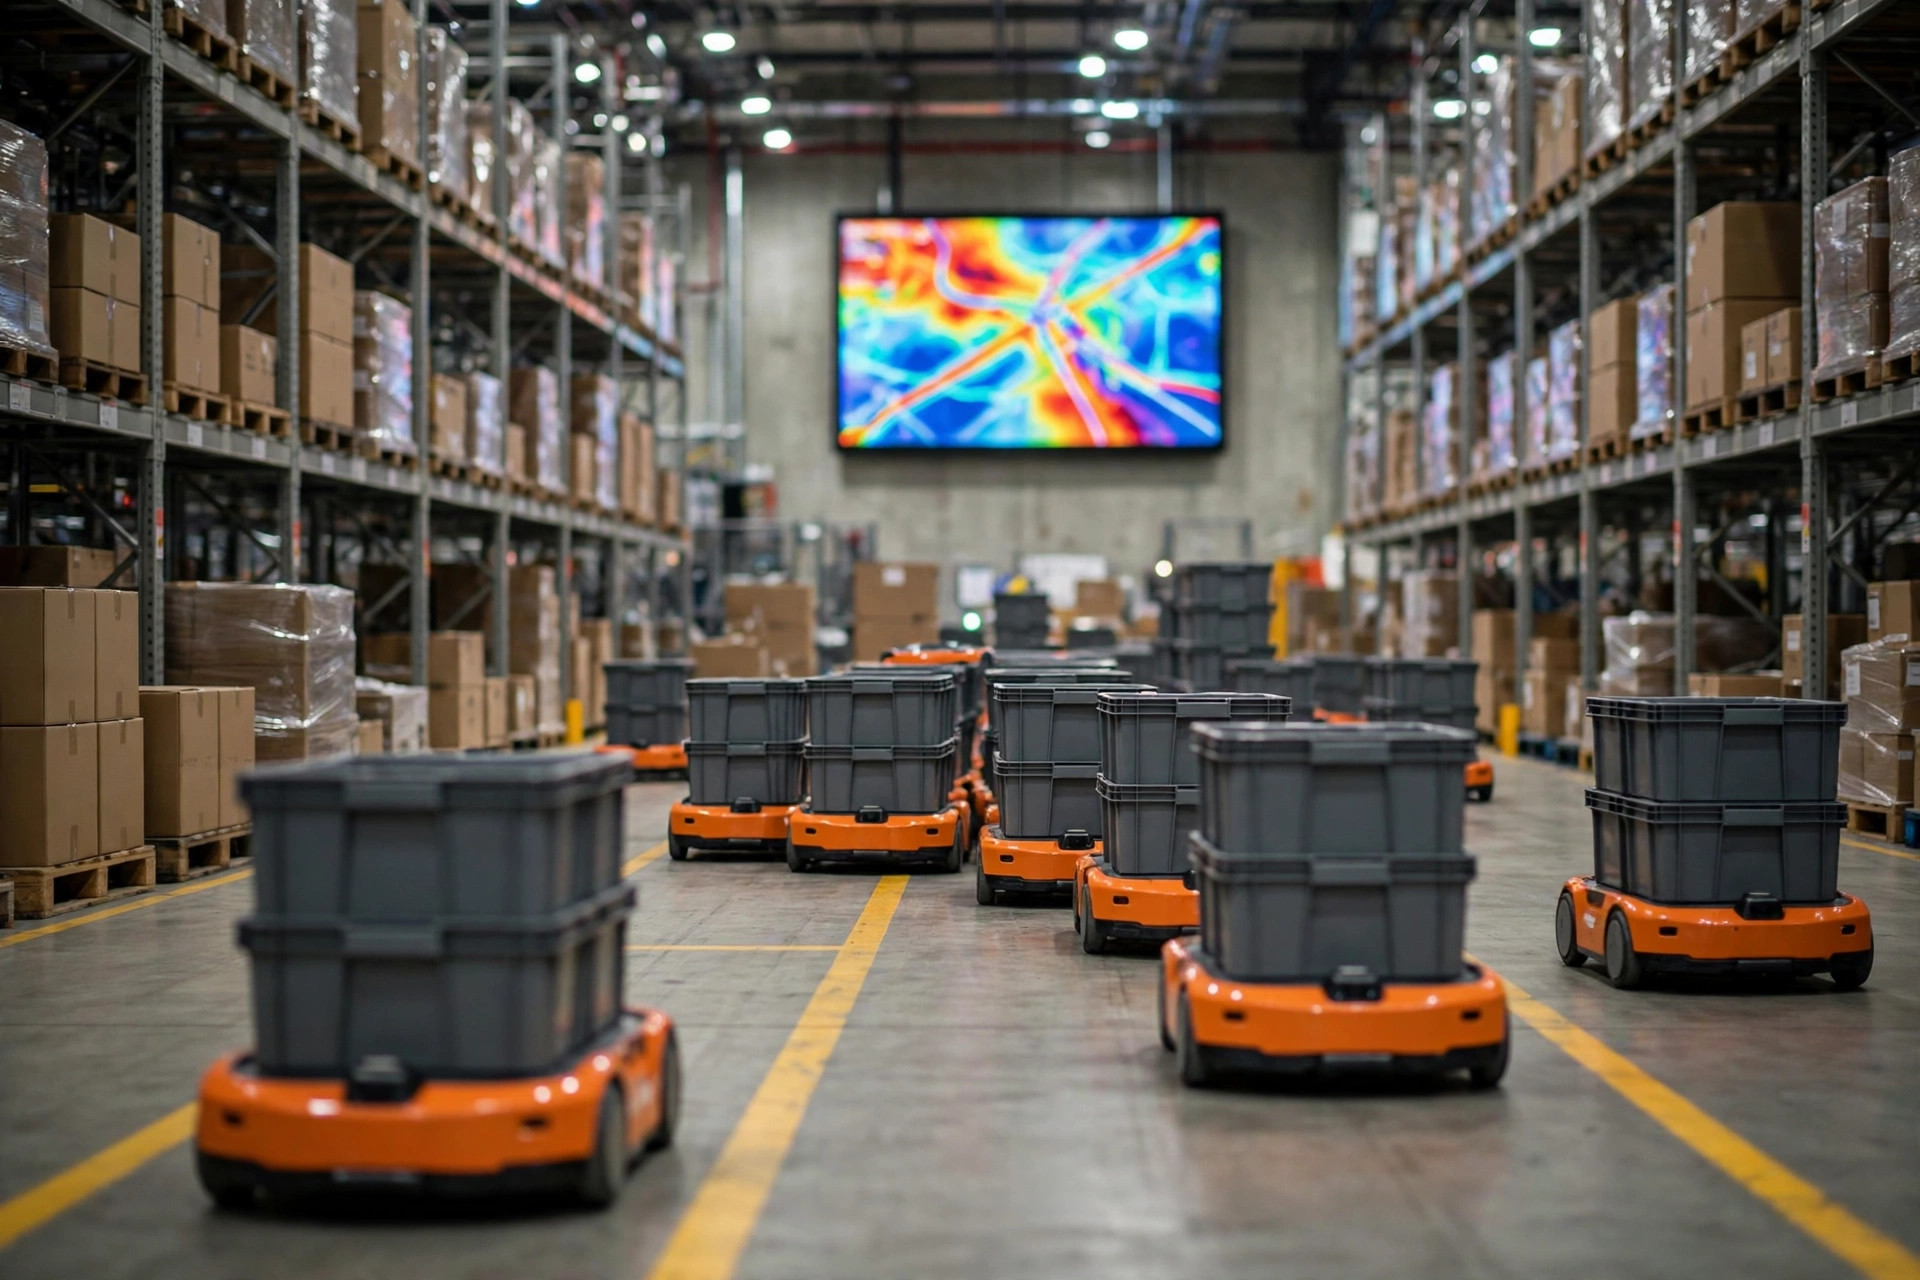
Bottom line first: when your fleet slows down, the robots are almost never the problem — the roads are. Run one round of RCS task log replay congestion analysis on a week of historical task logs, replay it, and the bottlenecks show themselves. In my projects, more than nine out of ten "it's getting slower" cases had their root cause sitting right there in the logs. It beats buying more robots on gut feeling, and it costs a fraction of the money.
Why fleets slow down: it's not the robots, it's the logic
An AMR fleet is a dynamic system — every robot affects every other robot. One robot waits 30 extra seconds, the ones behind it queue up, and the queue feeds back into the dispatcher. On the floor all you see is "everything is slow." In a log replay you see exactly which road segment, at which timestamp, which robots blocked each other. Timestamps don't argue.
Congestion comes in three flavors, each with a different root cause:
- Charging congestion: robots with low batteries swarm the charging area and block the main aisle. This is the most common kind — roughly four out of ten cases I've seen.
- Intersection congestion: narrow aisles and crossings where two-way traffic forces constant yielding, sometimes full deadlocks. The more robots, the worse it gets.
- Dispatch congestion: the scheduling policy dumps tasks on the nearest few robots — a handful run themselves ragged while the rest sit idle. In the logs this shows up as huge variance in task completion times.
September 2024, a 3PL e-commerce warehouse in East China, about 15,000 square meters, apparel and small appliances. The fleet grew from 36 to 54 robots, and average pick-task completion time went from 11 minutes up to 16. The client was convinced the robots were bad and nearly ordered 20 more. I told them to hold on and replay a week of RCS task logs first. The answer was obvious: every day from 2 to 5 in the afternoon, a dozen robots queued at the charging area entrance — every robot under the battery threshold rushed to charge at once and sealed off the main aisle. The fix was simple: lower the charging threshold from 25% to 15% and split charging into two staggered windows. The next day, average task time was back around 11 minutes. Not one robot added. I've seen this pitfall three times — charging policy is always suspect number one. When investigating congestion, check charging first. That's my fixed routine.
RCS task log replay congestion analysis in five steps
Don't buy visualization software first. Walk these five steps properly:
- Pull the logs. Get the log export interface from your RCS vendor. Pull at least 7 consecutive days, and make sure a peak day is included. The required fields are non-negotiable: task ID, vehicle ID, task created/started/finished timestamps, waypoint timestamps for each path segment, wait events (wait/yield/deadlock), and charging events. Logs with missing fields produce wrong replays — get the vendor to complete the fields before moving on.
- Clean the data. Sync the clocks first. Clock drift between the RCS server and the robots is the norm — align with NTP before analyzing, or your "congestion" will be fiction. Then strip out test and maintenance robots. I've seen this pitfall three times: someone left a maintenance robot in the dataset, a "ghost congestion hotspot" appeared on the heatmap, and the whole team spent an afternoon arguing over fake data. Finally, drop abnormally short tasks, like 10-second test runs.
- Replay. Replay the timeline using the waypoint timestamps. Most RCS platforms ship a replay tool; if yours doesn't, build one with open-source visualization. Look at three metrics first: the trend of average single-task duration (is it climbing week over week?), the wait-event density heatmap (where are the jam points?), and deadlock/yield event frequency (how bad is it?).
- Locate. Mark the high-wait-density segments, then cross-verify: is this stretch physically too narrow, or is it a task-flow design problem? Segments piled around charging areas and load/unload stations are usually the latter. When locating, always walk the floor once — the logs tell you where it's jammed, the floor tells you why.
- Verify the fix. After tuning the policy, replay another week of logs and compare before and after with real data. An "optimization" without comparison data is no optimization at all. This step gets skipped the most, and it matters the most.
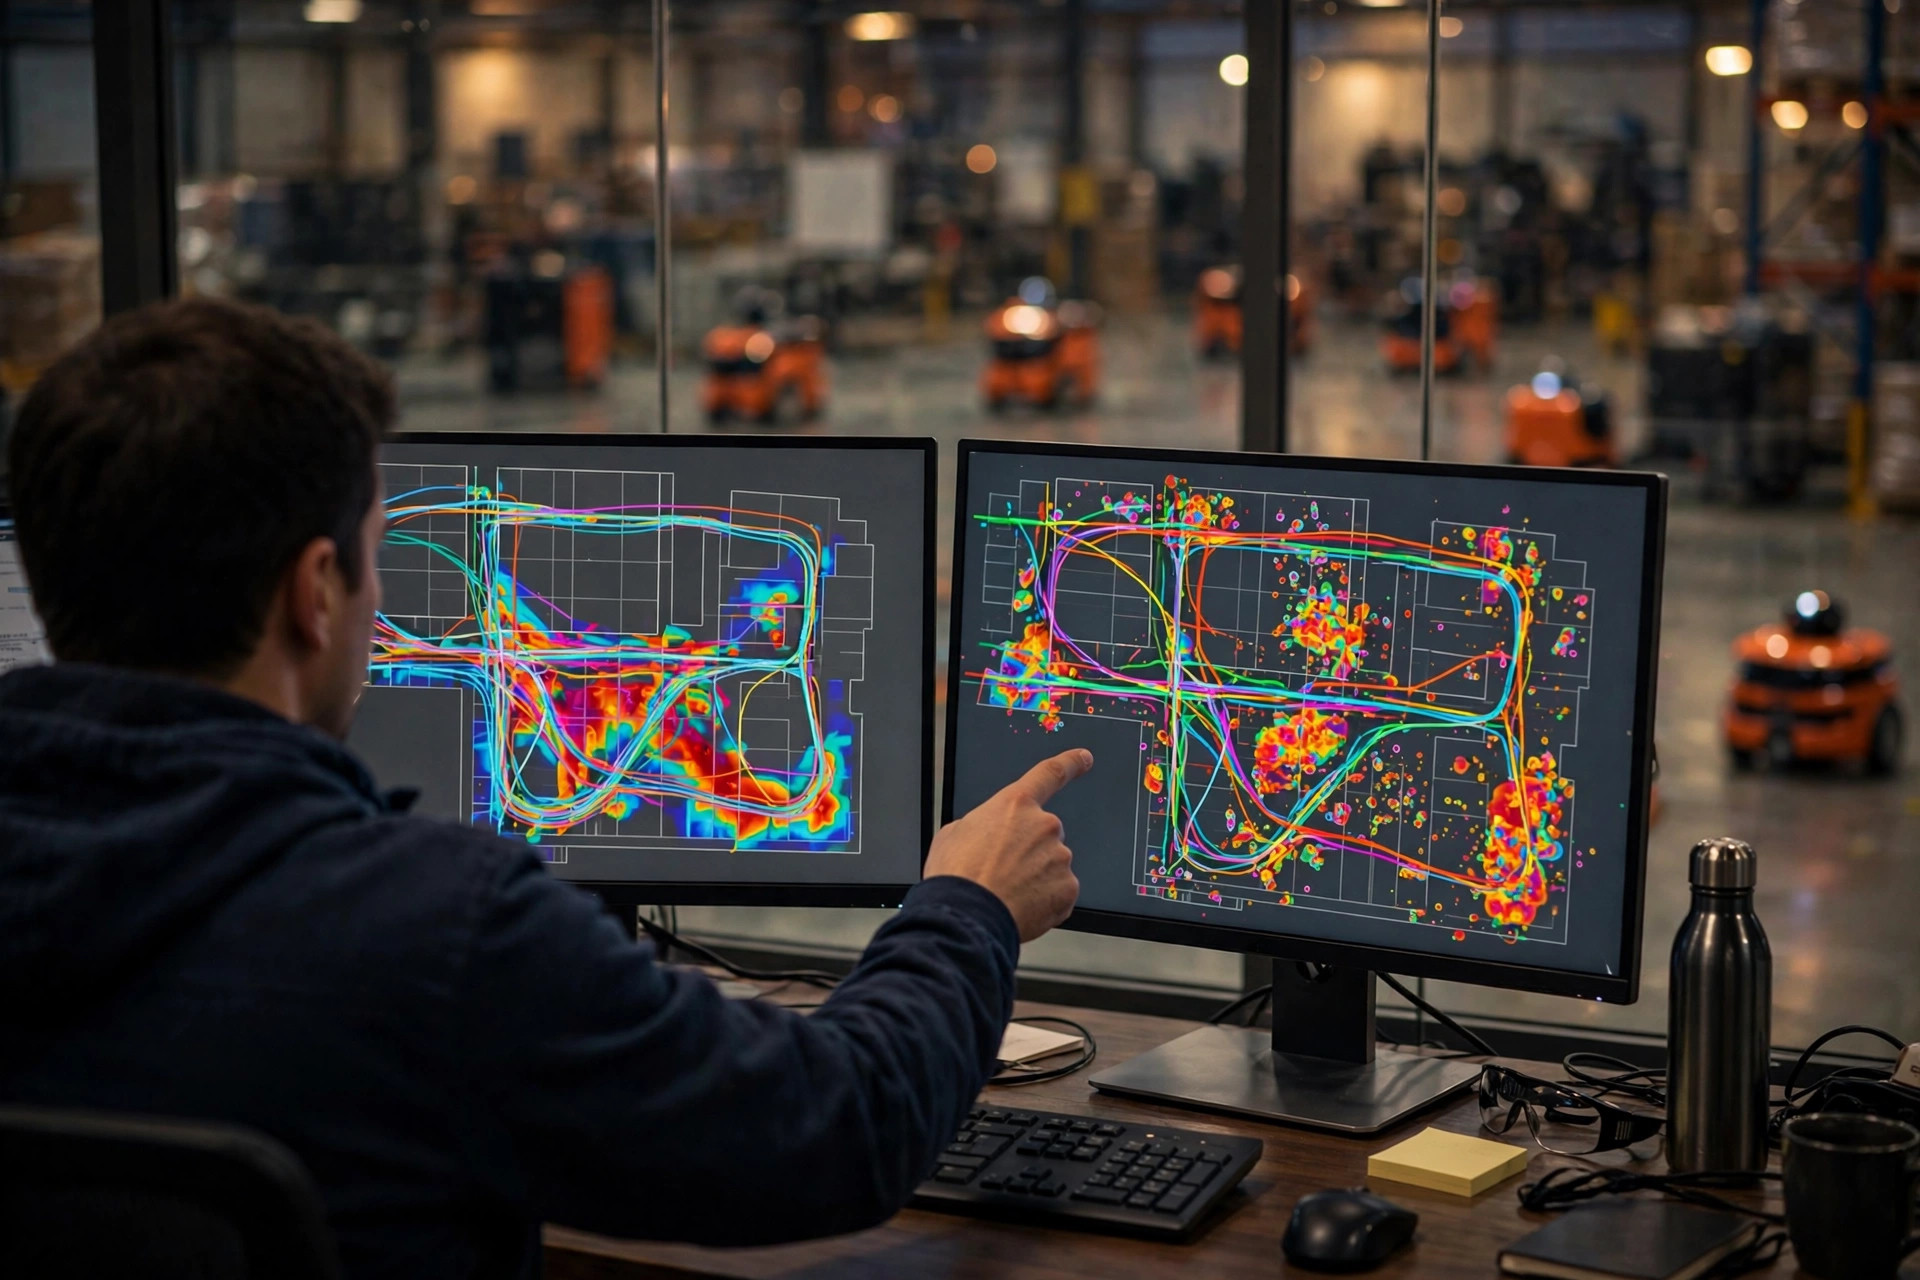
Early 2025, an auto-parts warehouse in South China. A 2.8-meter-wide narrow aisle, two-way AMR traffic yielding constantly, five robots squeezed into one aisle at peak, each waiting on the others, nobody moving. The replay showed yield events eating more than twenty percent of total task time. Worse, occasional deadlocks needed a human to walk over and move a robot — one deadlock dragged the whole line down for nearly half an hour. The counterintuitive fix: convert the aisle to a one-way loop and route the other direction around it — about 60 extra meters of travel, yet task time dropped nearly twenty percent and deadlocks went to zero. Longer route, faster delivery — because waiting costs far more than detouring. Many people can't make this mental flip: shortest path does not mean shortest time. Dispatch optimization is about total system time, not single-robot mileage.
I've seen this pitfall three times: four ways replay analysis goes wrong
- Analyzing before syncing clocks. Server and robots off by seconds, and every "jam" in the replay is fake. NTP alignment first — iron rule, step one of every engagement.
- Leaving test robots in. The maintenance area gate is always the "most congested" spot — pure noise. Build a vehicle whitelist during cleaning; production robots only.
- Looking at one day only. You see neither peak nor valley. Minimum seven days, peak day mandatory. Weekday and weekend task patterns are completely different animals — one day is feeling the elephant's leg.
- Analyzing without acting. A report that goes into a drawer is work wasted. I've seen this pitfall three times — projects that analyzed but never changed policy all ended up back where they started. My rule: the last page of the analysis report must be an action list with owners and dates, or the engagement isn't done.
One more counterintuitive call, worth its own paragraph: more robots does not mean faster. Every robot you add raises the conflict probability between robots, and past some tipping point, adding robots just adds traffic. I ran the numbers once: one AMR's fully loaded annual cost is not small — 20 more robots is serious money, while a round of congestion analysis plus policy tuning costs a fraction of that and often works better. In my experience, roughly eight out of ten slowdown cases get solved with dispatch and layout adjustments alone. No new robots needed. The decision framework is simple — match the symptom before you act:
| Symptom | Evidence in the logs | Right move | Never do this |
|---|---|---|---|
| Everything slowing | Avg task time climbing week over week | Check charging and dispatch policy | Just add robots |
| Local jam | Wait events concentrated on one segment | One-way conversion or flow split | Expensive widening (slow and costly) |
| Peak-hour collapse | Deadlock events spiking at peak | Staggered charging plus task shaping | Blunt task throttling |
| Uneven workload | Huge variance in task times | Retune dispatch weights and zone splits | Buy fancier robots |
Go-live night checklist: run these five before the next slowdown
Next time the fleet slows down, don't rush to place a robot order. Run one round of log replay, then walk this checklist before touching anything:
- Seven full days of logs pulled — peak day included?
- Clocks synced? Test and maintenance robots stripped out?
- Wait heatmap drawn? Top three jam points marked?
- For each jam point — physical cause or policy cause, distinguished? Floor walked?
- Does the fix have before-and-after comparison data? Owners and dates set?
Only act when all five check out. I've seen this pitfall three times, and every single one skipped the checklist. Logs don't lie — gut-feel decisions do. Make RCS task log replay congestion analysis a fixed routine, and your fleet gets faster over time instead of slower.
By Lin Xiao, WMS Implementation Consultant