Let's start with the math — put wall sortation is a math problem, not an equipment problem.
Take an ecommerce warehouse doing 5,000 orders a day, 1.8 units per order — 9,000 units to sort daily. Pure manual pick-and-check: a skilled worker handles 120–150 units an hour (typical industry range, varies by site). Over an 8-hour shift that's 1,000–1,200 units. 9,000 ÷ 1,100 ≈ 8 people, just for sortation. At a fully-loaded cost of $1,100 per worker per month (sample assumption — plug in your local number), that's $8,800 a month, $105,600 a year.
That's the question a put wall has to answer: can that $105,600 be spent better?
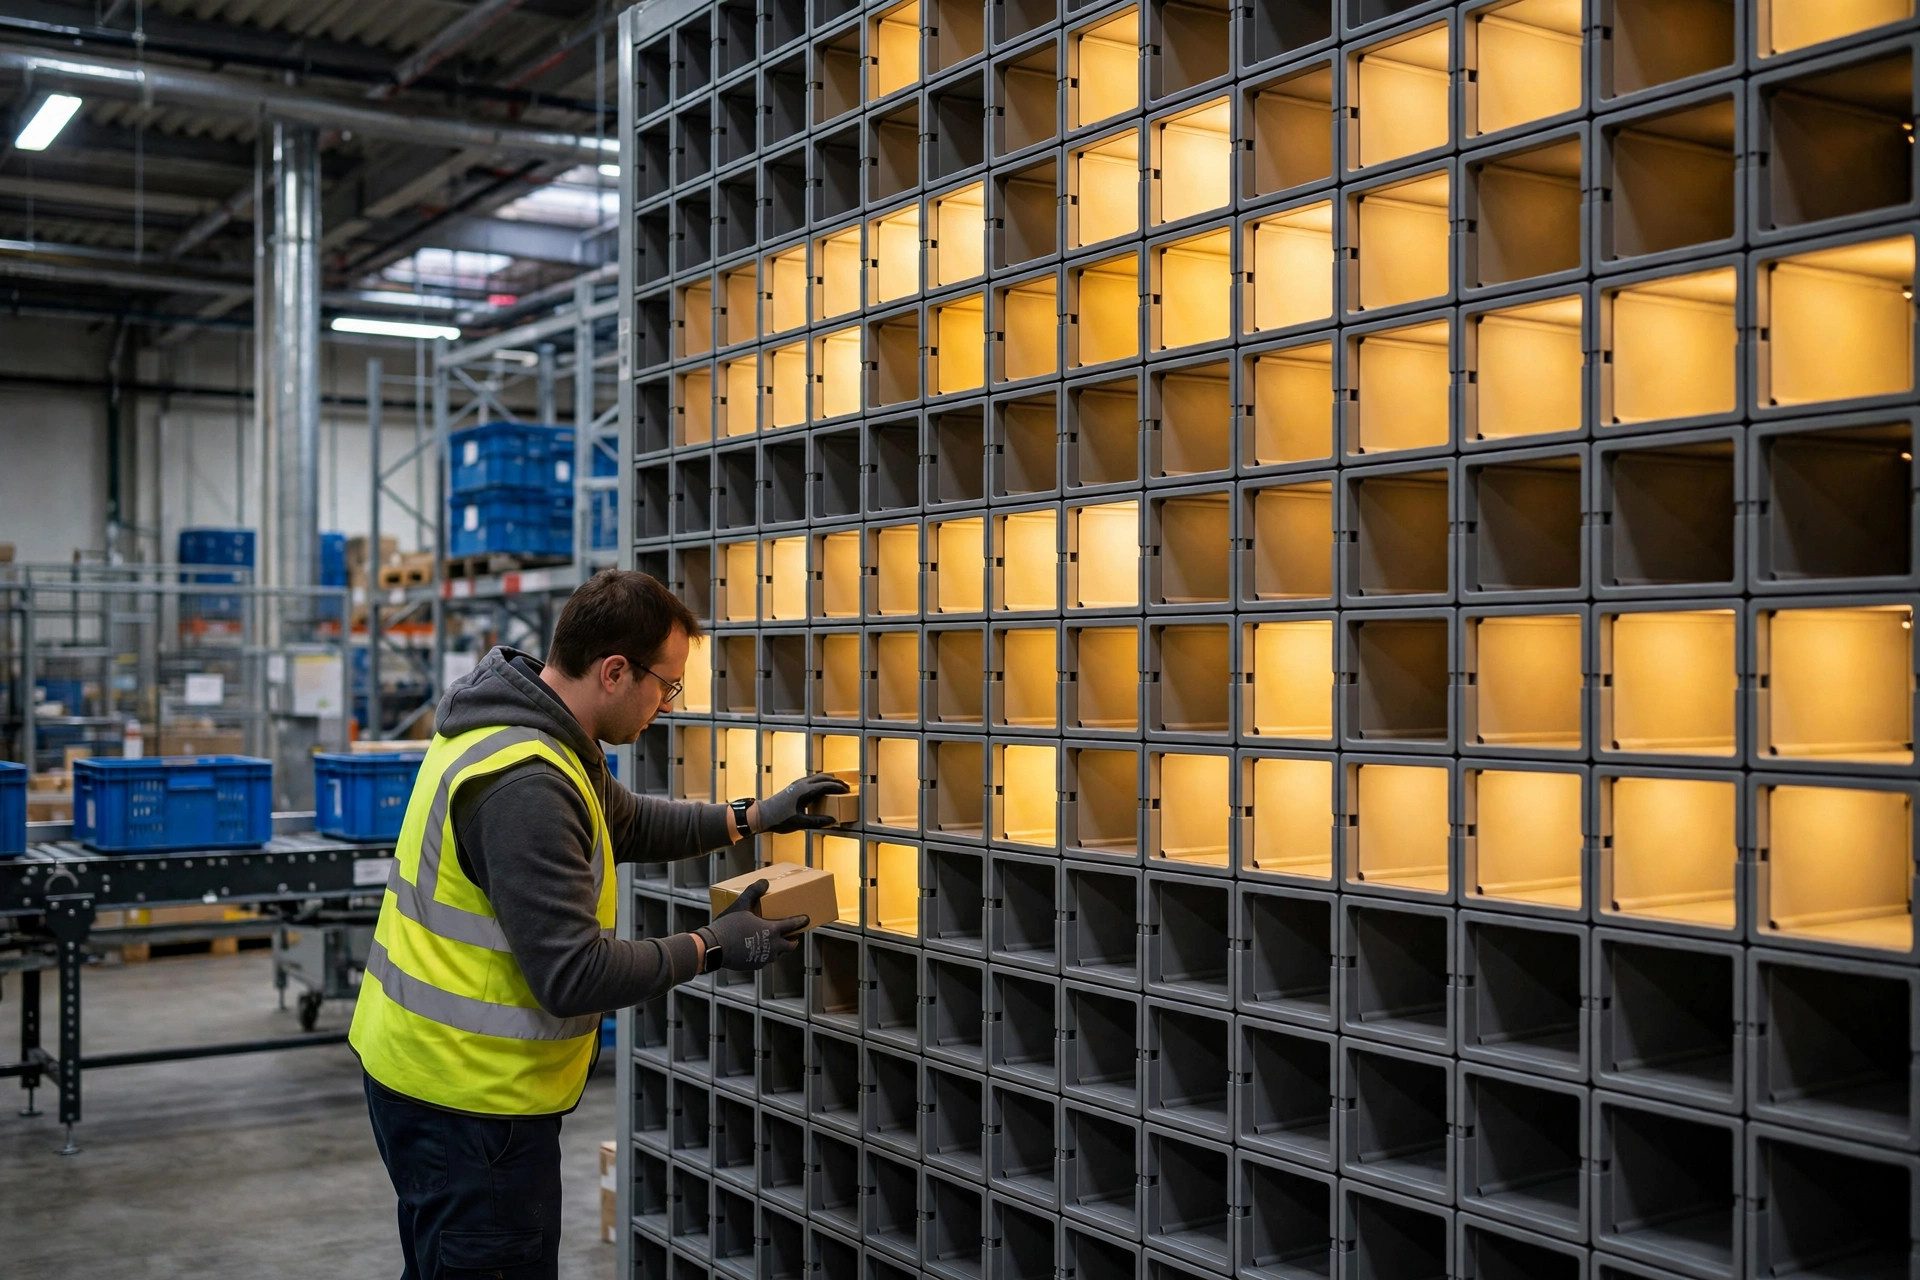
I'm a finance guy. I don't do equipment specs. I do ledgers. A put wall is explainable in one sentence: batch-pick a wave of orders together, then instead of packing directly, distribute units into cubbies on a wall — one order per cubby. Put-to-light means each cubby has a light: light on, drop the unit in; light off, that order is complete. Batch picking kills travel time; the put wall kills mis-sorts.
Three Put Wall Options, TCO on the Table
Sortation comes in three tiers by automation level. I'll only use efficiency figures that were independently verified; integrator quotes vary too much to cite, so this comparison is labor-cost only:
| Option | Verified throughput | Labor for 9,000 units/day | Accuracy |
|---|---|---|---|
| Pure manual pick | 120–150 units/hour | ~8 people | Depends on management, varies widely |
| Manual put wall (put-to-light) | 400–500 puts/hour | ~3 people (incl. batch picking) | 99% |
| Automated put wall | 2,400 units/hour, 2–3 people total | 2–3 people (incl. infeed/outfeed) | 99%+ |
Look at the middle row: a put-to-light wall runs at 3x-plus the speed of manual picking, at 99% accuracy. The "30–50% efficiency gain" figure you see in brochures is the conservative version — measured against the sort step's original baseline, not the whole warehouse. People mix those two numbers up, present them to the boss, and get sent back to redo the math.
In 2023 I worked on a case with an apparel ecommerce warehouse in eastern China: 4,000–6,000 orders a day, 8,000+ SKUs — classic "many SKUs, small quantities." They installed four put-to-light walls, 96 cubbies each. Before: 11 people on sort-and-check. After: 4 on batch picking + 3 on the walls — 7 total. Four heads saved, roughly $52,800 a year at their labor cost. Equipment plus implementation ran about $85,000. Payback in about a year and a half. The owner called it "worth it" — note the phrasing: worth it, not a windfall. That's the ceiling of a manual put wall. It saves labor. It is not a revolution.
Automated put walls are a different animal. In 2024, a 3C accessories warehouse in southern China doing a steady 20,000+ orders a day installed an automated sortation line: 2,400 units an hour, 2–3 people for the whole line. The same throughput previously needed 30+ sorters. Labor savings north of $300,000 a year, payback under twelve months. But note the precondition: 20,000+ orders a day, and stable.
The Counterintuitive Part: Volatile Volumes Can Make Automation Lose Money
This is where most people get the math wrong.
Automation has high fixed cost and low variable cost. A line rated at 2,400 units an hour costs the same in depreciation whether you run it 4 hours a day or 16. Why did that southern China warehouse win? Because it ran 20 hours a day — capacity utilization maxed out.
Flip it: a warehouse doing 3,000 orders a day that spikes to 20,000 during promotions. An automated put wall there is a disaster. Idle depreciation most days, then during peaks the 2,400-units/hour capacity isn't enough anyway — you're staffing manual overflow on top. Paying twice. A put-to-light manual wall with flex temp labor for peaks beats it cleanly. Manual labor has the opposite cost structure: low fixed cost, scales with volume.
So the put wall decision framework is three lines:
- Under 3,000 orders/day: don't touch put walls. Do ABC classification, slotting optimization, and batch picking first — zero-cost improvements worth 20% on their own. Put walls only make sense after batch picking exists.
- 3,000–15,000 orders/day, relatively stable: manual put walls (put-to-light) are the sweet spot. Controllable investment, 1–2 year payback, flex headcount up or down with volume swings.
- Above 15,000 orders/day and stable: run the numbers on automated put walls. Note the "and stable." Volatile sites should look at pouch sorters — or just bigger manual walls with promo-season temp labor.
The Put Wall Breakeven Point: A Formula You Can Plug Into
Closing with something usable. Define:
- D = average daily orders
- n = units per order
- C = fully-loaded monthly cost per worker
- Manual: 1,100 units/worker/day; put-to-light: 3,000 units/worker/day (including batch-pick share)
- I = total put wall investment, depreciated over 5 years → monthly depreciation = I/60
Monthly labor (manual) = D × n / 1100 × C Monthly labor (put wall) = D × n / 3000 × C + I/60
Set equal, solve for D:
D = (I/60) ÷ [ n × C × (1/1100 − 1/3000) ]
Plug in a sample: n = 1.8, C = $1,100, I = $85,000. Denominator = 1.8 × 1100 × (0.000909 − 0.000333) ≈ 1.14. Numerator = 1,417. D ≈ 1,240 orders/day.
Under those assumptions, a manual put wall beats pure manual above roughly 1,240 stable orders a day. Your C differs, your integrator's I differs — plug in your own numbers, five minutes, done. Anyone who tells you "put walls are always worth it" or "small warehouses should never touch put walls" without showing a formula is selling vibes, not analysis. Worth-it is computed, not felt.
One last note from the finance side: put walls save labor in the sort step, and sorting is typically 15–25% of total fulfillment cost. The big money is in inbound freight, storage, and last-mile. Don't expect one put wall to flip your P&L — it's a single-step optimization. Get the math right and it's a good investment. Get it wrong and it's the most expensive decoration in your warehouse.
By Lao Zhou, Logistics Cost Analyst