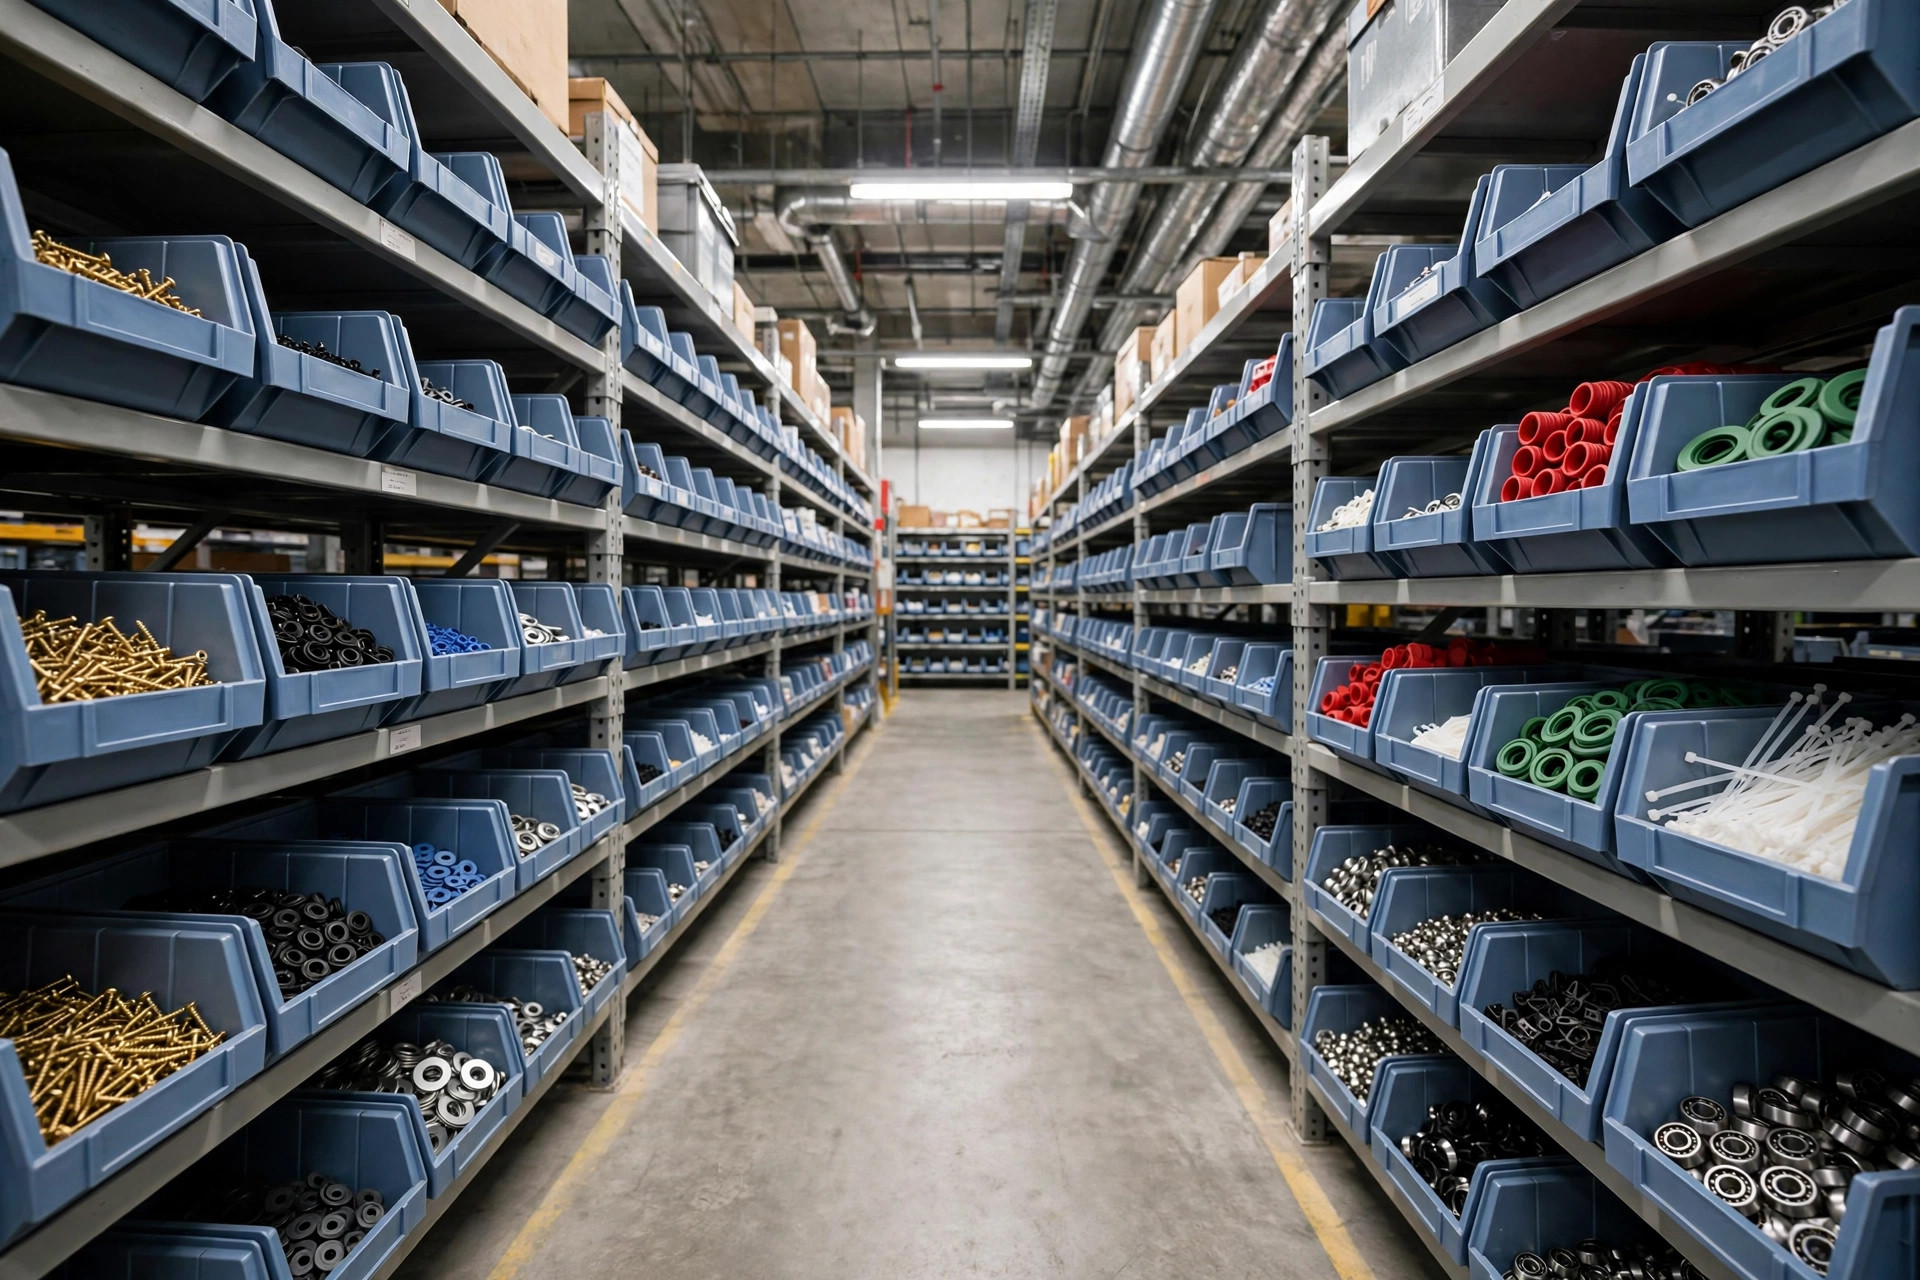
In March 2025, a Shenzhen-based outdoor brand launched a new camping lantern for the export market. Forecast: 800 orders in week one. The warehouse assigned it 8 golden-zone pick faces. Then an influencer's unboxing video went viral, and week one closed at 3,800 orders. All 8 slots were empty by the second afternoon. Replenishment carts were fighting pickers for aisle space, and average pick time per order fell from 40 seconds to two and a half minutes. Returns didn't spike — one-star reviews did, all saying "shipping too slow."
I've torn this case apart since. The miss wasn't the forecast being off by 4x — new-product forecasts miss by 2–3x all the time, that's normal. The failure was that slotting never followed the forecast at all. The first batch of slots was assigned by gut feel: no buffer, no trigger lines, and when it blew up, slots got shuffled around in a panic. Think of it this way: it's like pairing a motor of unknown load with a fixed-output drive. Sooner or later, something burns.
Slotting a new SKU is, to an automation engineer, an input-output problem. The input is the first-order forecast. The output is slot count and slot location. In between sits an allocation algorithm. Let's take it apart.
First-Order Forecast: The Three Input Signals for New-SKU Slotting
Don't trust the sales rep who swears "this one's going to explode." A first-order forecast has exactly three trustworthy inputs, and if any one is missing, treat the output as a rough reference:
First, historical category velocity. What was the week-one sell-through of your existing SKUs in the same category? That number doesn't lie. For this brand's lantern category, legacy products sold through 12–18% of their initial inbound in week one. Slotting a new SKU against that range beats the sales team's gut by an order of magnitude. It's like commissioning a new production line — you look at OEE of the existing line of the same type before you set targets.
Second, the product's own early curve. Sample-period, crowdfunding, and pre-sale conversion data, plotted as a daily sales curve for the first 7 days. New-product sales are never flat. The classic curve spikes on days 1–2, cools on days 3–5, and lifts again on days 6–7 depending on marketing pushes. Slotting has to eat the peak days, not the 7-day average — slot to the average and the peak will blow up on you.
Third, the marketing calendar. Influencer post dates, promo events, ad-spend ramp, down to the day. This input carries the most weight of the three, and it's the one warehouses ignore most often. In the lantern case, the warehouse never knew when the influencer video was going live. A forecast model without the marketing calendar is slotting with your eyes closed.
With all three inputs, you output two numbers: total week-one forecast W, and day-one peak P. Estimating P? Multiply daily average by a peak factor — for consumer electronics and home goods I use 1.6 to 2.0, and 1.8 is a safe starting point.
How to Slot New Products: Golden-Zone Reserves and Safety Buffers
Principles are in. Now the algorithm. Two steps:
Step one: how many golden-zone pick faces. Simple formula:
Golden faces = day-one peak picks ÷ per-face daily pick capacity × safety buffer
Per-face daily capacity depends on your pick method: manual picking typically sustains 80–120 orders per face per day; carton-flow racks or flow-through shelving run higher. For the safety buffer I recommend 1.5 — 1.2 is gambling on a new SKU's uncertainty, 2.0 is waste. 1.5 is the engineering sweet spot.
Step two: the reserve ratio. Golden zone is scarce real estate; you can't hand it all to every new arrival. I tier new SKUs into four grades:
| Tier | Week-one forecast | Golden-zone reserve | Safety buffer | Review cadence |
|---|---|---|---|---|
| S | 3,000+ orders | 1.5× day-one peak faces | 1.5 | Daily |
| A | 1,000–3,000 | 1.2× day-one peak faces | 1.3 | Every 2 days |
| B | 300–1,000 | 1.0× day-one peak faces | 1.2 | Every 3 days |
| C | Under 300 | No golden zone — standard pick faces | — | Once at week end |
And here's where I'll say something unpopular: some warehouses write "all new SKUs go to the golden zone" into their SOP. That's not a strategy, that's laziness. A tier-C SKU might move a few dozen units a month. Parking it in the golden zone forces real high-velocity SKUs into deep slots, where pickers walk extra miles. Golden-zone slots have an opportunity cost measured in meters — the walking distance a golden face saves per day, amortized against a tier-C SKU, is negative ROI.
The counter-case: a pet-supply seller in Dongguan, November 2024. New cat tree, week-one forecast of 2,000 orders, 20 golden faces assigned. Actual week one: 300 orders. Twenty golden faces sat idle for five days while two legacy A-tier SKUs got pushed to the second level, and pickers climbed ladders hundreds of extra times a day. A wrong forecast is forgivable. A wrong tier with no exit mechanism is not.
Week-One Reslot Triggers: Front-Loading the Maintenance Pain
The last piece of the algorithm, and the one most people skip: reslot trigger lines. My counterintuitive take — week-one slotting shouldn't be a one-shot job. Slot in three stages, like a rocket shedding stages: day one gets the full peak allocation, day three adjusts against actual velocity, and the weekend locks in the long-term slot. Getting it right once is luck. Getting it right three times is engineering.
Write the triggers into the SOP so nobody has to watch the numbers by hand:
- Velocity under 50% of forecast: automatic downgrade on day 3, out of the golden zone, faces released to queued SKUs. Don't mourn it — sunk cost isn't cost.
- Velocity over 150% of forecast: expand within 48 hours, adjacent golden-zone faces first, then temporary pick faces if needed. Expansion has to outrun the blowup; measure replenishment response in hours, not days.
- Any face with picker queues over 10 minutes for two straight days: expand immediately, regardless of forecast. That signal is more honest than any model — the floor never lies.
Think of it as preventive maintenance on equipment: the forecast is the factory spec, the trigger lines are the alarm thresholds in operation. A system with no alarm thresholds only discovers problems through human eyes, and human eyes are the most expensive sensor you own.

Is the Money Worth It? One Number Tells You
This whole slotting algorithm for new SKUs comes down to one number: average pick time per order in week one.
Compare the new SKU's week-one average pick time against the mean of legacy SKUs in the same category. Within 15%, your slotting did its job. Over 30% off, and either the reserve was too small, the location was wrong, or the trigger lines weren't executed. Pull it from your WMS daily. No new hardware, no extra cost.
One last thing that will offend some people: most week-one blowups get post-mortemed as "sales exceeded expectations." Exceeding expectations is sales' achievement. The blowup is the warehouse's failure — because you had an entire week-one window to adjust slots, and you treated slotting like interior decoration: installed once, never touched. Slots are consumables, not fixed assets.
By Da Liu, Automation Engineer