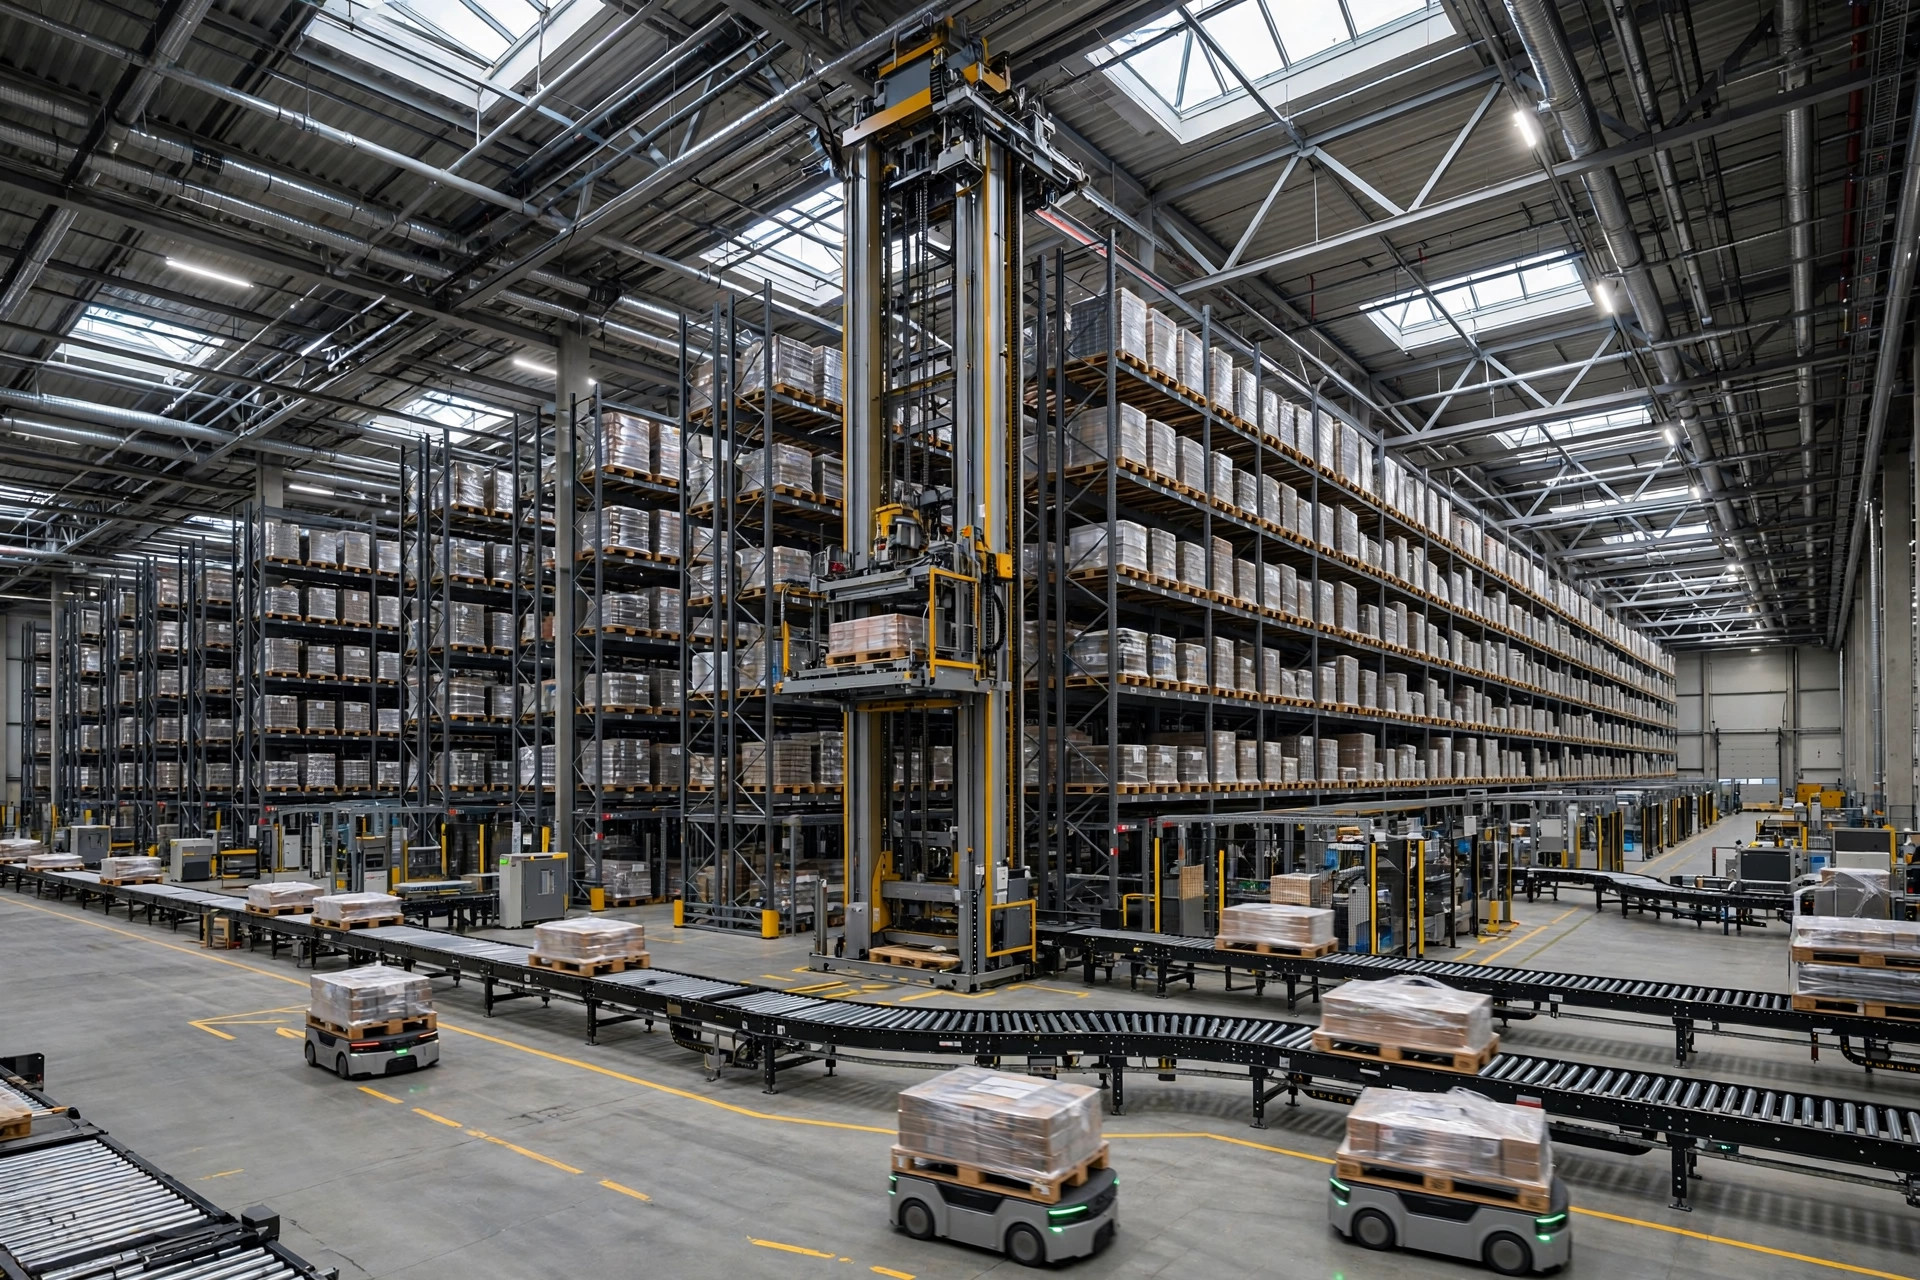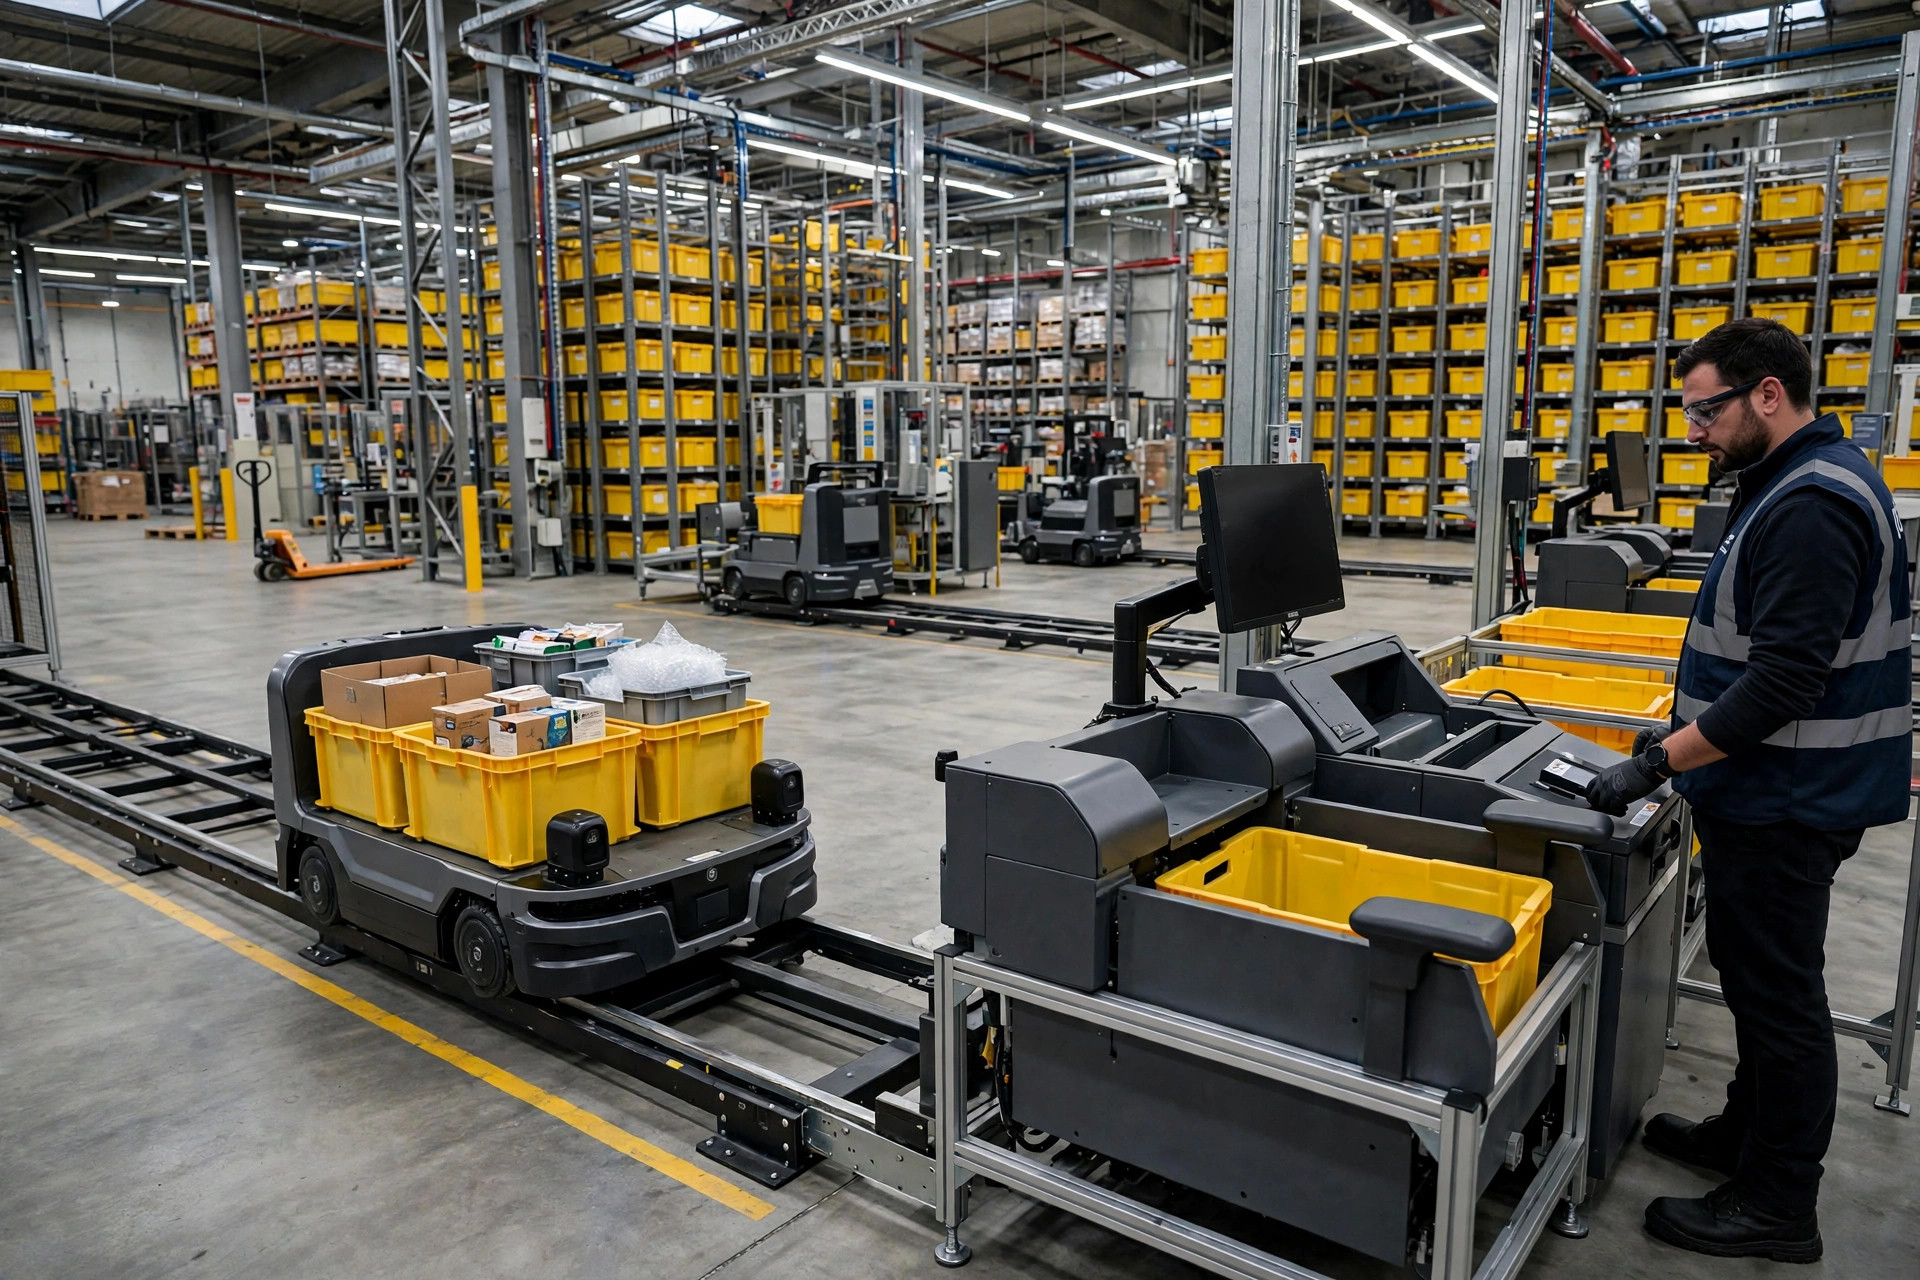
Run the numbers first: a warehouse doing 8,000 order lines a day with 15,000 SKUs spends, at typical US fully-loaded cost, over $40,000 a year per picker — 30 pickers means $1.2 million-plus a year on person-to-goods picking. A goods-to-person installation runs $2.5–4 million all-in. On paper that's a 3–4 year payback, and right there the sales deck flips to the signature page. But the math has a precondition the salesperson won't volunteer: your volume has to be stable and your SKUs concentrated. Miss either one, and goods-to-person doesn't save money — it raises your cost per order.
Goods-to-person vs person-to-goods was never a question of advanced beating outdated. It is an arithmetic problem. Here's the framework for solving it.
Split the Cost Structures Before Comparing Anything
Most people start by comparing "efficiency." Wrong move. Compare cost structures first, because the two routes spend money in completely different places:
| Cost item | Person-to-goods | Goods-to-person |
|---|---|---|
| Labor | High, scales linearly with volume | Lower, but with a fixed crew floor |
| Travel time | 50–60% of pick labor hours | Near zero |
| Upfront investment | Low (racking + carts) | High ($2–5M range; get an integrator quote) |
| Annual maintenance | Low | Roughly 5–8% of equipment value |
| Capacity elasticity | High — add temp labor | Low — ceiling is welded to the hardware |
| Error rate | Higher | Lower |
The one line that matters: person-to-goods cost is variable, goods-to-person cost is fixed. Variable cost follows volume — slow month, spend less. Fixed cost doesn't care whether you have orders; depreciation and the maintenance contract bill you the same. That single difference drives every conclusion below.
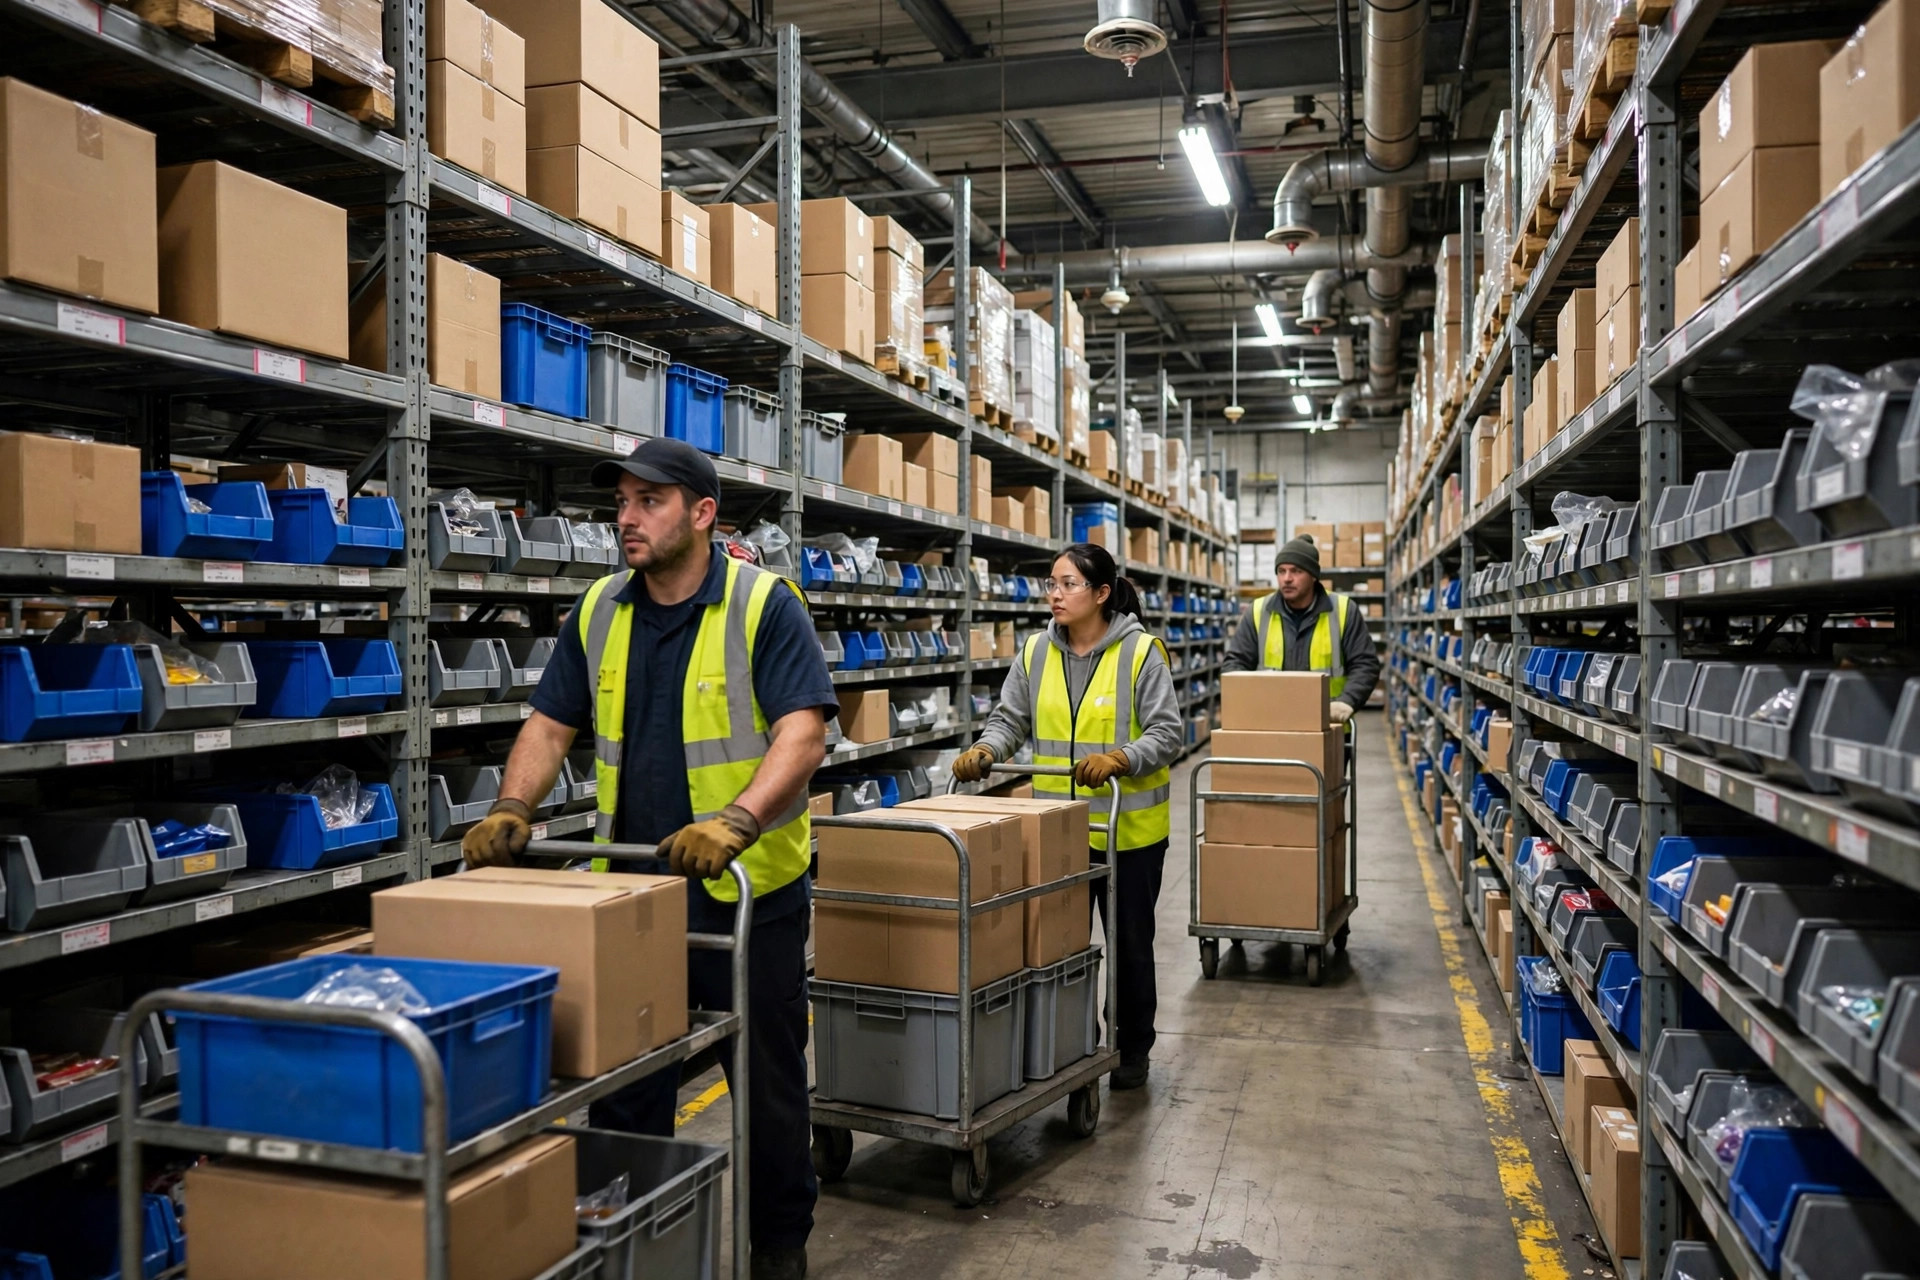
Three Dimensions Draw the Goods-to-Person vs Person-to-Goods Line
Dimension one: daily order lines. Lines, not orders — one line is one pick. The rule-of-thumb boundary sits around 5,000 lines/day: below it, goods-to-person's fixed cost can't spread thin enough, and per-order depreciation exceeds the labor you saved. Above 10,000 lines/day, the scale economics start working clearly in its favor.
Dimension two: SKU velocity distribution. The steeper your ABC curve, the better goods-to-person fits — when the top 20% of SKUs drive 80%+ of order lines, station and robot utilization stay high. If your SKUs are egalitarian with a long tail that never moves, half the goods-to-person storage sits idle, utilization never climbs, and ROI never materializes.
Dimension three: seasonality coefficient — peak divided by average. The most ignored and most lethal dimension. Above 2.5, be careful: size the system for peak and it idles expensively in the off-season; size it for average and you're stacking temp labor at peak, which dilutes the whole "save labor" logic by half.
The decision table:
| Dimension | Favors person-to-goods | Favors goods-to-person |
|---|---|---|
| Daily order lines | < 5,000/day | > 10,000/day |
| SKU velocity | Long-tail, dispersed | Concentrated head (steep ABC) |
| Seasonality (peak/avg) | > 2.5 | < 1.8 |
Two out of three landing on the left means goods-to-person money is probably money wasted.
Two Warehouses, Two Outcomes
In 2024, a beauty e-commerce warehouse in Chino ran 20,000+ SKUs at 6,000 lines a day — spiking to 24,000 lines in the October–December peak and collapsing to 2,500 in the off-season, a seasonality coefficient near 4. Sold on "cut costs, boost efficiency," the owner installed two shuttle-based goods-to-person systems for $3.8 million. The result? Seven slow months with equipment utilization under 40%, depreciation ticking, the maintenance contract billing, and the operators still on payroll. Finance ran the numbers: off-season cost per pick came out roughly 30% higher than plain manual picking before the automation. Money wasted — not because the equipment was bad, but because this warehouse's order profile couldn't support it.
In 2023, an auto-parts warehouse in Ontario ran 8,000 SKUs with the top 20% driving 85% of order lines, 12,000 lines a day, ±15% variation all year — steady as a metronome. They installed tote-based goods-to-person for $2.9 million, cut picking headcount from 46 to 18, and hit payback in 22 months. The owner told me he did exactly one thing before signing: pulled 18 months of daily order-line data and read it three times, confirming volatility capped at 1.3.
Same class of equipment, opposite outcomes. The difference wasn't the hardware. It was the person doing the math.
The Counterintuitive Truth: Goods-to-Person Saves Walking, Not Labor
Here's the contrarian read: goods-to-person never really saves "labor" in the aggregate — it saves the walking portion of labor hours. In person-to-goods picking, travel eats 50–60% of pick labor time, and goods-to-person deletes it. But if your warehouse's travel share was never above 40% to begin with — concentrated SKUs, compact layout, small pick zone — the savings ceiling was locked low from day one, and no ROI model will look good.
Second contrarian point: in a highly seasonal warehouse, goods-to-person's fixed cost bites back in the off-season. Labor is a rubber band — add heads when orders surge, cut when they fade. Equipment is rebar — the capacity ceiling is welded in place, and in the trough you just watch it idle and burn money. The Chino warehouse's problem was fundamentally this: fitting rebar to a rubber-band business.
So stop asking whether goods-to-person is "more advanced" than person-to-goods. That's a false question. The only real question: can my order profile spread this fixed cost thinner than labor?
The Three-Step Costing Method — Let the Numbers Speak
Step one: pull 12 months of daily order-line data and compute the average, the peak, and the seasonality coefficient (peak/average). No 12 months of data? Then don't talk automation yet — you haven't understood your own business.
Step two: compute your current fully-loaded cost per pick — labor, error rework, verification, all of it. Most operators discover at this step that their person-to-goods cost was never as high as they imagined.
Step three: take the integrator's quote, depreciate over 5 years into a per-order figure, and compare against step two. Include annual maintenance (5–8% of equipment value) and off-season idling — not just the "theoretical throughput" on the sales slides.
The calculable conclusion: seasonality coefficient above 2.5, or under 5,000 lines a day — don't touch goods-to-person yet. Get ABC slotting and wave picking right first; that alone cuts cost per order 15–20% for a fraction of a goods-to-person budget. When your order profile can actually carry the equipment, then automate — every dollar spent then is investment, not tuition.
By Lao Zhou, Logistics Cost Analyst