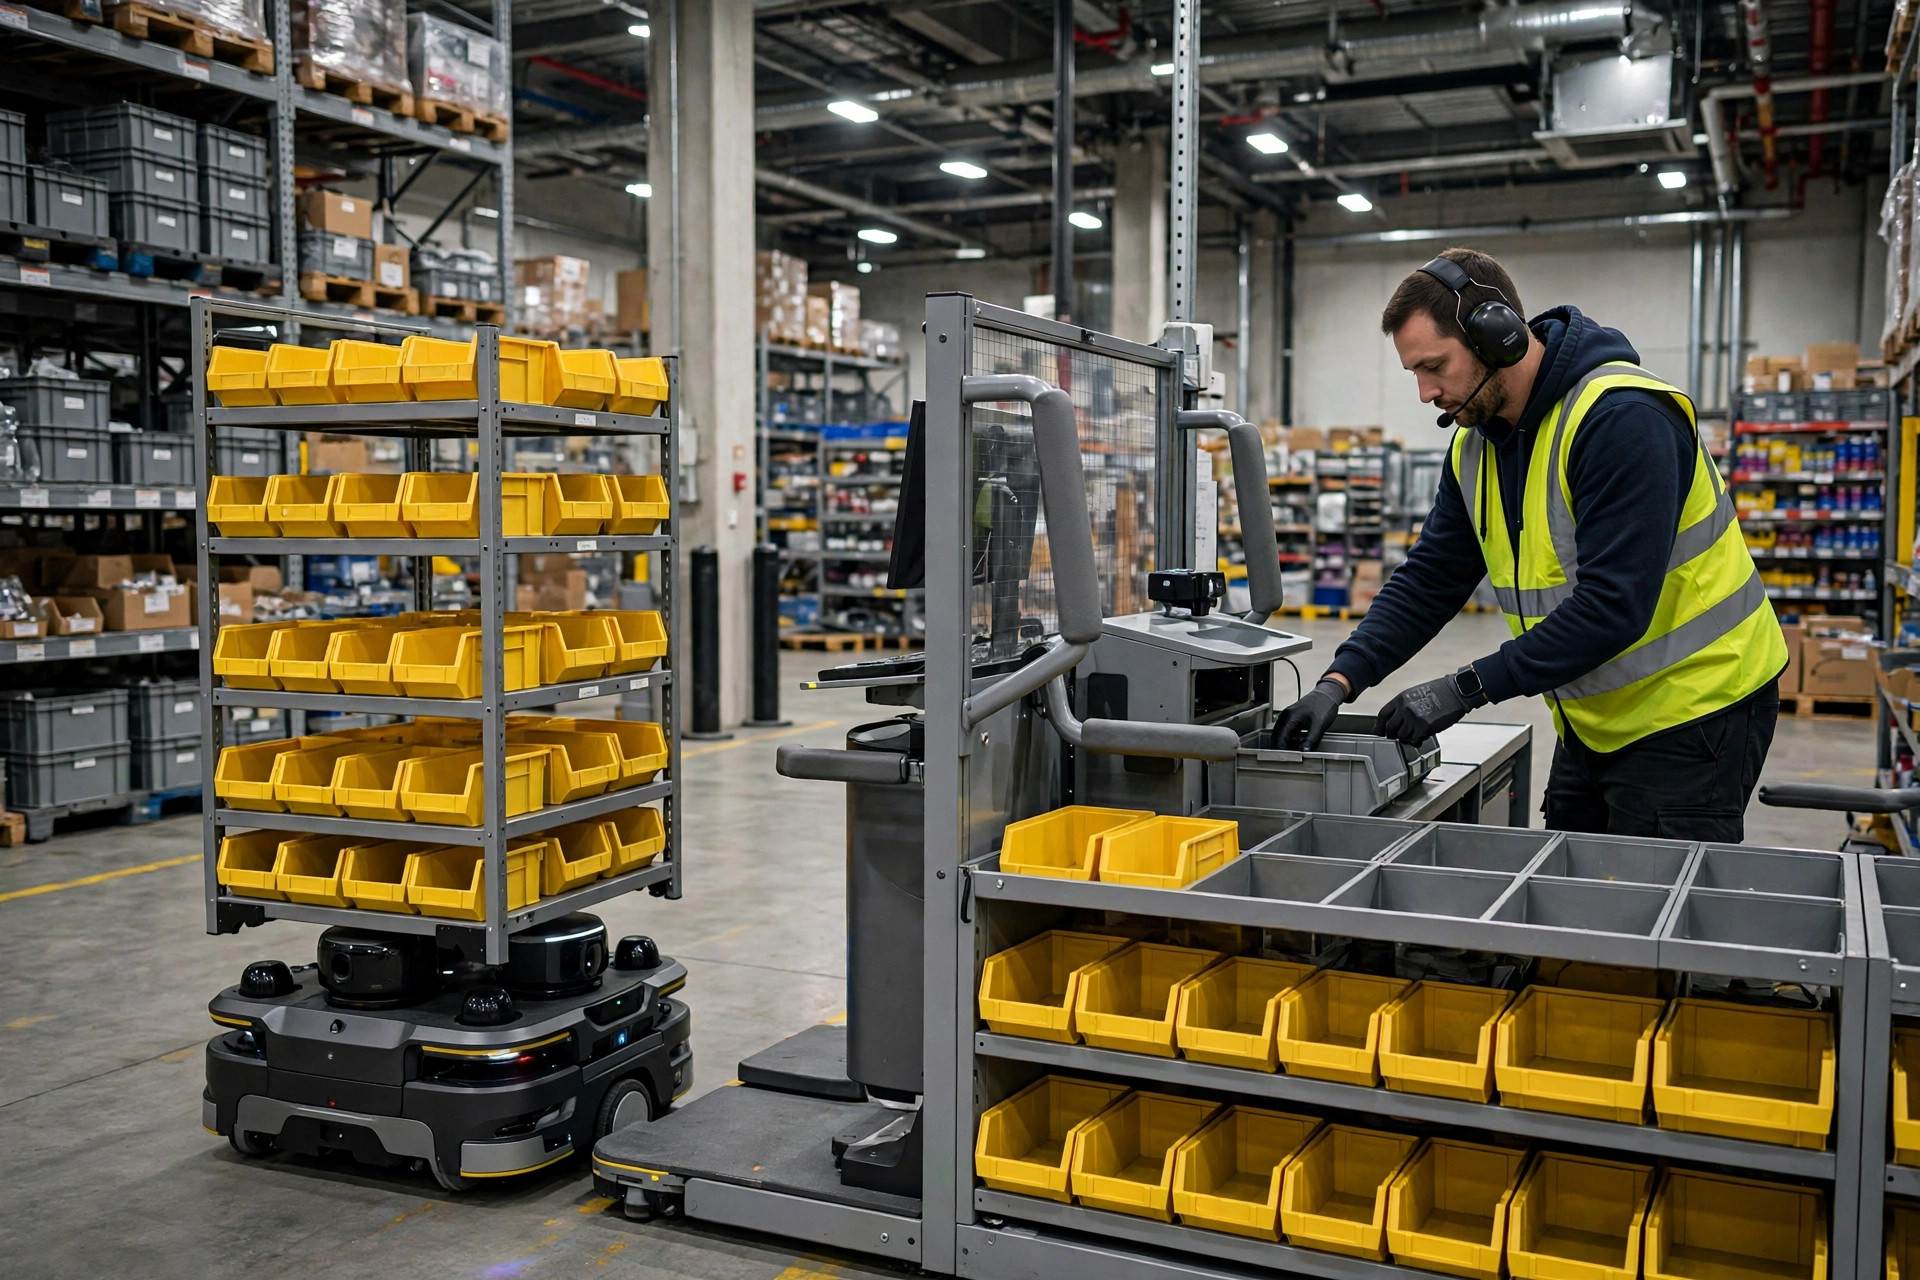
Let me open with a bill. In October 2024, a 3PL in Dallas running an auto-parts e-commerce operation out of a 50,000-square-foot warehouse showed me a vendor proposal that read "3.2-year payback" on a goods-to-person system. The owner asked me to audit the math. I crossed out three assumptions and ran it again: 6.8 years. The extra 3.6 years were hiding in three lines of fine print — pick stations always running at full rate, labor costs frozen at this year's level, and no facility move for three years.
This article does one thing: it takes apart the goods to person ROI payback calculation so you can run it yourself — and challenge it.
The Payback Formula Is Simple. The Inputs Are Not.
The formula is one line, nothing mysterious:
Payback (years) = Total Investment ÷ Annual Net Savings
The trouble is that both sides of that equation get "optimized" — by the vendor and sometimes by your own team. Start with the numerator. Total investment is not the equipment quote. Every payback worksheet I have ever audited is missing the same line items:
| Investment item | What usually gets left out |
|---|---|
| Hardware (racking, shuttles, CTU bots, pick stations) | Is the quote tax- and freight-inclusive? How many years of spare parts are bundled? |
| Software (WES / orchestration licenses) | Annual or perpetual? Is the year-two subscription fee in the math? |
| Integration | Who pays the man-days to integrate with your existing WMS? |
| Facility work | Floor load capacity, fire sprinkler re-evaluation, lighting — often "quoted separately" |
| Financing | If you are paying in installments, the interest belongs in the numerator |
On the Dallas project, software subscription and sprinkler re-evaluation alone were 11% of total investment — and the original worksheet listed neither. Shrink the numerator by a year of hidden cost and the payback magically looks a year shorter.
Now the denominator. Annual net savings = labor cost avoided + error-reduction savings + space savings − the new operating costs the system creates. That last term matters: a GTP system is not zero-labor. Pick stations need operators, the system needs technicians, replenishment needs staffing. I have seen worksheets "forget" two system technicians — tens of thousands of dollars a year.
Three Input Assumptions That Decide Everything
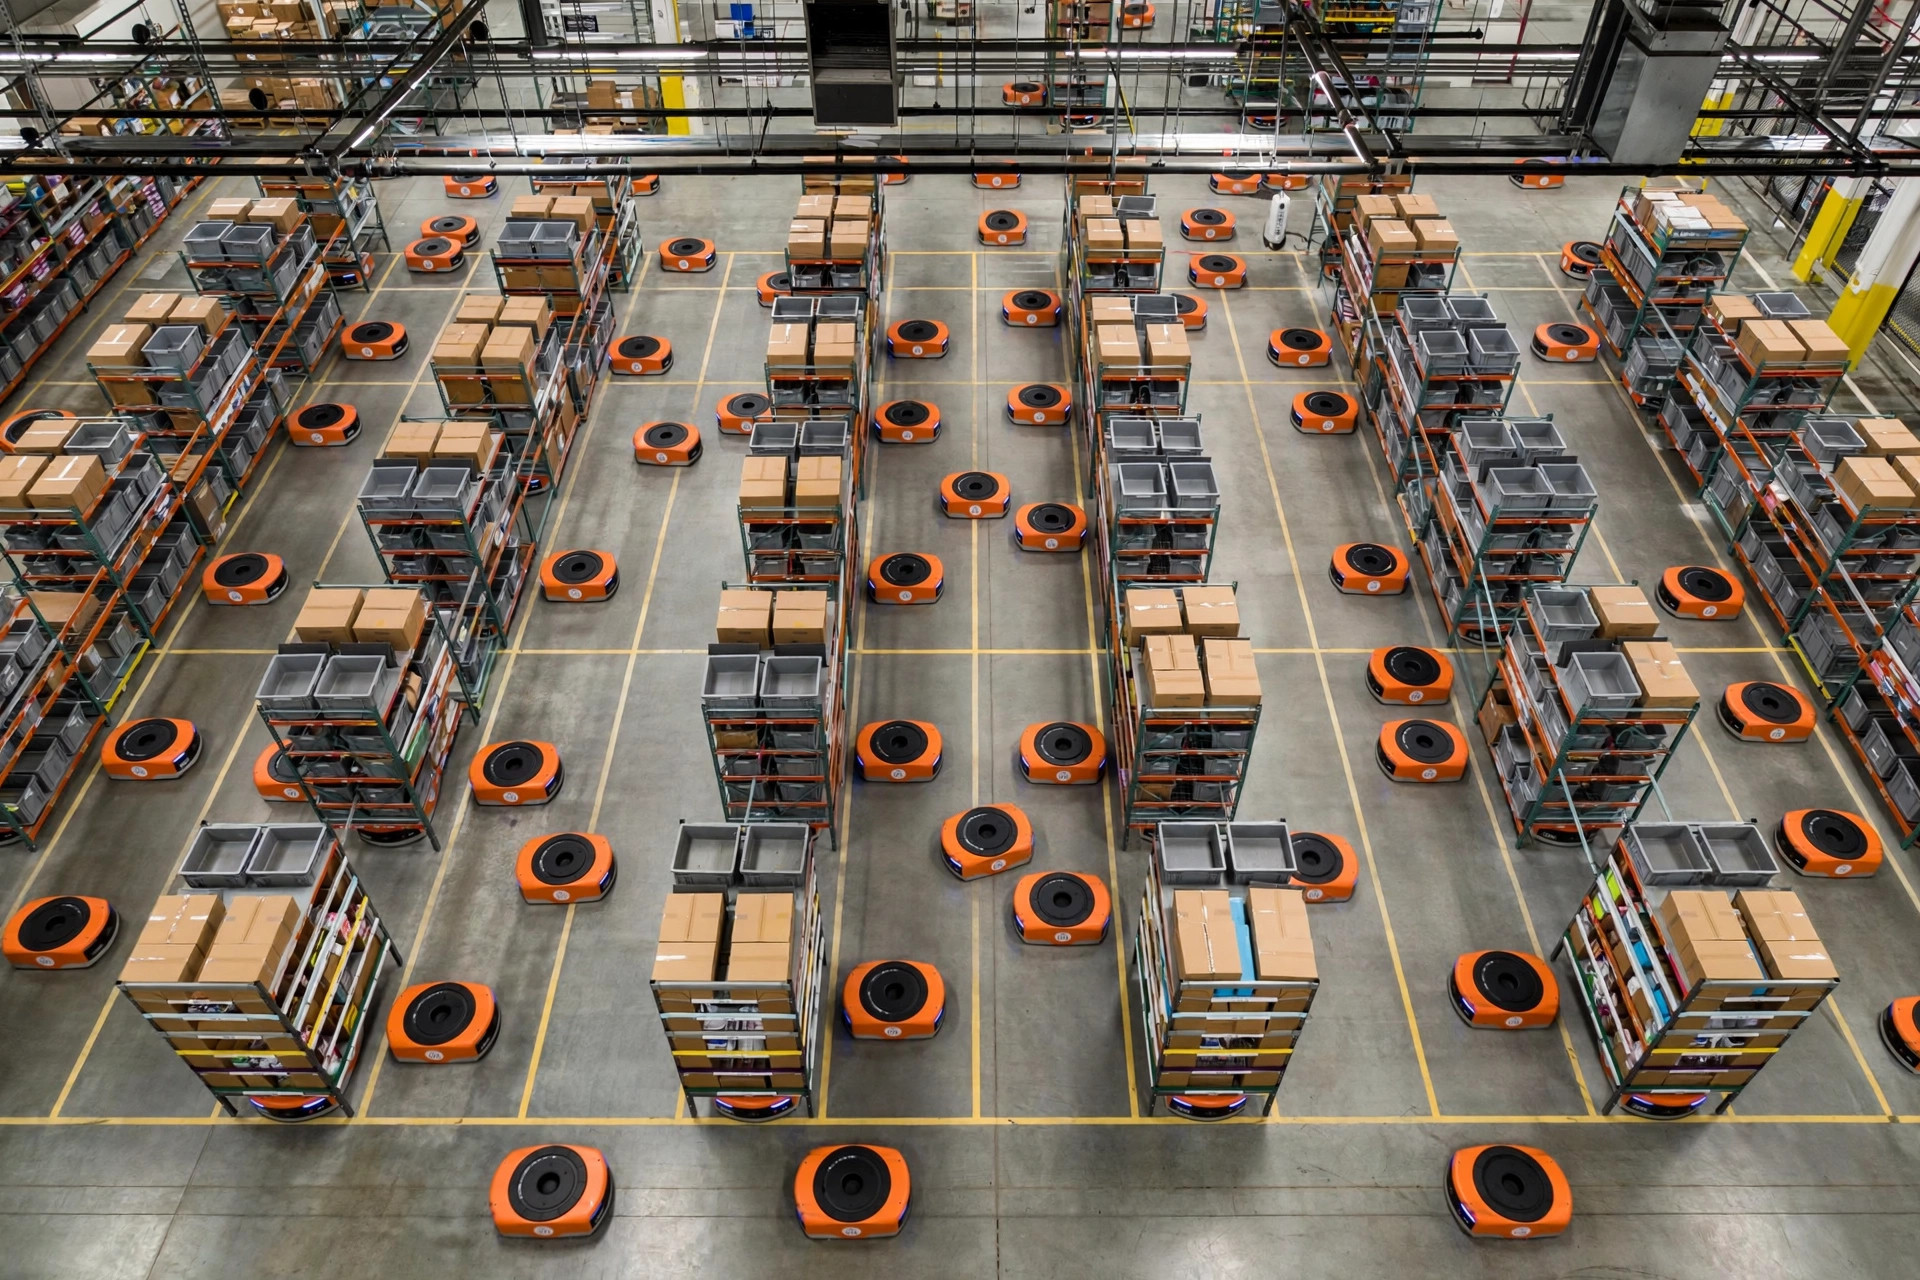
Three numbers in the denominator decide whether the payback is three years or seven. And on vendor worksheets, all three tend to be set at their rosiest values.
First, pick-station rate utilization. The brochure says 300 to 500 UPH (units per hour) per station. In lab conditions that may be true. Your warehouse is not a lab: bad wave planning means the system waits for orders; replenishment that cannot keep up means empty slots; the wrong SKU profile — oversized or awkward items — kills the rate. In the post-implementation reviews I have done, fewer than one in three sites sustain more than 70% of the brochure rate over time. Most sit at 50% to 65%.
Second, headcount avoided. The worksheet's "18 FTEs eliminated" is calculated on three full shifts, 365 days. Is your building truly running three shifts? What about the slow season? Plenty of e-commerce warehouses run at full tilt four months a year and idle the GTP system the other eight — while the labor-avoidance math counts all twelve months at full value. Discount it by your real shifts and seasonality.
Third, labor cost inflation. Worksheets love "wages rise 5% a year, so savings compound." US warehouse wages have been rising, but is 5% your number or a guess? Pull your last three years of payroll, take the arithmetic mean. Few operations I have seen clear 4%.
Each of these moving ten points shifts the payback by one to two years. Here is the sensitivity table from my Dallas re-calculation:
| Scenario | Rate utilization | Labor avoided (discounted) | Payback |
|---|---|---|---|
| Vendor original | 90% | 18 FTE (full roster) | 3.2 years |
| Conservative | 65% | 12 FTE (seasonality-adjusted) | 5.1 years |
| Pessimistic | 55% | 10 FTE | 6.8 years |
Same equipment, same vendor, different assumptions, double the payback. A GTP payback calculation never really prices the equipment. It prices the assumptions.
The Counterintuitive Part: What Kills Payback Is Not the Price Tag
Most buyers worry about overpaying for the hardware. Wrong worry. Equipment running 10% over budget adds three to four months to payback. Utilization dropping ten points adds a year or more. Throughput is the only real lever in this system. Everything else is small money.
Why does the rate never hold? I have seen three real causes. First, replenishment. GTP flips "people to goods" into "goods to people," but the inventory on those racks does not restock itself. In early 2025, a cross-border e-commerce warehouse in eastern China installed a CTU-style goods-to-person system rated at 400 UPH per station and ran it at 220 for months — the replenishment team was still staffed and scheduled like the old manual-picking days, and empty-slot rates hovered above 15%. Million-dollar equipment, waiting on hourly-wage work.
Second, order profile. GTP hates two things: oversized items and extreme long-tail SKUs. Big items wreck station ergonomics and cut the rate in half; long-tail SKUs mean racks full of "zombie slots" occupying expensive automated storage positions, touched a few times a year. At the Dallas auto-parts site, 40% of SKUs moved fewer than 12 times a year — those goods had no business inside the GTP zone at all. Screening them out to conventional racking would have shrunk the system by a full tier.
Third, waves and ramp-up. For the first three months after go-live, the WES-to-WMS wave logic and exception handling are still being tuned. Hitting 50% utilization in that period is doing well. "Full production from day one" is the most expensive optimism I know.
One trade-off you must face: shuttle-based systems, CTU/AMR shelf-to-person, and miniload-style tote systems are not better or worse — they are different bets. Shuttles give density and strong per-station throughput but lock you into fixed aisles. CTU-style adds or removes bots freely, the most flexible, but takes more floor. Picking the wrong architecture and then fine-tuning the payback is renovating the wrong foundation — Dallas chose CTU-style for one reason: four years left on the lease, and a shuttle system bolted to the floor becomes a sunk cost the day you move.
Where the Real Savings Levers Are
With the math audited, here is where you can actually move the needle.
First, SKU screening. Do a rigorous ABC analysis and let only A SKUs — and some B SKUs — into the automated zone. Every automated slot is priced at equipment depreciation plus software subscription. Parking slow movers there is burning money. Cut the system 20% and the payback drops by roughly a year.
Second, replenishment staffing. GTP replenishment runs at two to three times the intensity of manual-picking days — it needs its own headcount and its own KPIs, not a side job. The China site that made replenishment a dedicated team cut its empty-slot rate from 15% to 6% and recovered twelve points of utilization. No new equipment spend.
Third, treat error-reduction savings separately and conservatively. GTP genuinely drives pick error rates from the manual 1%–3% range down toward 0.1%, and returns, customer service, and reship costs are real money. But this line is where worksheets get inflated: "errors go to zero," or one return costed at thirty dollars. Use your actual trailing-twelve-months returns data, and model the improvement as "cut in half," not "eliminated."
A Conclusion You Can Compute Yourself
Do not trust any off-the-shelf "3 to 5 year payback." Run these three numbers yourself:
- Your real station UPH. Not the brochure. Take your current manual pick UPH, multiply by 2.5 — an empirical factor I have found conservative and reliable — then apply 65% utilization.
- Your fully loaded cost per FTE. Hourly wage × 2,080 hours plus benefits and payroll taxes (typically another 25%–30% in the US), times the headcount you can truly avoid, seasonality-adjusted.
- Your total investment. Equipment plus five years of software subscription plus integration plus facility work — item by item, and make the vendor fill every blank.
Payback = Total investment ÷ (annual labor savings + annual error savings × 0.5 − new operating costs). Under 4 years, it is worth negotiating. Four to five years means you are betting on your confidence in throughput and order profile. Over five years, go back and fix your ABC slotting and wave planning first — the equipment conversation can wait until next year.
Whether the money is well spent is not something the spreadsheet tells you. The assumptions do. Write them down, replace each one with your own data — that is the entire method.
By Lao Zhou, Logistics Cost Analyst