Same warehouse, same dataset, two payback figures: 18 months and 32 months. Both vendors swore theirs was "industry standard."
A friend of mine runs an e-commerce fulfillment operation in Ontario, California. Last December he had two automation proposals on his desk for a cross-belt sorter. Vendor A said 18-month payback. Vendor B said 27 months. Same building, same order history, nine months apart — and both sales reps sounded equally confident.
I told him to set both proposals aside and answer one question first: how many orders a day in peak, and how many off-peak?
"Six thousand off-peak. Eighteen thousand in peak."
That's where the nine months went. Vendor A ran the ROI on annual average volume. Vendor B ran it near peak. And here's the thing about this warehouse: across all 365 days of the year, not a single day actually runs at the annual average.
The average day doesn't exist
Off-peak: 6,000 orders a day. Shoulder season: 9,000. Peak: 18,000. The arithmetic mean lands around 10,000 a day, and it looks reassuringly smooth on a spreadsheet. But that number never appears on a labor schedule. It never appears on an outbound curve. No crew was ever staffed for it, no carrier capacity ever booked against it.
Vendors love the average, and the reason is not mysterious: it shrinks the denominator, which flatters the cost-per-order, which shortens the payback period. An 18-month payback proposal closes deals faster than a 27-month one. The math isn't wrong; the assumption feeding it is.
I've seen where this ends. Back in 2019 I worked on a 3PL project in Indianapolis — 4,000 units a day off-peak, 15,000 in peak — where the vendor had modeled everything on the average and signed off with total confidence. Year one after go-live, the owner discovered he still needed double the headcount every peak: the sorter ran flat-out and it still wasn't enough, and off-peak it sat there getting dusted. The equipment itself didn't lose money. The labor bill blew up. At the year-one ROI review, nobody wanted to bring up the original 18-month projection.
Peak orders are expensive orders
This is the fatal flaw of average-based modeling: it assumes every order costs the same. In reality, a peak-season order and an off-peak order can differ in cost by 40% or more.
Start with people. California requires overtime at 1.5x after 8 hours in a day. In peak, your full-timers work 11-hour days, and those last three hours cost time and a half. In the Inland Empire, warehouse pay runs roughly $19–22 an hour based on public job postings — so overtime lands around $30 an hour. You never paid that rate in February.
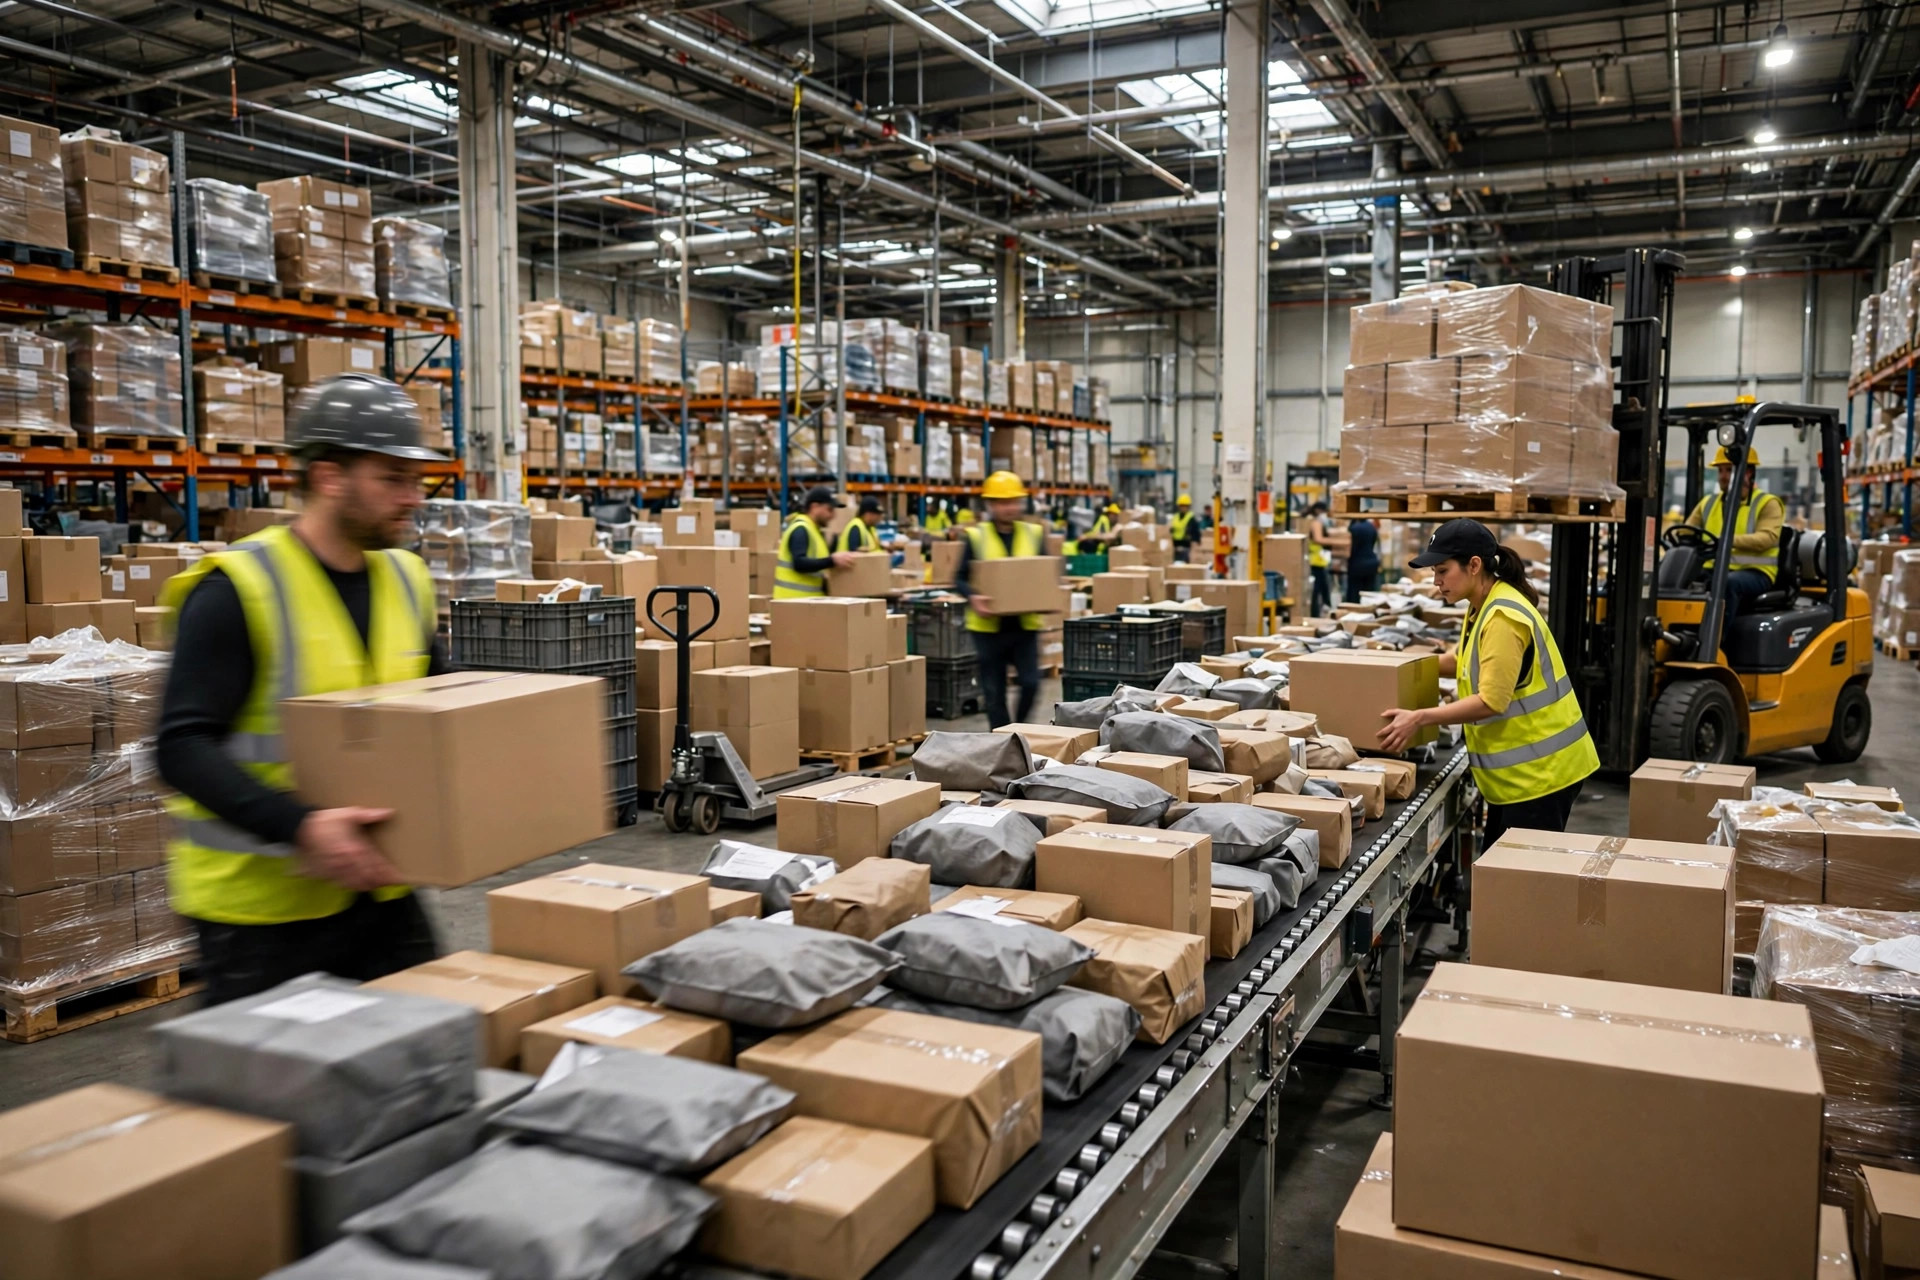
Temporary labor costs more still. You start hoarding temps two months before peak, and between the staffing agency's cut and the seasonal premium, the real cost typically runs 1.3 to 1.4 times a full-timer's rate — when things go well. The worst year I saw, a warehouse faced a 30% temp shortfall the week before Thanksgiving and ended up paying double the daily rate to poach workers. And temps run at maybe sixty to seventy percent of a veteran's productivity for their first two weeks, with higher error rates — the returns and reships all land in the "peak" column.
Then there's the carrier. UPS and FedEx levy peak demand surcharges from late September through mid-January. In the 2025 cycle, residential ground packages carried $0.40–$2.05 per package, with high-volume shippers facing up to $8.75. If half of your 18,000 daily peak orders are residential, that's tens to over a hundred thousand dollars a month in surcharges alone. It has nothing to do with your sorter — but it determines whether your peak is actually profitable, which determines whether you can afford automation at all.
Average-based ROI assumes peak and off-peak cost the same. That assumption fails at step one, and the more precise the spreadsheet gets after that, the further off it lands.
Size for the peak, pay back on the weighted average
This is a genuine trade-off with no textbook answer — only choices.
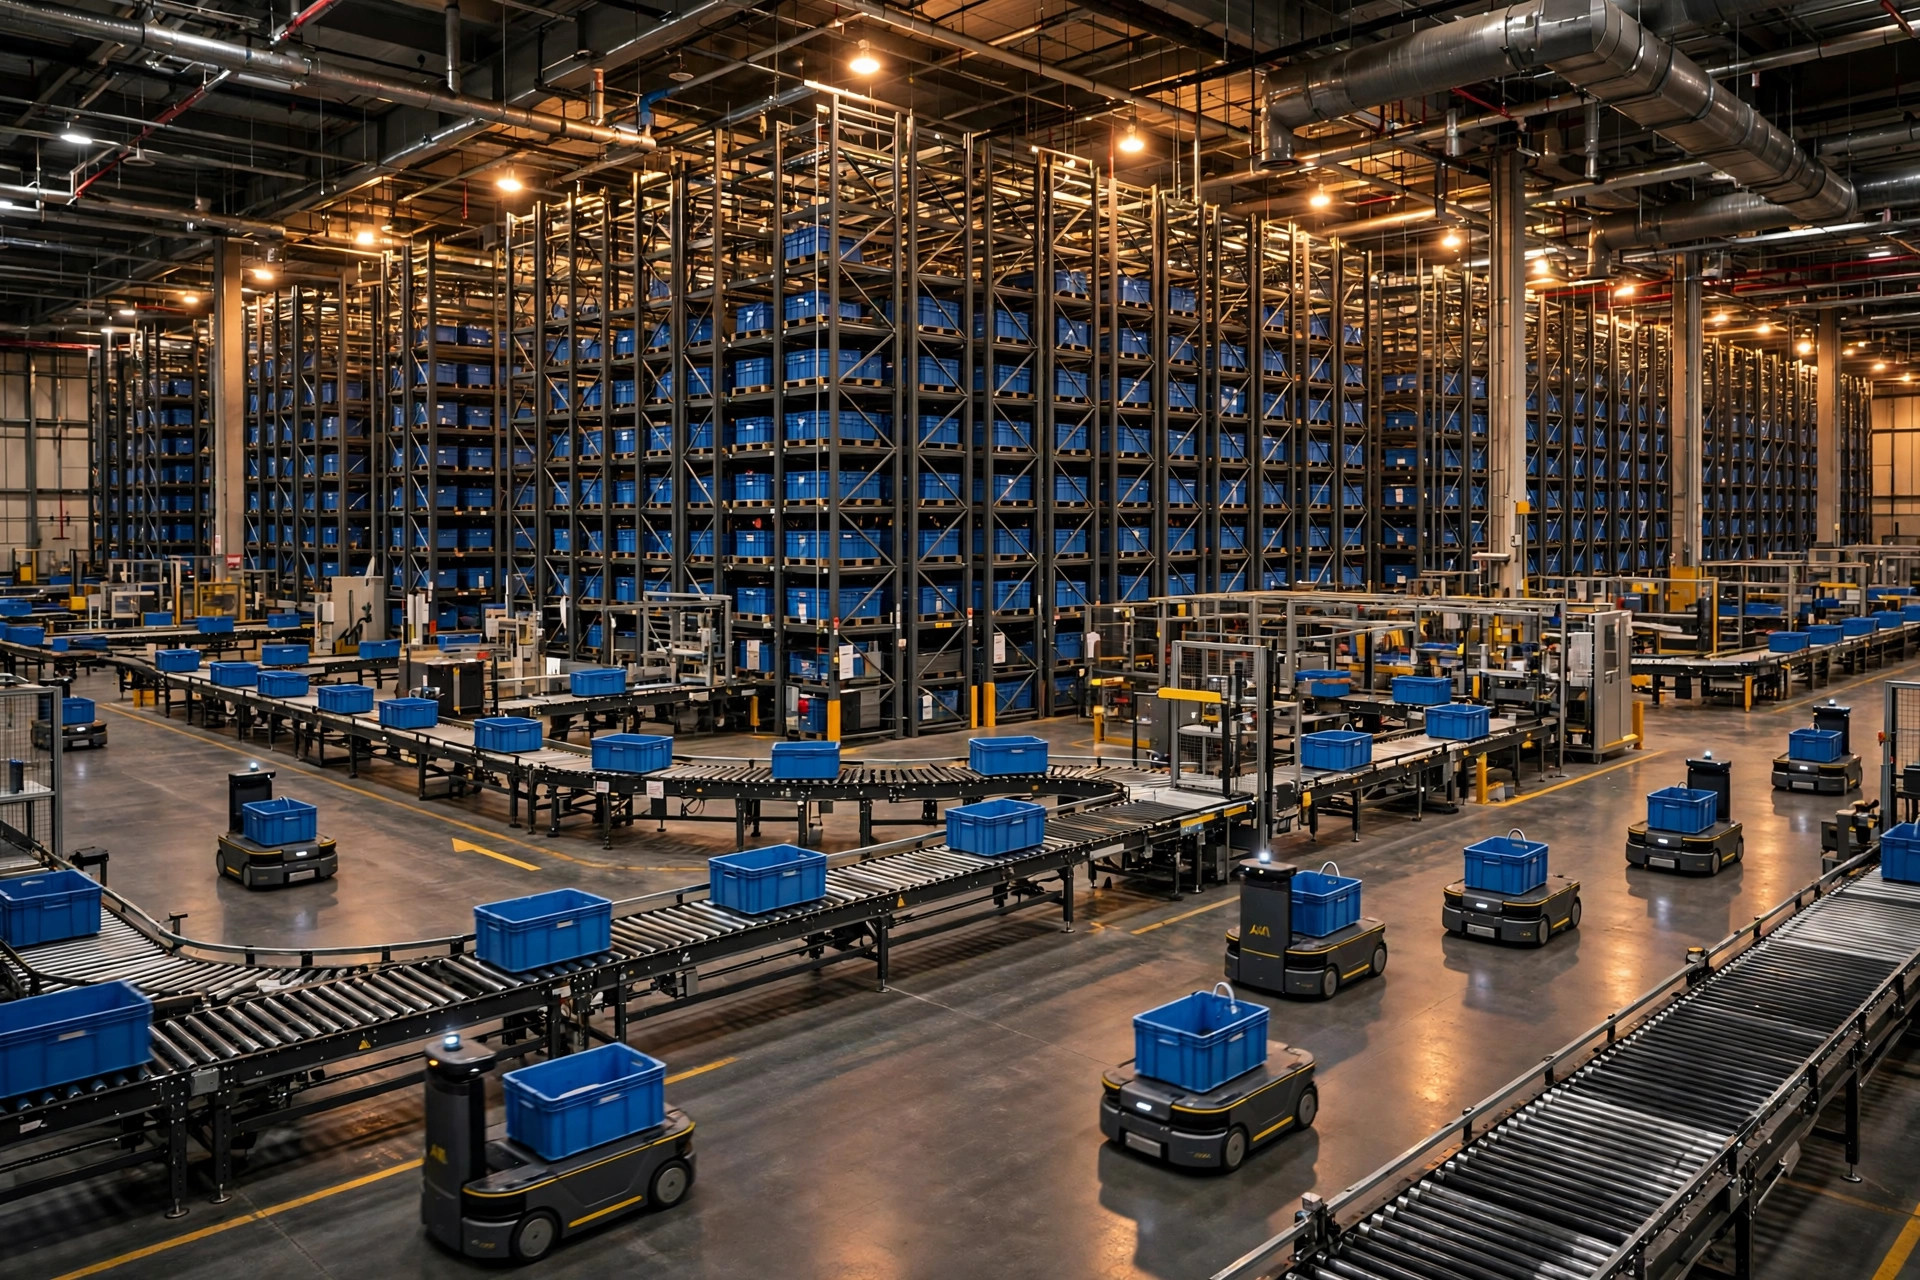
Heavy automation — cross-belt sorters, AS/RS, AMR fleets — gets sized for the peak but sits idle for much of the year. Depreciation doesn't care about seasonality, but the savings only have value when you're busy. If your sorter runs four hours a day off-peak at under 20% utilization, it isn't saving "labor cost" — it's saving a fraction of a labor cost you barely had.
Sizing to the average is worse: the equipment maxes out in peak, the overflow falls straight back onto overtime and temp labor, and the machine you bought to save money can't deliver savings in the three most expensive months of the year.
So the right question isn't "which volume do I size to." It's two separate sentences: model payback on the weighted average; plan capacity for the peak. And bridge the gap between peak and average with flexible capacity — temp labor, short-term equipment rental, overflow agreements with a 3PL. Let the fixed assets cover only the throughput you genuinely use year-round.
A worked example — every number below is hypothetical
The method is straightforward, four steps:
First, split the year into three tiers — off-peak, shoulder, peak — with daily volume and day counts for each. Say: off-peak five months at 6,000 orders/day; shoulder four months at 9,000; peak three months at 18,000.
Second, price labor in three tiers: straight time, full-timer overtime (1.5x), and temp labor (agency markup plus a productivity haircut, on its own line). Don't forget the training cost and the two-week ramp where temps underperform — most models silently drop this.
Third, draw the equipment utilization curve: for each tier, how many hours a day does the machine actually run? In months where utilization sits below 40%, discount the savings — idle capacity saves nothing, that's physics.
Fourth, compute payback on the weighted numbers: calculate the labor cost automation displaces in each tier, weight by days, get annual savings, divide into total investment.
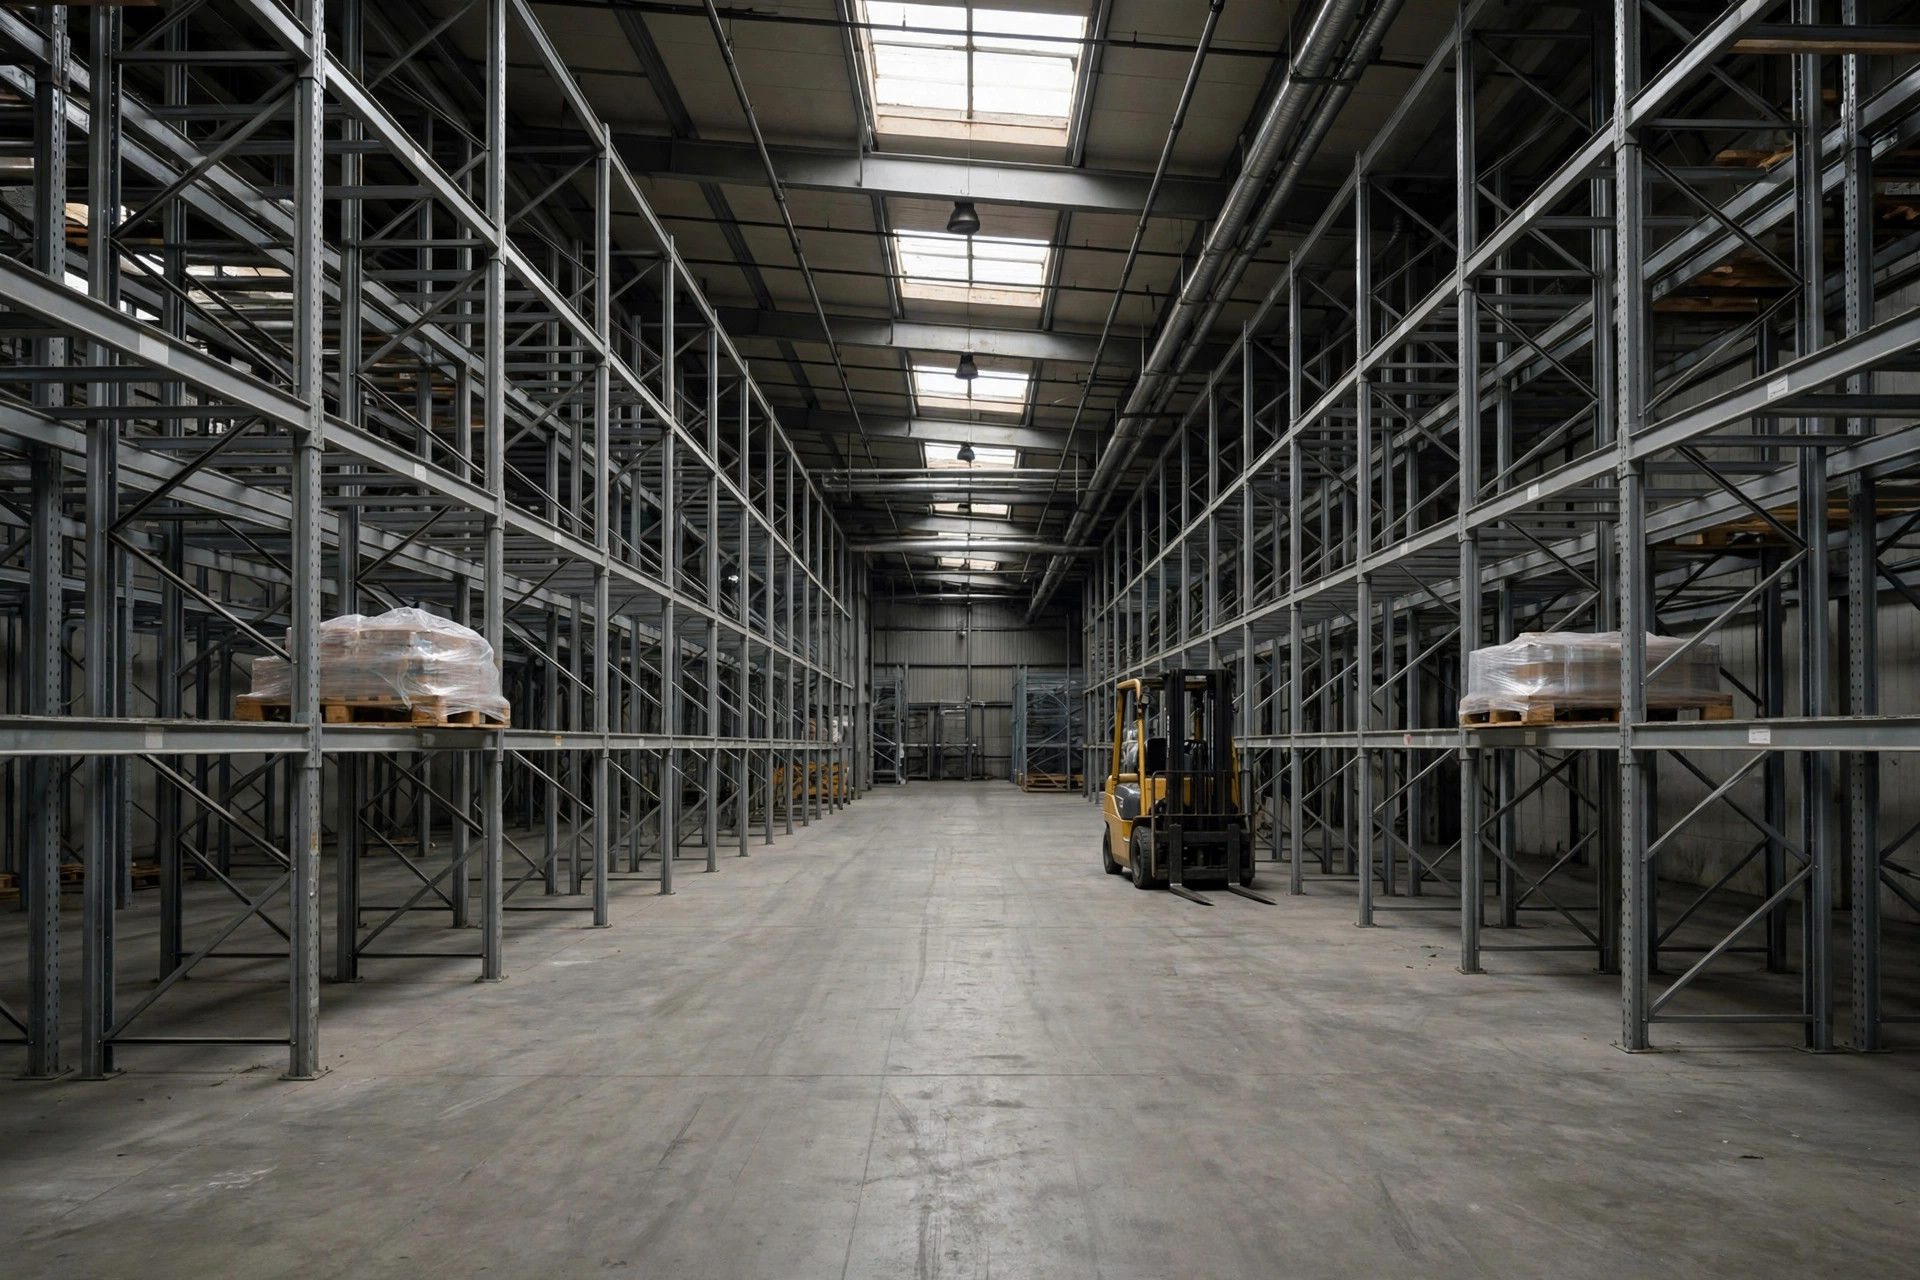
Take my friend's Ontario warehouse as an illustration — all figures hypothetical, to demonstrate the method only: a 120,000-square-foot e-commerce fulfillment site. Off-peak 6,000 orders/day (150 days), shoulder 9,000/day (120 days), peak 18,000/day (95 days). Full-time pay at $20/hour (Inland Empire market rate), overtime at 1.5x, temps at 1.35x. A cross-belt sorter at $1.8 million all-in, displacing sort labor:
- Off-peak: displaces 8 straight-time positions. 8 × $20 × 8 × 150 = $192,000
- Shoulder: displaces 12 people — 8 straight-time plus 4 working 3 overtime hours daily. (8 × $20 × 8 + 4 × $30 × 3) × 120 = $196,800
- Peak: displaces 20 people — 10 straight-time, 6 with 3 overtime hours daily, 4 temps. (10 × $20 × 8 + 6 × $30 × 3 + 4 × $27 × 8) × 95 = $285,380
Annual savings: roughly $674,000. Payback: $1.8M ÷ $674K ≈ 2.7 years — 32 months.
The vendor's average-based version: about 10,000 orders/day average, displacing 20 straight-time positions year-round. 20 × $20 × 8 × 365 = $1.17 million a year. Payback: 18.5 months.
Same project, 18 months versus 32 months. The 14-month gap isn't a math problem — it's an assumption problem. Peak labor premiums and off-peak idle time both got swallowed by the average.
I'll close with an unpopular opinion: if your peak-to-trough ratio exceeds 3-to-1 and your peak runs shorter than three months, don't buy heavy automation. The equipment sits idle nine months a year and the math never works. Spend the money on flexibility instead — a real temp-labor pipeline, short-term equipment leases, an overflow deal with a 3PL. Same caution for warehouses where SKUs and carton specs change every year: process-bound equipment like sorters will eat your projected savings in retrofit costs. Heavy assets belong in warehouses with fluctuation under 2x, peaks lasting four months or more, and a mostly stable process.
Something you can do tonight: export your last twelve months of daily outbound orders, plot the curve, mark the three tiers. Then ask your vendor which tier their ROI model actually used.