Any serious attempt to deploy ai warehouse energy anomaly detection in a working warehouse has to start with an uncomfortable observation: a single revenue meter can tell management what the month cost, but it cannot say which system wasted energy, at what hour, or because of which unnoticed change in operating habit. When refrigeration, forklift charging, lighting, compressed air, and conveyor lines all sit behind the same service entrance, every abnormality gets averaged into the total curve. It shows up as a slightly expensive month, which is rarely specific enough to trigger an investigation, let alone a repair that can be defended with evidence.
The analytical difficulty is not that the algorithms are exotic. It is that warehouse load is a mixture of systems with entirely different drivers. Refrigeration follows outdoor temperature, door openings, and inbound volume. Charging follows shifts and order waves. Lighting should follow occupancy almost mechanically. Air compressors and conveyors follow throughput. Model those loads as one aggregate series and the model learns the shape of the total, not the shape of normal behavior for each system, so it either cries wolf on ordinary peaks or stays silent while a genuine waste pattern runs for weeks.
How ai warehouse energy anomaly detection builds a baseline that means something
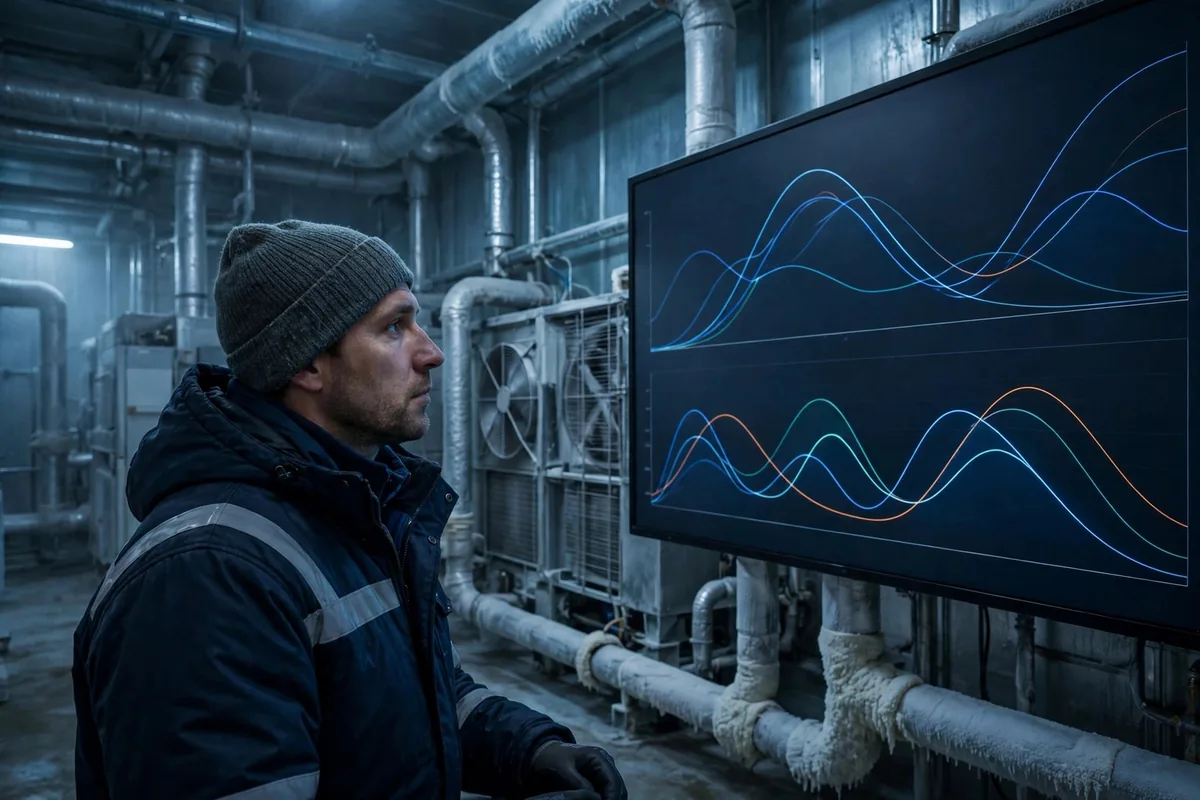
The workable approach is submetering by function, separating at least four load families: refrigeration, charging, lighting, and motive power. Each family gets its own baseline, and each baseline gets its own explanatory variables. Refrigeration is judged against temperature, door-open time, and receipts. Charging is judged against the number of vehicles plugged in and the shift pattern. Lighting is judged against operating hours and daylight. Conveyors are judged against units handled. A baseline, in this sense, is not a flat daily average. It is a conditional range: given comparable weather and comparable throughput, consumption should fall inside this band, and a sustained move outside the band is what deserves attention.
Baseline length matters more than model sophistication, a point that implementation reports tend to confirm. A baseline trained on one or two quiet weeks will mistake an overtime night for normal behavior and a seasonal shift for equipment failure. A more defensible practice is to let the baseline cover a full order cycle and a meaningful temperature swing, then refresh it on a rolling basis, so the system stays sensitive to slow drift without being captured by a single unusual week. That conditional logic is what separates detection from a monthly energy report, which can only ever say how much was used, never whether that amount was justified.
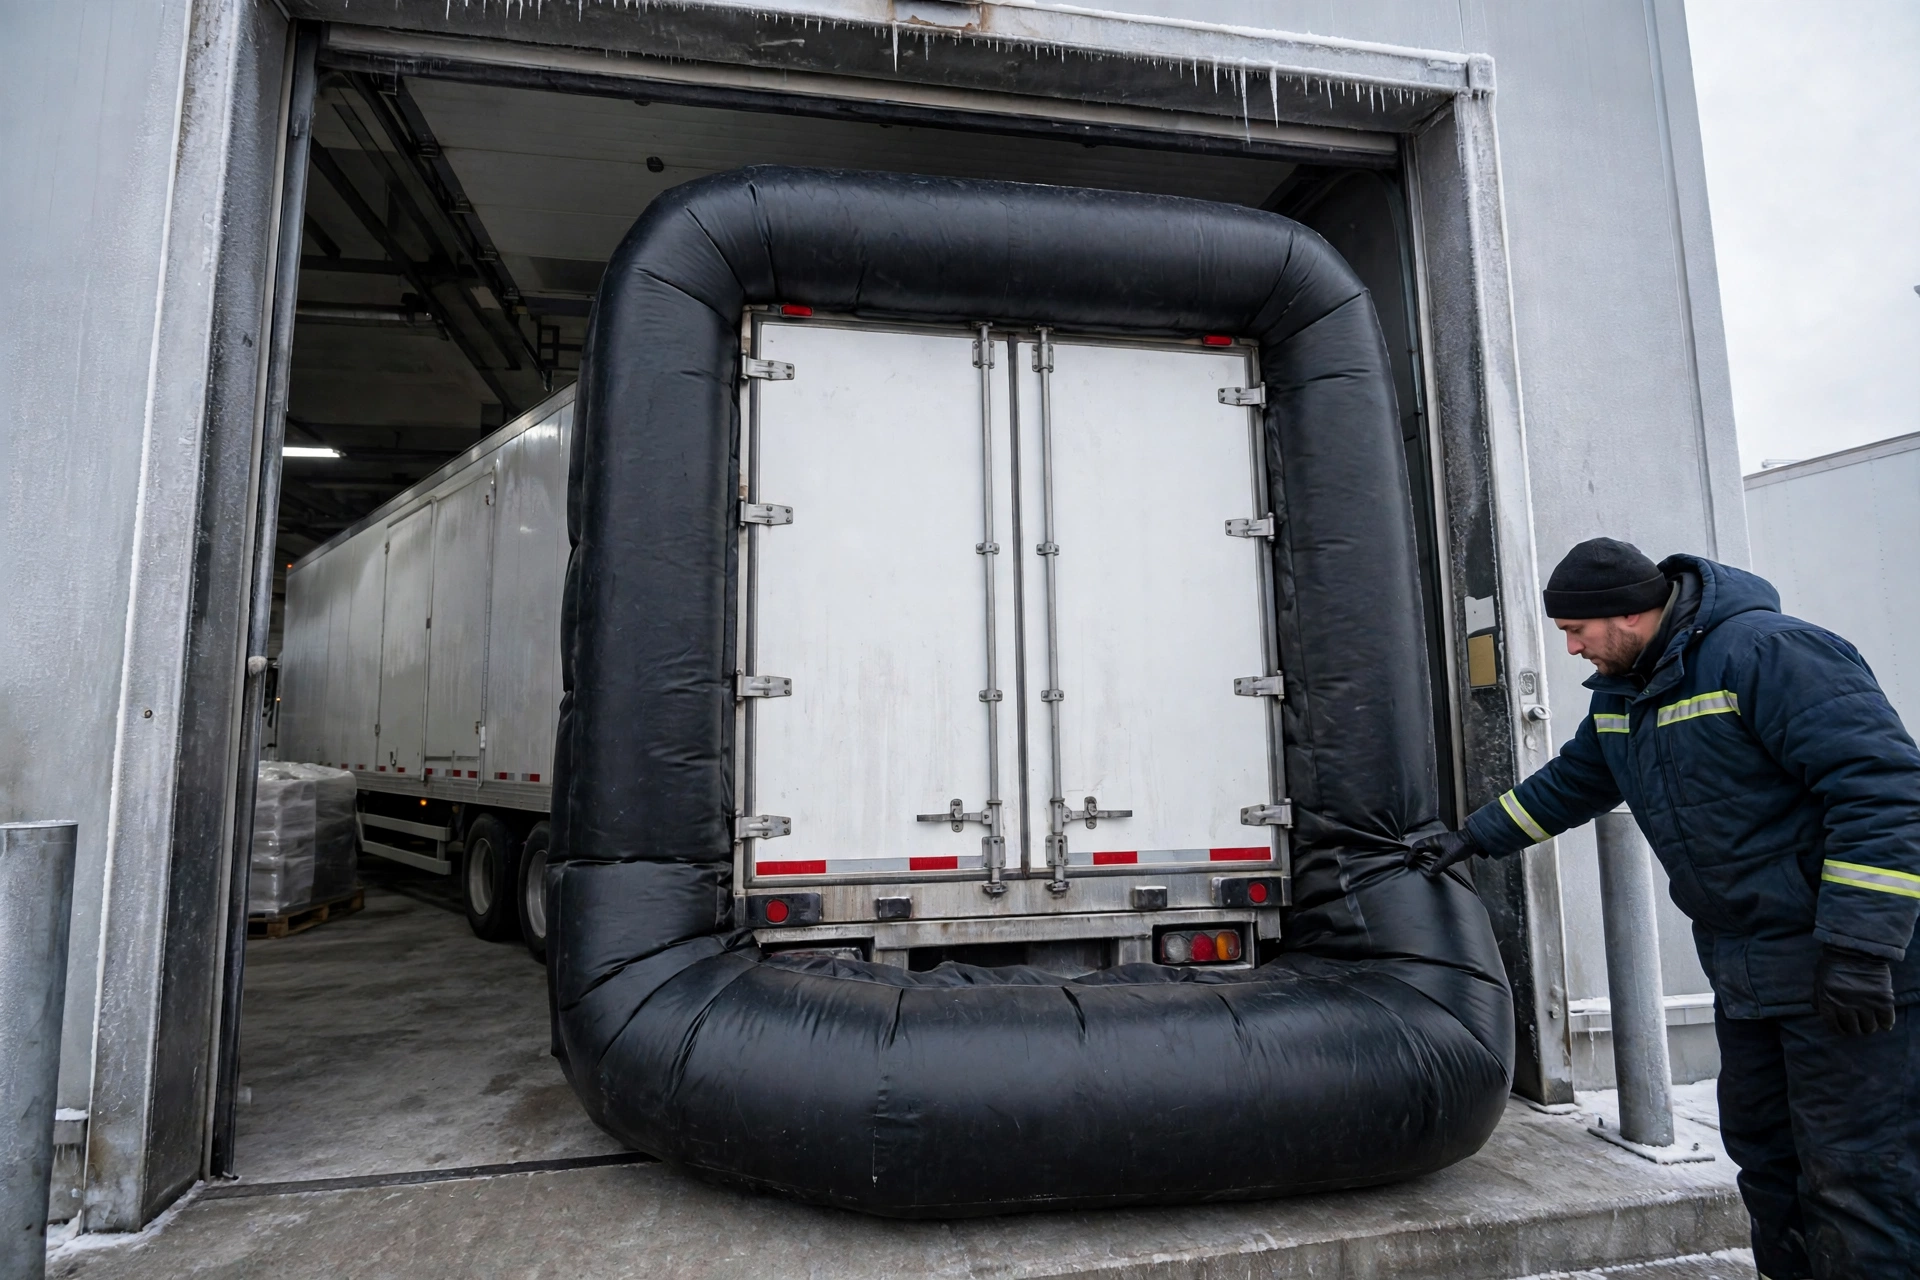
Two illustrative scenarios show what this looks like in practice. In the summer of 2024, a food distribution cold store in eastern China reviewed a pattern in which, under a hypothetical scenario constructed for illustration, refrigeration units kept cycling hard during night hours with no picking or receiving activity, and the submetered curve could not be reconciled with temperature or door records. Maintenance followed the signal to a heavily used cold-room door with a degraded seal, leaking cold air that the plant had been quietly compensating for with longer run time. On the total bill, the fault had looked like nothing more than a somewhat expensive month. On a submetered baseline, it was a multi-day deviation in one consistent direction, with a complete chain of evidence behind it.
The second pattern came from a charging area. In the spring of 2025, an e-commerce warehouse in southern China saw charging load rise sharply at shift handover, while vehicles were still running short of charge during the daytime wave peak. The algorithm had not found a broken charger. It had found a scheduling habit: operators plugged everything in at handover because that was the routine, bunching load into one window without improving vehicle availability at all. Staggering charging by remaining charge and next-shift assignment removed the anomaly entirely. A manual meter-reading routine would almost never catch a pattern like this, because it only exists at a particular hour, in a particular combination.
What ai warehouse energy anomaly detection can save, and where the boundary sits
The return-on-investment discussion needs a boundary drawn before any vendor number is believed, and the boundary is counterintuitive: detection can only recover wasted energy, never total energy. The electricity that refrigeration legitimately needs and that a peak-day conveyor line legitimately draws cannot be optimized away, and any business case calculated as a percentage of the total bill has chosen the wrong denominator. It will look attractive in a proposal and fail in verification. The correct starting point is an inventory of waste: equipment running at night that should be off, extra refrigeration caused by failed seals, lighting burning in empty zones, air systems leaking or idling unloaded. Detection earns its keep by converting that inventory from an estimate into an itemized, checkable list.
A simple decision frame helps before any spending decision. Refrigeration anomalies are usually equipment-condition problems, and fixes tend to persist. Charging anomalies are usually scheduling problems, and fixes tend to be cheap. Lighting anomalies are usually control problems, with a comparatively clear recoverable share. Air and conveyor anomalies require maintenance judgment alongside the data, because a rising load can signal wear rather than waste. Specific tariffs and rates vary and should always be checked against the latest local utility pricing policy; the structure of the argument, however, does not depend on any single rate.
Smaller warehouses do not need to buy the full stack on day one. The low-cost path starts with submetering at the distribution board and a disciplined review of night baseload and peak windows, even if that review is initially rule-based and human-checked. That alone surfaces the most common waste pattern in the sector, equipment that should have stopped and did not. Once enough submetered history exists to support a stable baseline, the detection layer can be added on top, with alert thresholds, false-alarm review, and a repair loop that closes each case. Reversing the order, buying the model before the metering, leaves the model reasoning over a total curve and producing vague alerts. Operators learn to ignore vague alerts quickly, and once ignored, the system has effectively failed regardless of its technical quality.
Viewed over a longer horizon, ai warehouse energy anomaly detection behaves less like a one-off savings project and more like a continuous audit function. Its output is not a promised percentage. It is a stream of deviations that can be verified, repaired, and reviewed, each one attributable to equipment, scheduling, or habit. Once the discussion shifts from why the bill was high to which load family departed from expectation under which conditions, the management question itself has changed, and what that change does to energy decisions over several years of operation remains an open question worth watching.
By Dr. Chen, Supply Chain Researcher