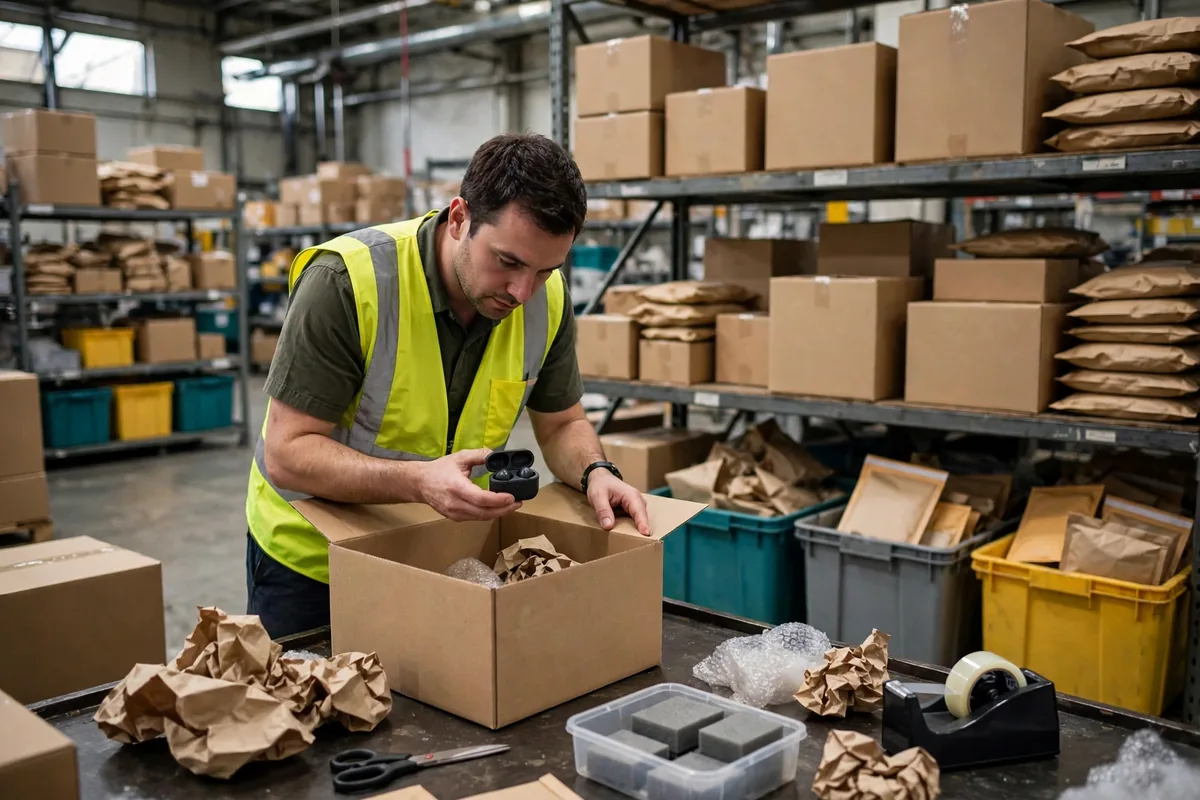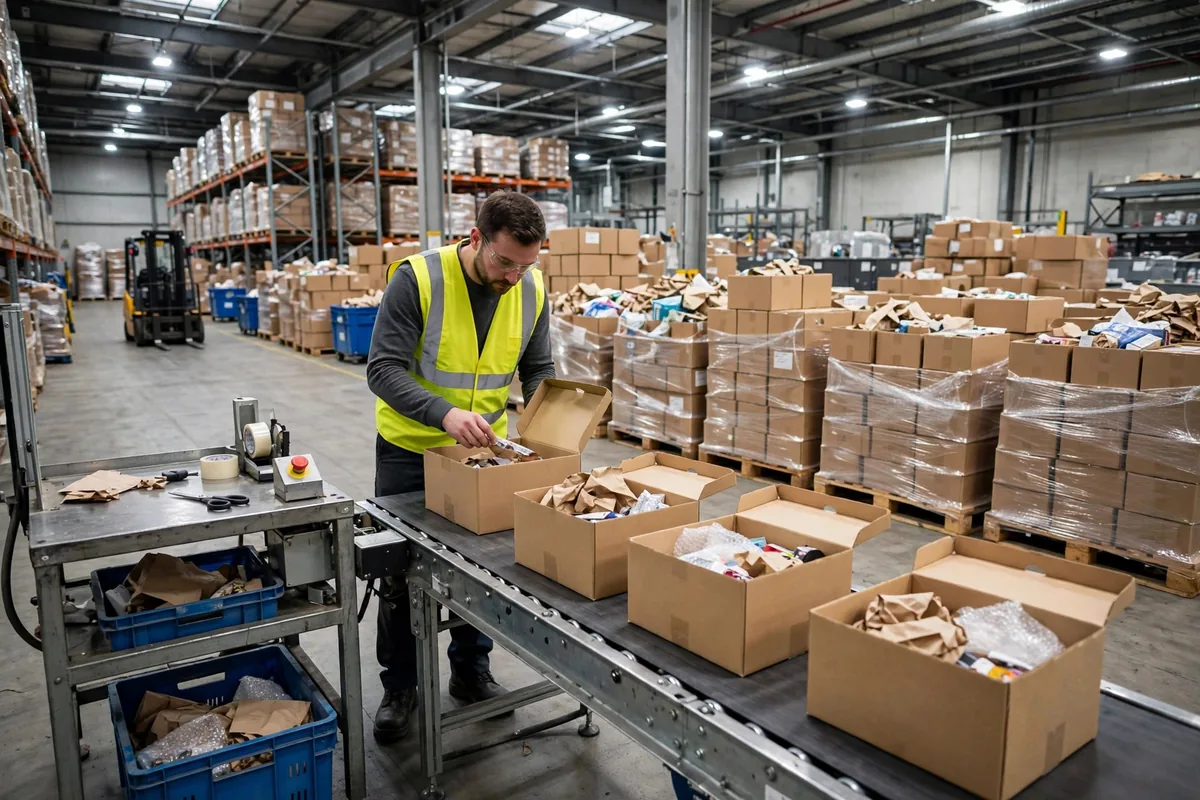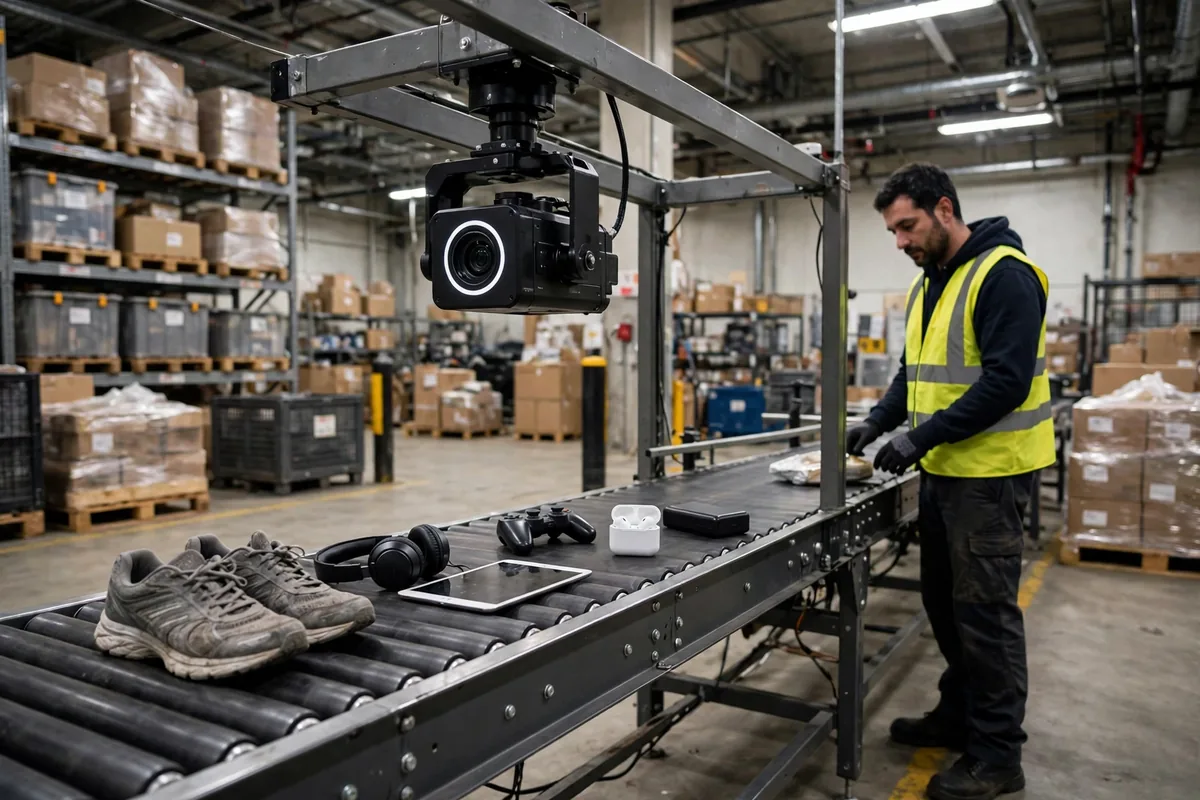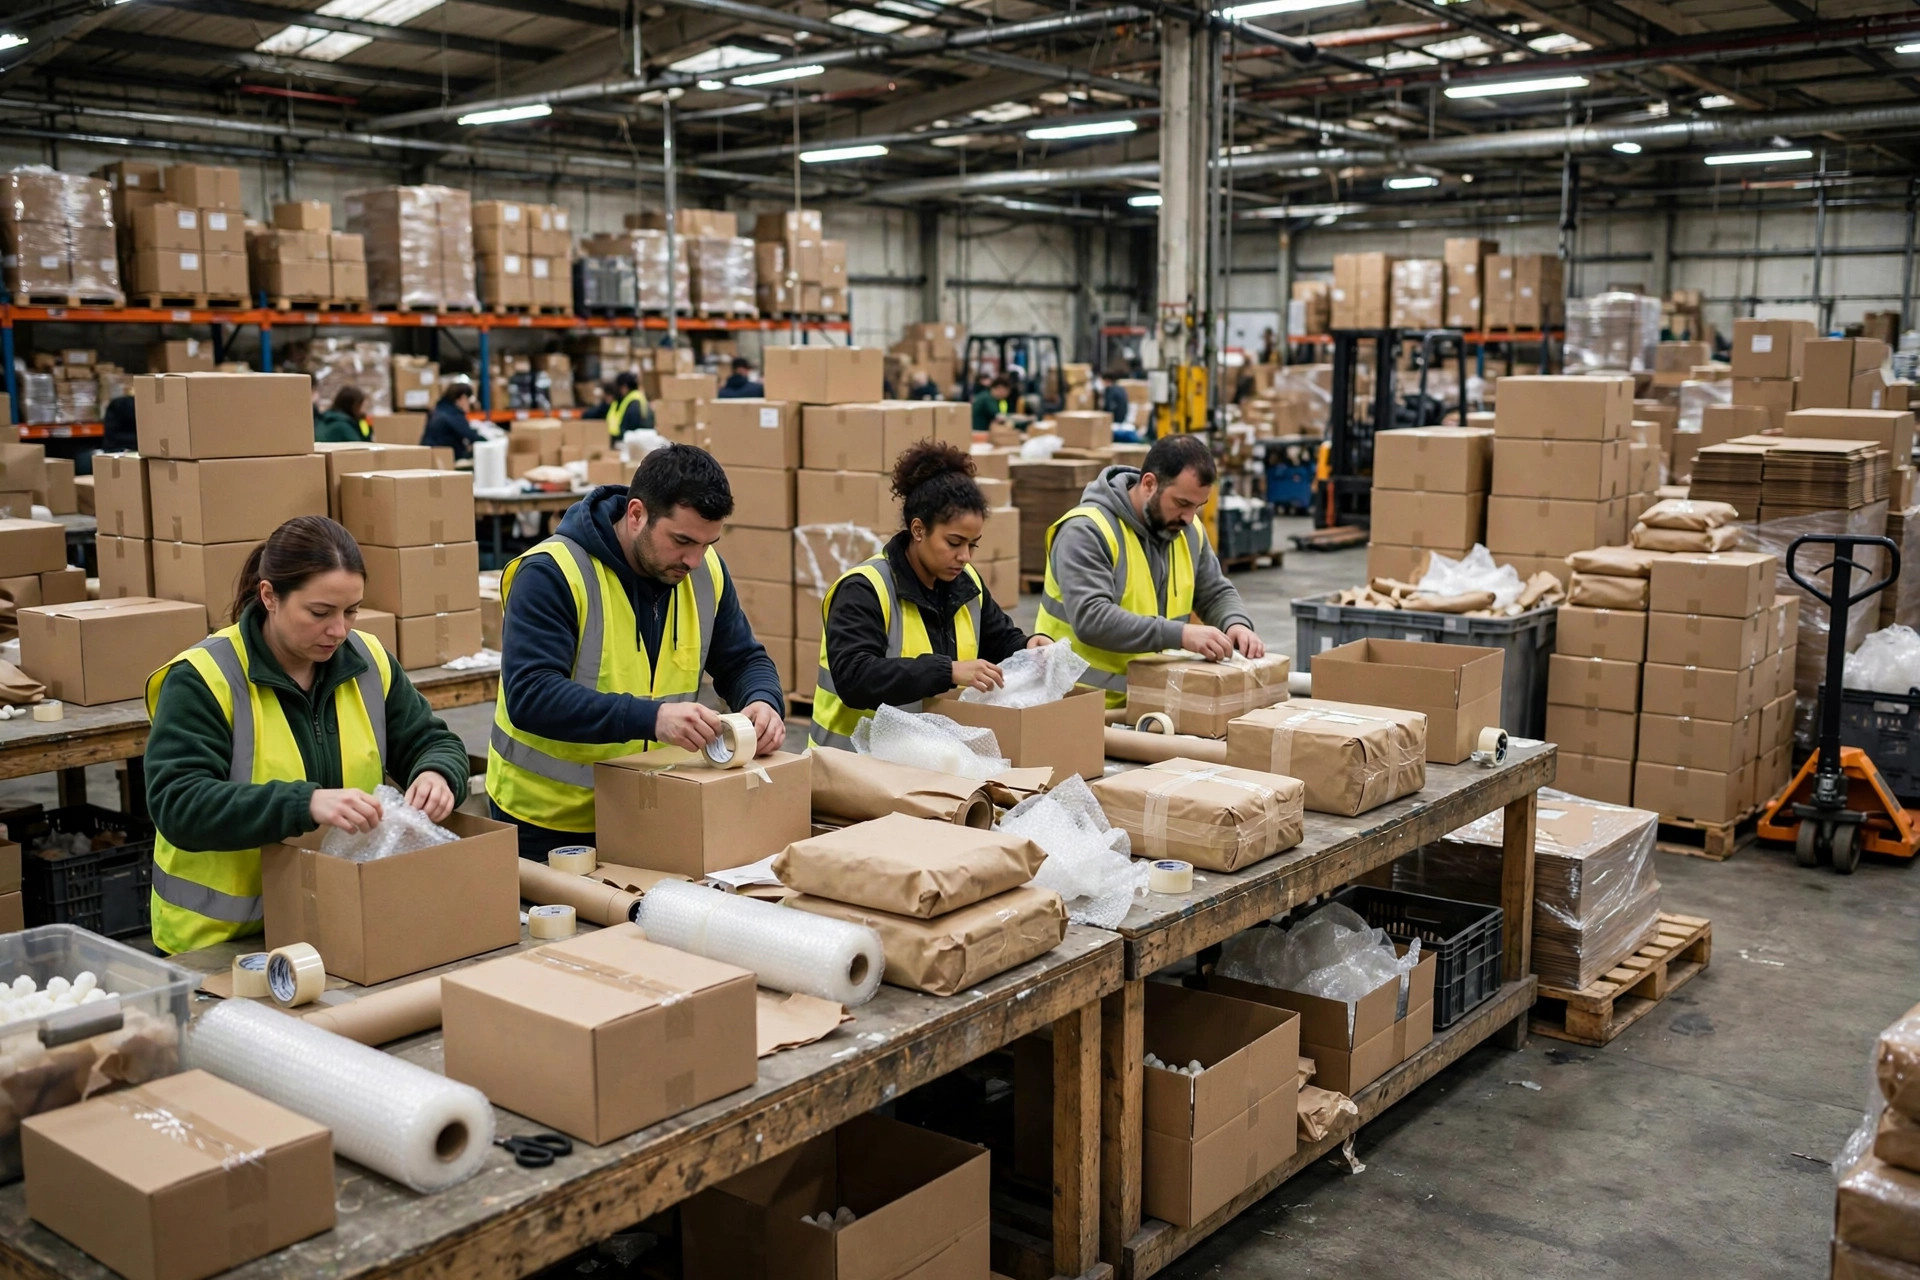
Let me start with something I watched happen. Nine days after a major promotion in 2024, a returns warehouse for apparel in East China was quiet in the morning and gridlocked by noon. Trucks queued at the gate. The supervisor borrowed 12 people from the forward warehouse. By day three the forward warehouse was drowning in its own orders, and both sides were furious. Think of it this way: ai returns forecasting reverse logistics warehouse exists to kill exactly this pattern — finding out how many people you need only when the trucks are already at the door.
Returns volume is not a mystery. It follows sales, with a lag and a shape, like water in a pipe. Open the valve wide at one end and the level rises at the other end a while later. Yet many warehouses still staff today based on yesterday's arrivals. That is driving by the rear-view mirror. It works, right up until it doesn't.
The lag: read the curve before you staff it
A return trip has three legs: the buyer receives the goods, the buyer decides to send them back, and the carrier delivers them to your dock. Each leg takes its own number of days, and the gaps between categories are wide.
Apparel gets tried on and decided on quickly, so its peak arrives fast and sharp. Bulky home goods need a pickup appointment, so the peak is lower, longer, and has a long tail. Electronics pass through inspection and platform review, which flattens the curve but makes each unit heavier in labour minutes.
In 2023 I helped a footwear and apparel warehouse in South China review its data. Its outbound peak landed on a Monday. Its returns arrival peak landed reliably about a week later, give or take a few days by channel. The supervisor used to add returns staff on the outbound peak day itself. People stood idle for days, and by the time the real returns peak arrived, the overtime budget was already spent. It was never a headcount problem. It was a calendar problem.
Here is the counterintuitive part. The height of a returns peak is usually set less by the return rate than by how concentrated the promotion was. Goods sold in a steady stream come back in a steady stream. Goods blasted out in a three-day promotion come back as a single lump. Staff to the average return rate and the peak will teach you a lesson.
ai returns forecasting reverse logistics warehouse runs on three inputs
Do not over-mystify the model. It eats three kinds of input, and if one is missing, the forecast limps.
The first is sales volume, split by day, by category, and by channel. Totals are useless. Ten thousand units of apparel and ten thousand units of books produce completely different returns curves.
The second is category return rate, calculated from your own warehouse's actual history on a rolling basis. Never copy an industry average. Another operator's buyers do not behave like yours, and return rates around a promotion are not the same animal as return rates in a quiet month.
The third is channel and campaign markers: which channel is promoting, how deep the discount is, whether orders were pre-sales, and whether return shipping is free. Pre-sold goods are signed for later, so their returns peak shifts later too. Free return shipping changes both timing and volume.
| Input | Required granularity | Classic failure |
|---|---|---|
| Sales volume | Day × category × channel | Totals only, curve completely wrong |
| Category return rate | Rolling, from your own history | Copied industry average, fails at every promotion |
| Channel / campaign markers | Promotion, pre-sale, free returns | Campaign data never reaches the system, peak appears from nowhere |
It is like choosing fuel for an engine. Higher grade is not automatically better. It has to match the machine. Feed the right inputs and a modest model will give you a usable magnitude. Feed the wrong ones and an expensive model just produces errors faster.
When the forecast is wrong: the fallback roster is the real skill
I will say it plainly: the forecast will be wrong sometimes. A campaign gets extended, weather blocks a highway, a platform changes a rule, and the curve bends. Anyone who staffs once and expects to be right every time will be hurt by that word "once."
The fallback method we set up for returns operations has three layers.
Layer one is a fixed core team, staffed to the low end of the forecast. Inspection and system processing need experienced hands and must never be empty. A borrowed novice can move cartons, but cannot judge whether a returned item can go back on sale.
Layer two is a warned flex pool. Based on the mid and high ends of the forecast, you agree in advance with your labour provider and the forward warehouse how many people might be needed on which days, and you confirm three days ahead. No same-day raids. In autumn 2024, a mixed-goods warehouse in North China used this approach. Its post-promotion returns peak came in well above forecast, but because the flex pool had been warned, the extra hands arrived within two days and the dock never blocked.
Layer three is deliberate staggering. Arrived does not mean must be processed today. Grade the backlog by rule: high-value items bound for resale get inspected first; low-value items heading straight to disposition can wait a day or two. Trading a little dwell time for a flatter labour curve is, most of the time, a good trade.
A hypothetical example to feel the magnitude: suppose the forecast says 8,000 returned units will arrive on a given day, and suppose, purely as a hypothetical example, one worker processes 400 units a day. You need 20 people. If 11,000 units actually arrive, your gap is seven or eight people. Knowing which day that gap lands on, a week ahead, makes borrowing, rest-day swaps, and overtime all manageable. Learning it that morning leaves you one option: a blocked dock. Use your own measured throughput for real planning.
ai returns forecasting reverse logistics warehouse versus the forward warehouse
Every combined site knows this fight. Forward operations say outbound orders are revenue. Returns operations say unprocessed returns block refunds and resale. Both are right, which is why shouting settles nothing. You have to do the maths.
Use one common ruler: the cost of one day of delay on each side. Forward delay costs you lead-time penalties and cancellations. Returns delay costs you refund speed, recovered inventory, and sellable stock coming back into availability. Convert both sides to the same unit and the borrowing decision — how many people, for how many days — can be made on the spot, not by whoever argues loudest.
For a pilot, do not roll this out across the whole building. Pick one category and one channel and run one full promotion cycle. Judge it on four metrics only: whether forecast versus actual arrivals stayed inside the tolerance band you set; whether roster changes could be confirmed at least three days ahead; whether the dock stayed clear on peak days; and whether borrowing conflicts with the forward warehouse went down. Hit three of the four and expand. Hit none and audit your input data before you blame the model — in my experience the feed is wrong far more often than the maths.
And is it worth the money? I never judge by the pretty curves in a vendor demo. Whether this spend is worth it comes down to one number: average overtime hours per person during peak week. If forecasting works, the peak is still the peak, but planned staffing flattens the overtime, people stop working brutal consecutive nights, and the premium for emergency labour disappears. If that one number does not fall, everything else is theatre — and theatre is a pseudo-requirement I have no patience for.
One last bucket of cold water. If your outbound data cannot even be reconciled by day, do not touch forecasting yet. Connect the data pipes first. Building on a bad foundation does not fail slowly. It fails all at once.
By Da Liu, Automation Engineer