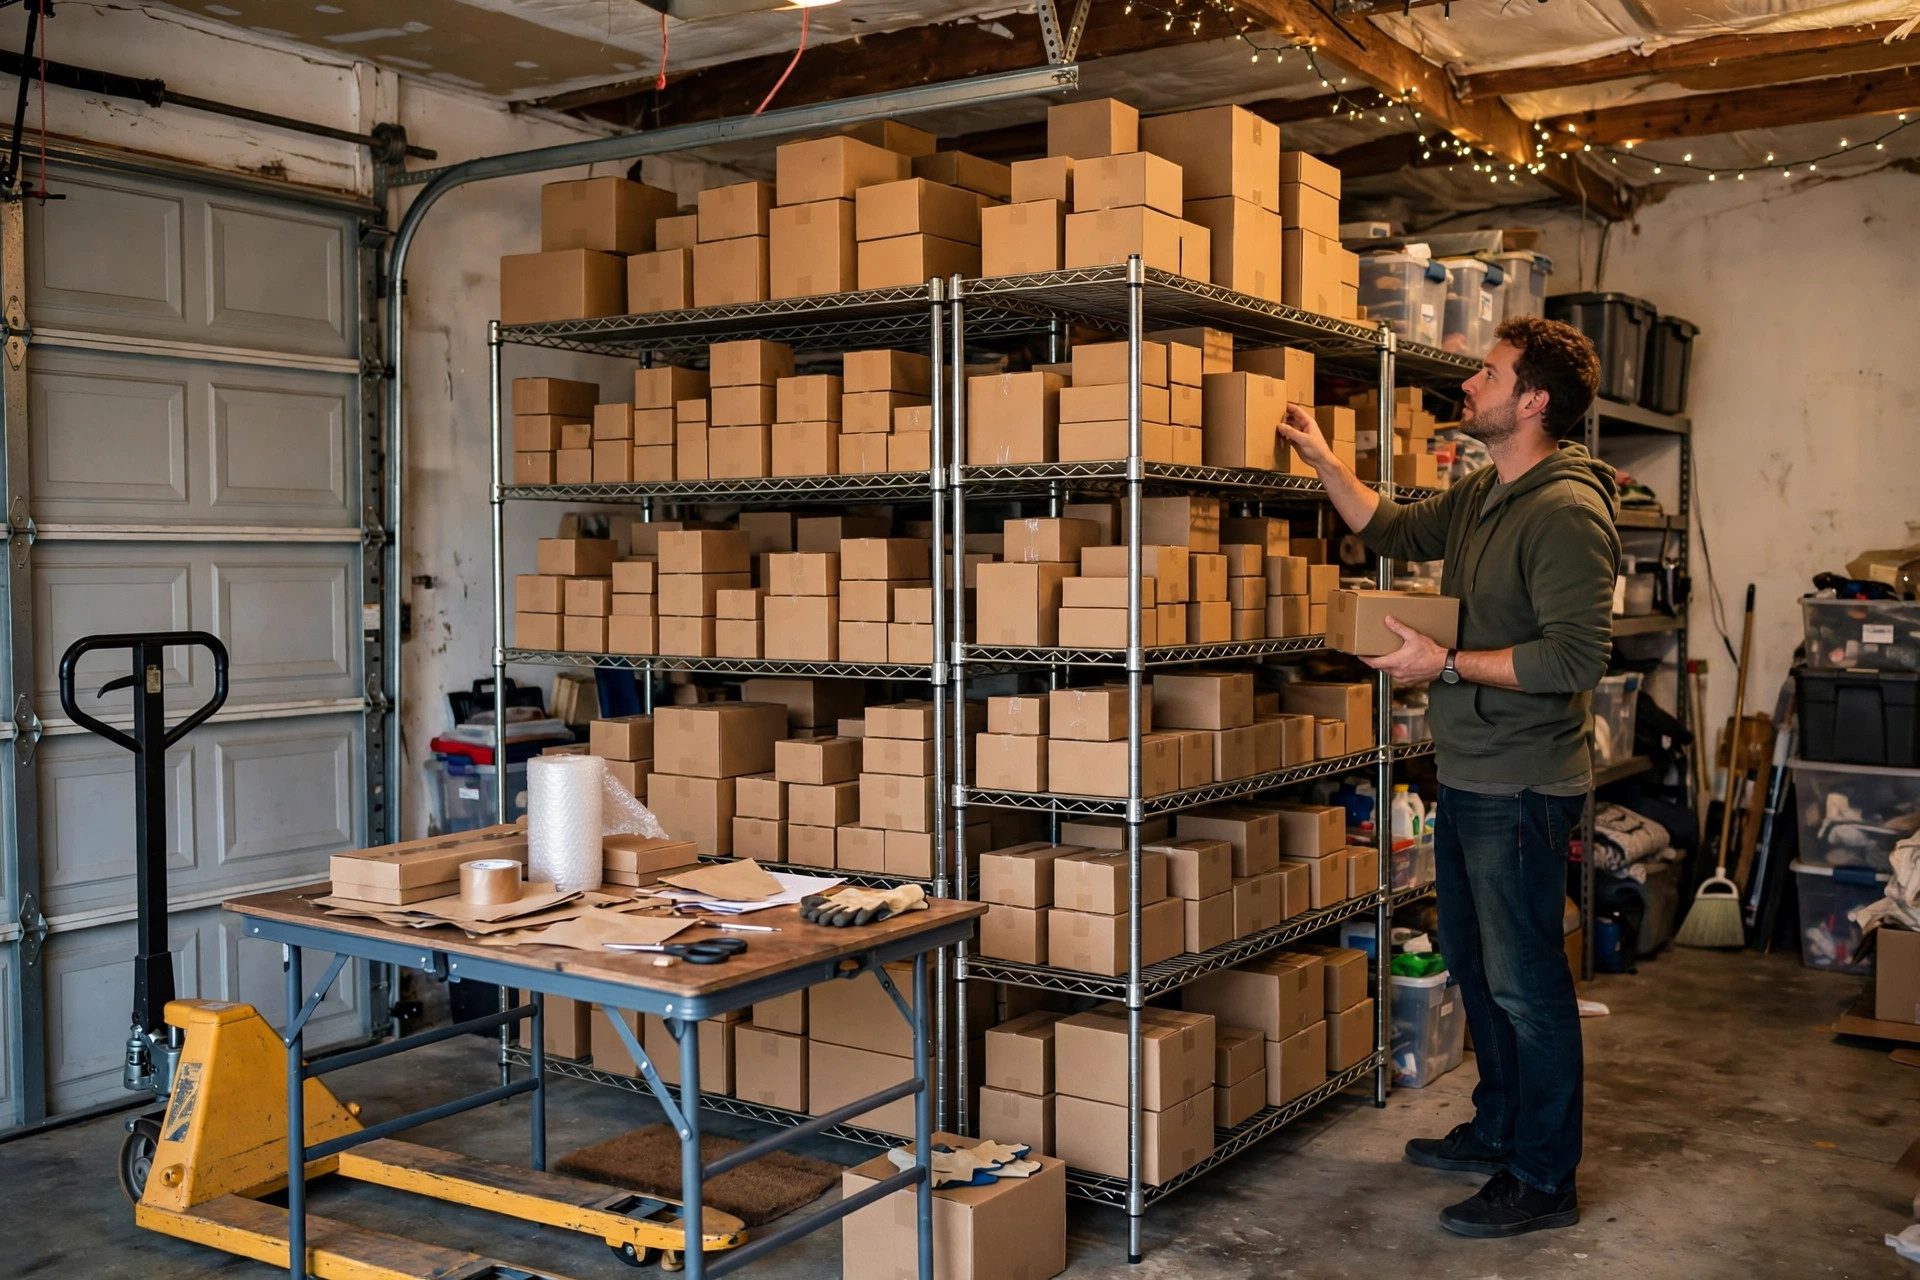
Our warehouse is small: about 3,000 square meters, six people including me. That experience taught me more about AI forecast data quality than any vendor demo ever did. Last year I finally bought a forecasting tool, hoping I could stop guessing how much stock to hold. The first month humbled me fast. The system said a popular water bottle would sell more than 400 units the following week, so I stocked up. We sold fewer than 100. The extra stock sat on shelves for weeks, and the cash tied up in it was cash I could not use for anything else. My first instinct was to blame the model and argue with the vendor. Then a friend who works with data spent half an hour looking at our inbound and outbound records and told me the truth: the model was not the main problem. Our data was a mess.
We cannot afford to burn money the way a big company can. A large operation hires a data team and cleans things up over months. We have six people, and every hour spent fixing records is an hour not spent picking, packing, or shipping. So the methods we ended up using are embarrassingly simple: filter a spreadsheet, check records against courier bills by hand, and write one rule to block each recurring mistake. Simple works, though, because a forecast is only as good as what you feed it. Feed it garbage and you get expensive garbage back.
AI forecast data quality killer one: duplicate codes and missing records
Duplicate codes hit us first. The same product ends up with two or three codes, and the system treats each code as a different item. Last September, one of our insulated bottles changed packaging, and purchasing created a new code without retiring the old one. Online orders ran under the new code, offline orders under the old one, and each code looked like a slow seller on its own. The forecast stayed low until a big promotion arrived, when we suddenly discovered the combined stock was already well above our safety level. We had overstocked by a few thousand dollars' worth of bottles that then took weeks to clear.
Missing records are the opposite failure, and they hurt just as much. For a while we entered outbound shipments by hand, and on busy days entries got skipped. The sales curve the system saw was full of gaps, and a missing day looked exactly like a day with no sales. Forecasts dropped, and our best sellers ran out. The fix was dull but effective: every Friday afternoon I spend about an hour matching that week's outbound records against courier invoices, and anything missing gets filled in. We also made a house rule that same-day orders are closed out the same day, and anything left overnight is reconciled first thing the next morning. Two months of that routine brought the gaps down to a level I could live with.
AI forecast data quality killers: promotions, mixed channels, and wrong time buckets
The other three killers are sneakier, and they cost more. Abnormal promotions can drag a forecast into fantasyland. Last year a three-day buy-one-get-one offer pushed one sock style to more than five times its normal daily sales. The system treated those three days as normal demand and kept recommending heavy restocking for a month afterward. Now we tag every promotion, clearance, and livestream event separately, and we exclude those days from everyday forecasts or model them as their own category. A promotion is a promotion. Everyday demand is everyday demand. Mix them together and no model can save you.
Mixed channels cause the same confusion in a different way. Our online and offline rhythms have almost nothing in common. Online sales spike with campaigns, while offline sales come from a handful of nearby shops ordering steadily. When both streams were lumped into one total, the forecast number suited nobody. Now we record them separately and forecast them separately, adding them up only when we need a combined view. It takes a little more discipline, but every number can be traced back to a real person or order.
Wrong time buckets are the easiest to overlook. For a time our tool produced weekly forecasts while we restocked daily, so a week that looked fine on Monday could run dry by Thursday. The reverse is just as bad: daily forecasts do not help when a purchasing agreement is negotiated monthly. My rule now is to set the restocking rhythm first and then choose the forecast bucket to match it. Daily restocking gets daily forecasts; monthly purchasing gets a monthly roll-up. If the bucket does not match the decision, even a good model is useless.
Five ways dirty data kills a forecast, and what each fix costs
| Dirty-data problem | What you see on the floor | How to check it | Fix cost |
|---|---|---|---|
| Duplicate codes | One product's sales split across several codes | Search by product name and barcode for repeats | Low: one cleanup plus a rule for new codes |
| Missing records | Unexplained gaps in the sales curve | Match outbound records against courier invoices | Low: about an hour of reconciliation a week |
| Abnormal promotions | Forecasts stay inflated long after a sale ends | Tag promotion days and exclude them from baseline demand | Low: change the calculation, not the tool |
| Mixed channels | One forecast number that fits neither channel | Record online and offline sales separately | Medium: requires a change in daily habits |
| Wrong time buckets | A weekly forecast that cannot guide daily restocking | Set the restocking rhythm first, then the forecast bucket | Low: change the output format |
Here is the counterintuitive part, and it is the point I most want other small operators to hear: cleaning data is far cheaper than upgrading a model, and it often helps more. When we asked about a model upgrade, the extra annual cost ran into the thousands of dollars, with no guarantee of better results. Cleaning up the five problems above cost us almost nothing in money, just a few hours a week of staff time. There is a sharper twist, too. The more expensive the model, the more confidently it gets dirty data wrong. A cheap model fed clean data gives you a usable number. An expensive model fed dirty data gives you a wrong number dressed up as precision. For a small warehouse, that return-on-investment calculation has to come before any upgrade decision, not after.
After roughly two months of cleanup, the change was not a dramatic accuracy chart I could frame on the wall. It was something more practical: I started trusting the recommendations enough to actually place orders from them. Stockouts on best sellers became noticeably less frequent, and slow stock stopped quietly eating shelf space. I will not quote a precise accuracy improvement, because our records before cleanup were too unreliable to support one, and inventing a number would repeat exactly the mistake this article warns about. The honest measure is whether the forecast is usable, and ours finally became usable.
If you run a warehouse our size, here is the routine I would copy. Before creating a new code, search for an old code already covering that product, and require a confirmation step before retiring one. Close out shipments the same day, and reconcile against courier bills on a fixed day each week. Tag promotion days before the promotion starts, not after. Keep online and offline records apart, and let your restocking rhythm set your forecast bucket. Do not try to fix everything in one heroic weekend, either. Our first full cleanup took close to two weeks, and everything since has been small weekly maintenance. Dirty data accumulates daily, so cleaning has to be a daily habit, not an annual event. Put it on the roster next to stock counts and replenishment, at the same level of importance.
Small warehouses have their own way of surviving. We do not outspend big companies or outstaff them. We win by keeping our data clean enough that a modest tool can do honest work for us. Get the data right first, and only then argue about whether the model is good enough.
By Xiao Ma, Small Warehouse Owner