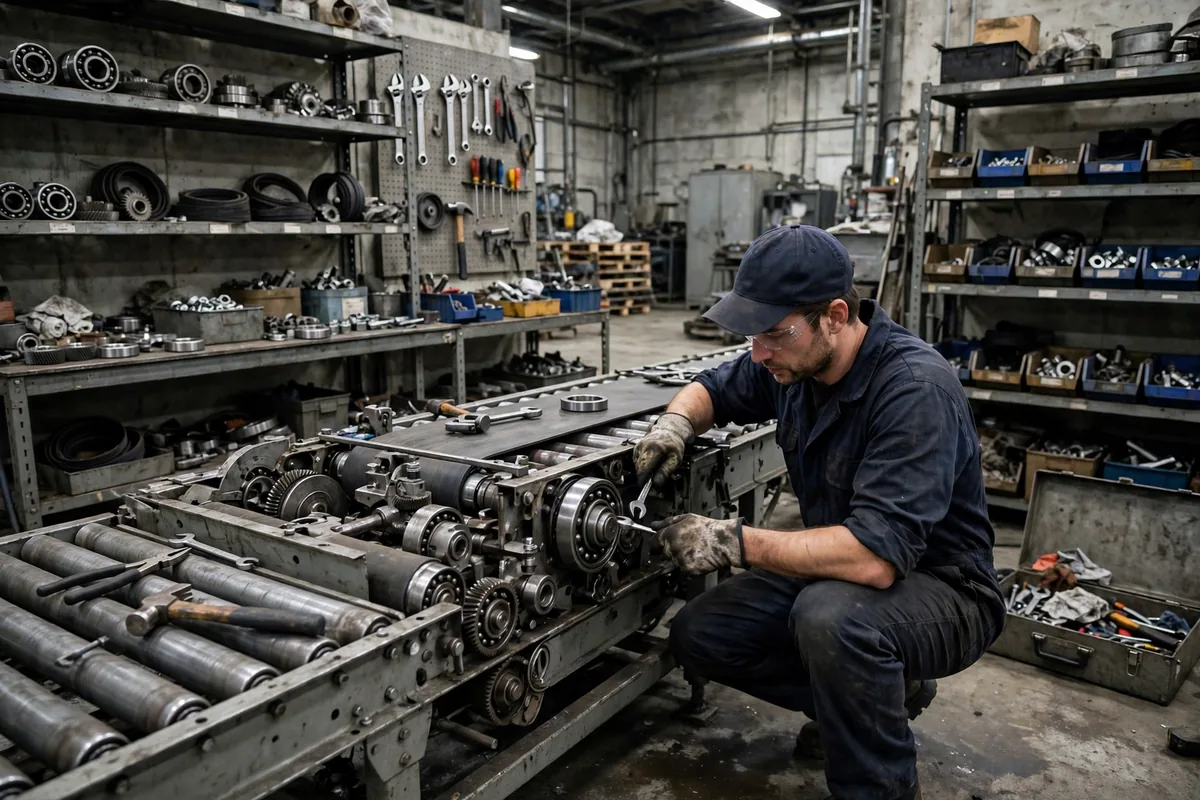
Spare parts management sits at the edge of most warehousing conversations. People discuss automation, system selection and labour productivity at length, and rarely give replacement components a chapter of their own, until a line stops and a single missing component becomes the most important object in the building. A sortation line stands idle, operators wait beside it, order cut-off times approach, and a manager phones a supplier to ask about stock and shipping times.
According to Aberdeen Research, unplanned downtime in manufacturing costs an average of about $260,000 per hour. Siemens' True Cost of Downtime 2024 report puts the annual loss for Fortune Global 500 companies at roughly $1.4 trillion, with automotive plants reaching $2.3 million per hour. A warehouse rarely matches an automotive plant on hourly cost, yet half a day of stopped lines still means backlogged orders, overtime and customer claims, a loss no repair bill can measure.
What a Spare Parts Stockout Really Costs
The price of a component and the loss its absence causes often sit in different orders of magnitude. A sensor worth a few dozen dollars, a belt or a drive wheel can stop a conveyor line worth several million. Industry benchmarks from APQC and the Institute for Supply Management put MRO inventory at roughly 40 to 50 percent of the total maintenance budget, with the annual carrying cost of that stock at 20 to 30 percent of its value, which means stocking is itself expensive: every item on the shelf carries an annual charge for capital, space, insurance and obsolescence risk. Industry surveys also report that 15 to 25 percent of MRO stock is obsolete or surplus, so many warehouses carry both losses at once.
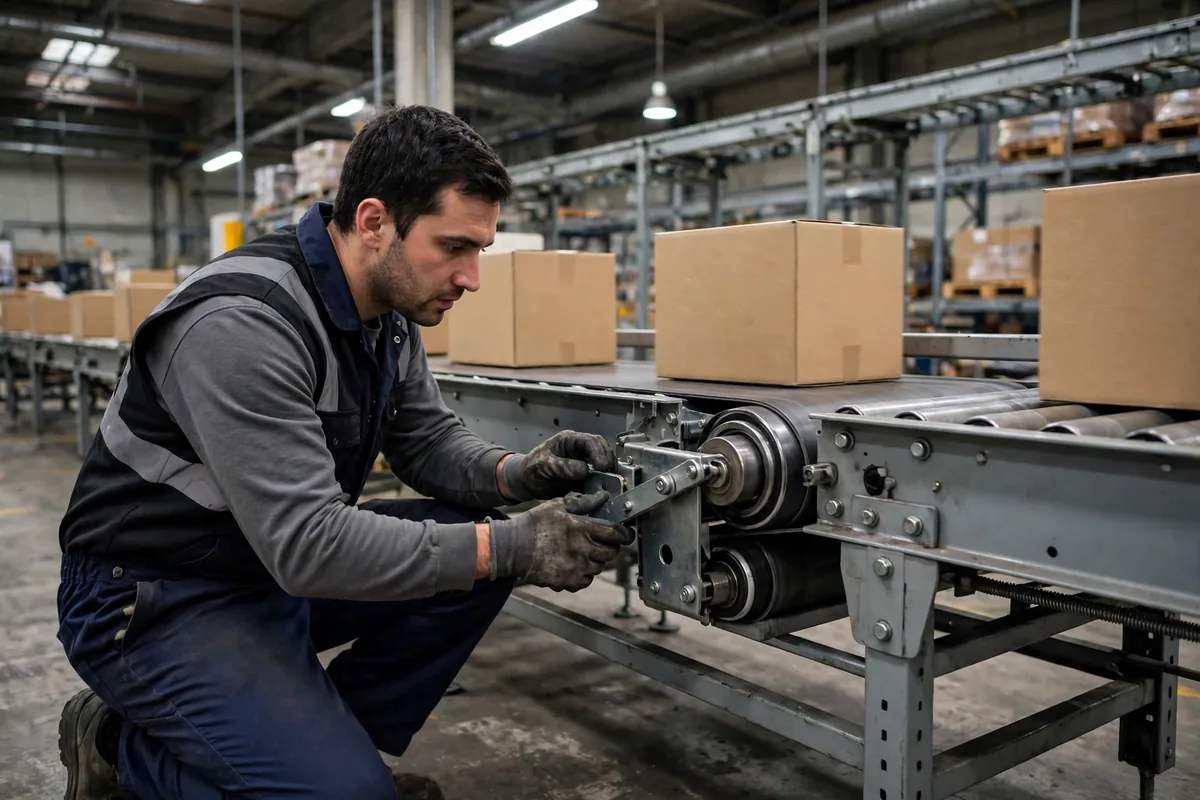
The following worked example illustrates the scale of that mismatch, and all of its figures are an illustrative example, offered to show the method rather than drawn from a real company. Consider an e-commerce warehouse processing 20,000 orders a day, where a sortation line stops for 4.5 hours because a drive wheel has failed. About 6,000 orders pile up during the stoppage, 12 people work 3 hours of overtime to clear the backlog, and roughly 400 orders miss the cut-off and move to the next day. The drive wheel itself costs an assumed $110, expedited air freight an assumed $210, while idle labour, overtime and late-delivery compensation together come to an assumed $5,800. The ratio of part price to stoppage loss is close to 1 to 18, and while the ratio moves with stoppage length and order density, the direction is stable: the cost of a stockout concentrates in time and fulfilment, not in the component.
A second illustrative example comes from a different time structure. An automotive components warehouse in northern China finds on a Friday night that a control board in an automated storage crane has failed, and no board of the same model is held on site. The nearest supplier stock needs two working days to arrive, so over the weekend the crane operates at about 40 percent of outbound capacity through manual picking, and Monday morning brings another half day of clearing the backlog. What matters here is not the failure itself but the calendar around it: the fault arrived on a Friday night, the supplier response crossed a weekend, and the stocking decision made months earlier had already fixed the length of the stoppage. Managing spare parts is, to a large extent, managing time structures, and the overlap between lead times, supplier response, maintenance windows and peak order periods decides whether a stockout is a two-hour interruption or a two-day incident.
Spare Parts Classification: Criticality Before Quantity
Stocking every component under the same rule is the most common error in this field, and the remedy is to classify by criticality before setting any stock level. The widely used ABC method groups items by annual consumption value: class A covers roughly 10 to 20 percent of item numbers and 70 to 80 percent of annual consumption value, class B about 30 percent of items and 15 to 20 percent of value, and class C about 50 percent of items and only about 5 percent of value. Value alone is not enough, so a second dimension is needed. A vital item stops production or creates a safety risk when it fails, an essential item causes disruption that a short workaround can absorb, and a desirable item has little or no immediate effect. Only when the two dimensions are crossed does the decision become clear.
| Class | Profile | Stocking rule |
|---|---|---|
| A, vital | High value, stops the line, long lead time | Hold 1 to 2 units, set safety stock, sign a standby agreement with the supplier, count regularly |
| B, essential | Medium value, workaround exists or short wait tolerable | Set reorder points from usage history and lead time, review quarterly |
| C, desirable | Low value, high volume, widely interchangeable | Buy in bulk, manage with simple min-max rules, review annually |
| Obsolete | No consumption for over 12 months and no equipment in use | Keep on a separate list, assess transfer, resale or disposal |
Management attention should concentrate on a small number of vital items rather than spread evenly across thousands of item numbers. Benchmarks from the Society for Maintenance and Reliability Professionals show that top-quartile facilities hold MRO stock worth no more than 1.5 percent of replacement asset value, so a well-controlled storeroom wins on structure rather than scale. Reliable Plant also reports that emergency purchases typically carry a 20 to 40 percent premium over planned procurement, so buying after a stockout costs both time and money.
From Reactive Replenishment to Risk-Based Stocking
The practice is moving, slowly but visibly, in a direction driven by three forces. The first is the growing availability of equipment data. More warehouses now record failure history, mean time between failures and repair times for each machine, and those records turn demand for replacement components from a matter of judgement into something that can be calculated: a motor bearing replaced on average every 14 months, a sensor model that fails mostly in hot seasons, a belt whose wear tracks daily throughput. With such records, a reorder point follows a simple formula, average daily usage multiplied by lead time in days, plus safety stock, with real data behind every input.
The second force is change in the supply chain itself. Faster model turnover, supplier consolidation and longer overseas lead times all raise the stockout risk for vital items. Once a machine goes out of production, supply of its dedicated components often lasts only a limited number of years, and a warehouse has to decide before the machine retires whether to hold its last few vital components, a judgement that weighs remaining machine life and the arrival of a replacement machine. The third force is the spread of management tools: as maintenance systems and warehouse management systems share data, issue records, work orders and stock levels appear on the same view.
The counterintuitive judgement sits exactly here: holding fewer spare parts does not necessarily mean better management, and holding more does not necessarily mean greater safety. What decides the quality of a storeroom is how closely its structure matches the risk structure of the equipment it supports. A storeroom can hold two errors at once, a control board worth tens of thousands of dollars held as a single unit with no standby supplier, and shelves of obsolete parts for models retired years ago. Cutting stock by total value alone risks cutting vital items along with the dead stock, while adding stock by stockout count alone risks piling up more of what never moves. A better test is whether every item on the shelf can answer three questions: which risk it guards against, what guarding that risk costs, and how likely the risk is. Stock that cannot answer deserves a second look.
For a warehouse manager, a workable starting point needs no large investment. List the vital components of the equipment in use, and note the lead time and alternative source for each one. Read the last two years of maintenance records to see which components actually stopped a line and which ones never moved. Adjust stocking rules using the classification table above, and review them every quarter. The effect will not show in a week; it will show at the next equipment failure, in the difference between a two-hour routine repair and half a day of explaining a stoppage to customers. A longer question remains open: as warehouses automate further and machines become more tightly coupled, will a single missing component stop a wider area than it does today, and should the management of spares move from a warehouse function into the equipment purchasing decision itself? The answer may only become clear in the next equipment renewal cycle.
By Dr. Chen, Supply Chain Researcher