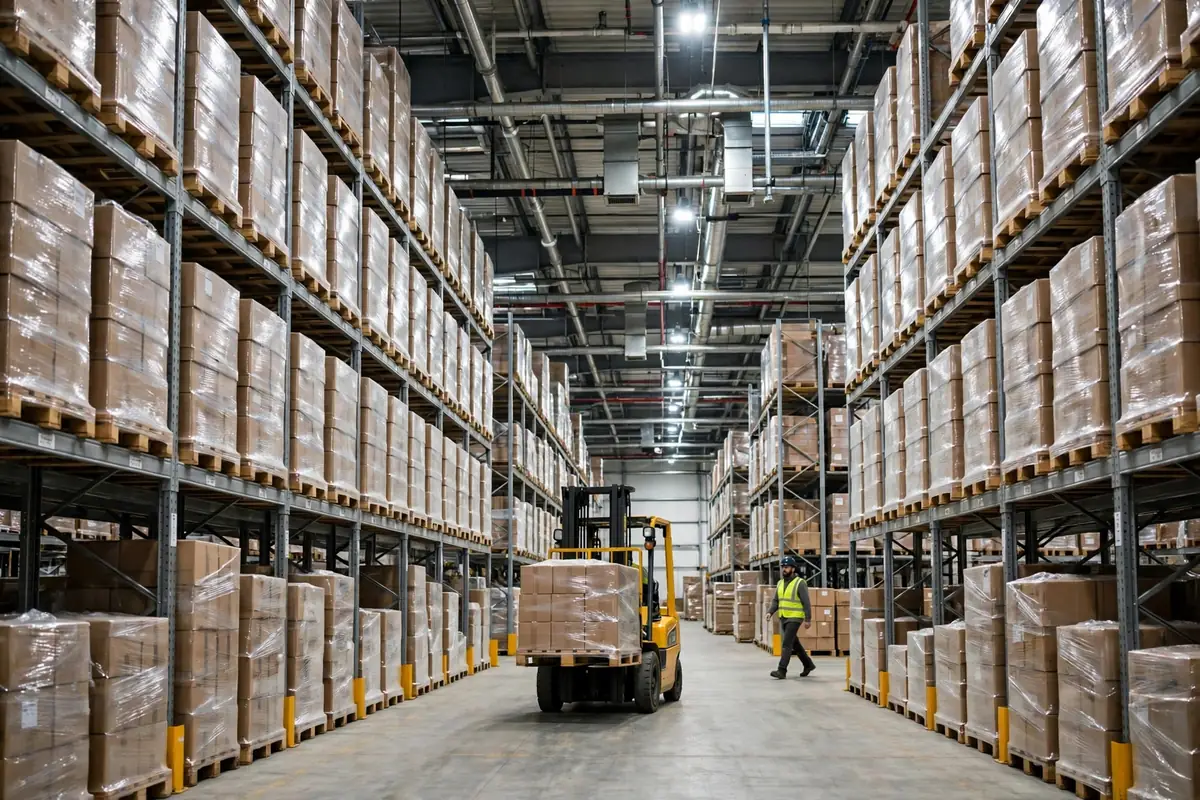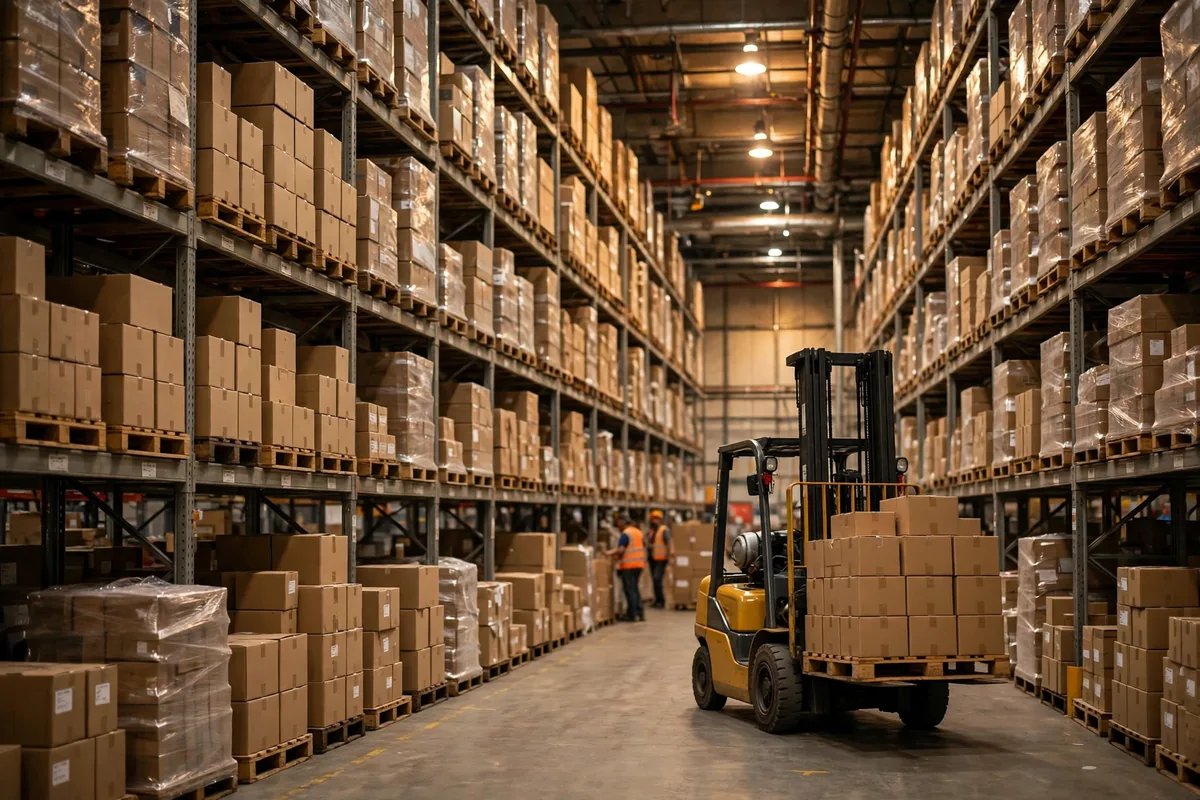
Warehouse inventory carrying cost is the first number I want on the table, because everything else in this article is decoration. Illustrative example: a phone-accessories distributor holds $800,000 of stock on average, at an 18% gross margin. Warehouse inventory carrying cost commonly runs 20% to 30% of inventory value per year, so at the 25% midpoint, that stock costs $200,000 a year just to sit there. Sell it and the gross profit is $144,000. Leave it on the shelf and the holding bill is $200,000. The goods have not earned a cent, and you are already paying to keep them. Most owners I meet have never added this number up in full. The warehouse manager watches capacity. Finance watches the inventory line on the balance sheet. Nobody owns the fact that stock burns money while it waits.
Warehouse Inventory Carrying Cost Has Five Parts
Warehouse inventory carrying cost is not one bill. It is five, and each one can be priced separately.
The first is capital cost, and it is the biggest. Stock is bought with real money, and money parked in goods cannot repay a loan, buy the next order, or cover payroll. Common component benchmarks put capital cost at roughly 10% to 15% of inventory value. It never shows up as an invoice and never passes through expenses, which is exactly why it gets ignored.
The second is storage cost, roughly 5% to 10%: rent, utilities, racking depreciation, forklifts, and labor, allocated across every pallet position. More stock means more positions, and the bill grows with it. I have seen warehouses lease extra space because they were "out of room," then discover half the new floor was holding stock that had not moved in six months.
The third is insurance and taxes, roughly 1% to 3%. Warehouse insurance, cargo cover, property tax — the exact treatment varies by jurisdiction, so check the latest official policy for your location. Small on its own, but it scales with stock value.
The fourth is shrinkage and damage, roughly 2% to 8%. Breakage, loss, picking errors, expired goods, packaging wear. Electronics hate humidity, food expires, apparel goes out of season. Measure it from your own cycle counts, not from a textbook.
The fifth is obsolescence. A phone case is worth half its price three months after the new model ships. Seasonal goods go on clearance the week the season ends. There is no fixed percentage for obsolescence, and it is often the most painful line of the five. Add the five together and you land in the commonly cited 20% to 30% annual range — a benchmark repeated across APQC-based reporting and multiple industry guides, not a number anyone invented in a spreadsheet.
Illustrative example: an auto-parts distributor in eastern China found $120,000 of stock that had not moved in over a year at its early-2025 count, half of it parts for discontinued models. At a 25% carrying rate, that dead stock burned $30,000 a year — about the annual pay of two warehouse staff — while occupying more than 300 pallet positions and forcing fast-moving goods into the aisles. The owner's words were simple: the money was wasted, and nobody had ever shown him the bill.
How to Calculate Your Warehouse Inventory Carrying Cost Rate
No gut feel. Use the formula: carrying cost rate equals total annual holding cost divided by average inventory value, times 100. Three steps.
Step one, fix average inventory value. Average the opening and closing stock values; for seasonal businesses, average all twelve month-end values instead. A single month's figure lies — pre-season build-up is not representative of the year.
Step two, add up the five parts. Capital cost at your real borrowing rate or internal cost of capital — check the latest official policy for current rates. Storage from rent, labor, and equipment depreciation. Insurance from the policy. Shrinkage from last year's count variances. Obsolescence from write-downs on slow stock. Every line needs a source. A guessed percentage does not count.
Step three, divide and compare with the 20% to 30% band. Below 20% is not automatically good; it can mean chronic stockouts and lost sales. Above 30%, find out which component is over the line.
Illustrative example: a home-goods warehouse with $500,000 average inventory value and $125,000 total annual holding cost — $60,000 capital, $35,000 storage, $10,000 insurance, $20,000 shrinkage and obsolescence. Divide $125,000 by $500,000 and the rate is 25%, right in the middle of the band. The rate says the total is normal. The structure says where the money goes: $12,000 of that $20,000 was last season's lines sold at clearance. The rate tells you the level; the breakdown tells you the leak.
| Cost component | Annual amount (illustrative) | Share of stock value | | Capital cost | $60,000 | 12% | | Storage cost | $35,000 | 7% | | Insurance and taxes | $10,000 | 2% | | Shrinkage and obsolescence | $20,000 | 4% | | Total | $125,000 | 25% |
Three Levers That Actually Cut Warehouse Inventory Carrying Cost
Once the bill is on the table, there are exactly three levers worth pulling. The rest is theater.
Lever one is turnover. Every ten days cut from stock cover pulls average inventory value down hard. Shorten replenishment cycles on fast movers — weekly instead of monthly — and order to real demand, not to the supplier's minimum order quantity. Illustrative example: a small-appliance warehouse in southern China moved 40 fast movers from a 30-day to a 14-day cycle. Average stock value fell from $420,000 to $310,000, cutting the annual holding bill by about $27,000, and stockouts did not rise, because replenishment came more often.
Lever two is ABC classification. A-items drive the sales, so they get the attention. C-items fill the racks and barely sell, so they get cut. The common failure is the reverse: A-items chased by hand when they run out, C-items piled up untouched. Classify, then clear the slow C-items and cap their maximum stock — no new orders once the cap is hit.
Lever three is dead-stock clearance. Anything unmoved for 180 days goes on discount first, then bundles, then write-off, in that order. Here is the counterintuitive part: losing 20% on a clearance sale is cheaper than holding the goods, because holding costs another 20% to 30% every year. A clearance loss happens once. A holding loss renews annually. Plenty of owners refuse the discount and end up with goods worth less every year, sitting on positions the fast movers need.
One trap to avoid: lower is not always better. Push the carrying rate below 15% and the cost of stockouts usually outweighs the holding cost saved. The goal is not zero inventory. The goal is that every dollar tied up in stock is matched to real sales. Before cutting stock, price the cost of a stockout too, and compare the two sides before moving.
Do the calculation yourself before you leave this page: add up your five holding costs for the past year, divide by average inventory value, and you have your carrying rate. Then pull out the value of everything unmoved for 180 days, multiply by that rate, and you have the real money your dead stock burns each year. Two numbers, and the decisions — what to clear, what to cut — write themselves.
By Lao Zhou, Logistics Cost Analyst