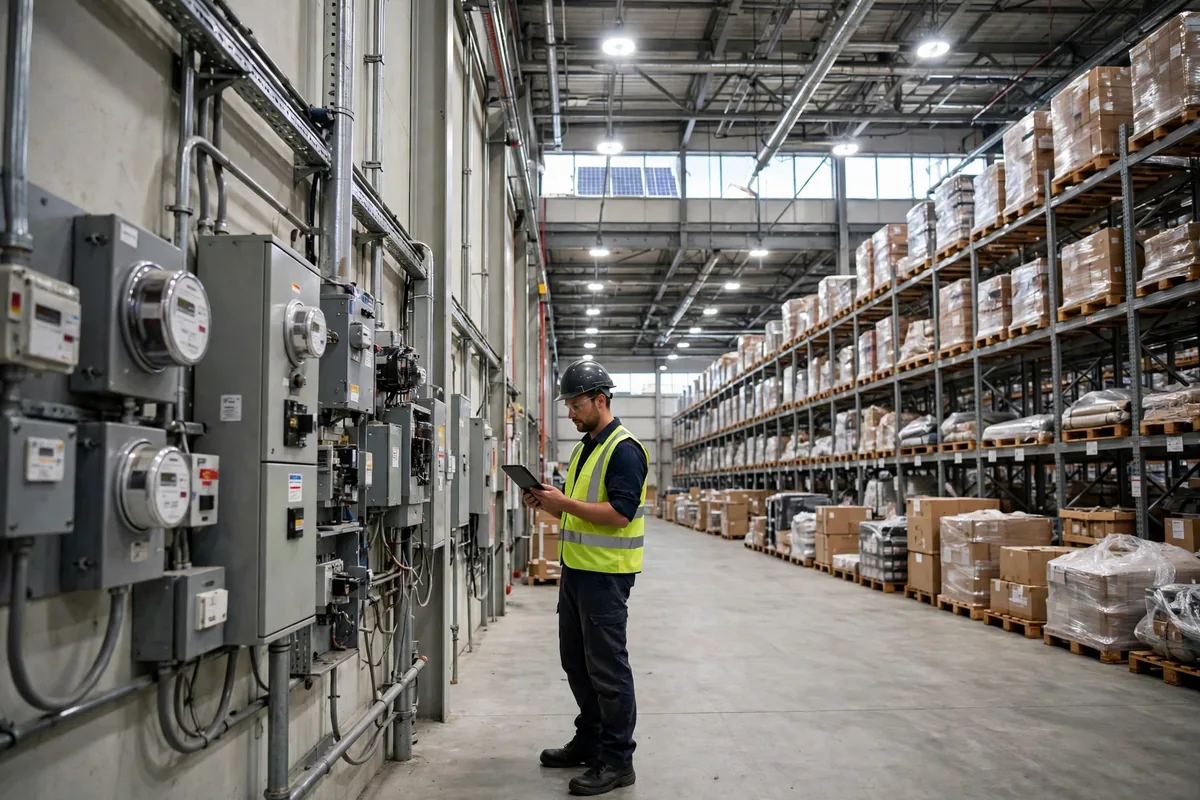
Let me be blunt: a warehouse ESG report is not written. It is counted. Write it beautifully — the moment an auditor asks "where did this number come from" and you cannot answer, the whole document is waste paper. I have seen too many warehouses treat ESG as a marketing brochure: a few rooftop solar photos, a few green icons, and off it goes to the customer and the investor. On audit day, the auditor does not want photos. They want the warehouse ESG reporting data metrics themselves: meter readings, weighbridge tickets, injury logs, and a working paper trail they can recalculate. This cuts two ways: there is the report itself, and there is how your warehouse actually runs. You can hire someone to write the report. Nobody can fabricate the paper trail for you.
Warehouse ESG Reporting: Which Numbers You Actually Owe
Get the list straight first. The warehouse ESG reporting data metrics come down to four groups of numbers. Environmental: electricity and water use, Scope 1, 2, and 3 greenhouse gas emissions, waste generated and recycled, packaging used and recovered. Social: injury rates, recordable incidents, employee turnover, training hours. Governance: compliance events, supplier audit coverage, data security incidents. Every metric needs a stated basis: what the numerator is, what the denominator is, which calendar year it covers, and which warehouses are in scope.
| Metric | Data source | Easiest basis to get wrong |
|---|---|---|
| Electricity (kWh) | Meter readings, utility bills | Copying the dollar amount instead of the kilowatt-hours, or missing a shared sub-meter |
| Scope 1 emissions | Own forklift fuel, boiler gas, refrigerant top-ups | Counting a contractor's fleet fuel, or missing refrigerant leaks |
| Scope 2 emissions | Purchased electricity, steam, heating | Reporting only one method — location-based and market-based both belong in the report |
| Injury rate | HR injury records, OSHA 300 log | Reporting only full-time staff and leaving out temps and contractors |
| Packaging recovery rate | Weighbridge tickets, recycler settlement statements | Using purchase volume as recovered volume, or estimates instead of weighed tickets |
The packaging recovery line is the one worth the most. I have seen more than one warehouse report an 85% recovery rate, only for the auditor to pull three weeks of weighbridge tickets and recycler settlements and recalculate 61%. The missing 24 points were not a rounding error. An operations manager had filled the number in from memory. The auditor downgraded the credibility of the entire report on the spot.
Where the Data Comes From: Meters, the WMS, and the HR System
A warehouse is not short of data. It is short of the person who joins the data together. Electricity lives on the meter and the utility bill, fuel lives on fueling records and the fleet system, throughput lives in the WMS, injuries and hours live in the HR system, waste and packaging live on weighbridge tickets and recycler settlements. Five lines, five systems — and the report is the job of lining all five up on one table.
In 2023 I helped a California 3PL through a major customer's ESG audit, and we fell over on the electricity meter. The 120,000-square-foot building had solar across half its roof, and the Scope 2 number looked excellent. The auditor asked one question: had solar power consumed on site been deducted from purchased electricity? Nobody in the room could answer. Main meter and sub-meters were mixed together, bills settled monthly, and the WMS did not even have an electricity field. The result: a full Scope 2 recalculation, a three-week delay, and a deduction on the customer's annual supplier review.
The lesson is concrete. First, sub-meter by building and major equipment, at minimum so that main meter minus sub-meters reconciles to the bill. Second, record solar consumed on site separately from power exported to the grid — you can only deduct what you actually consumed. Third, keep an evidence chain for every number: raw reading, bill, calculation sheet, all three able to confirm each other. Auditors do not trust you. They trust your evidence chain.
Here is an annual emissions example for a 100,000-square-foot warehouse (illustrative example; emission factors per the latest published grid values):
| Item | Illustrative example | Note |
|---|---|---|
| Annual electricity use | 1.2 million kWh | Lighting, charging, HVAC, per meter readings |
| Scope 2 emissions | ~480 tonnes CO2e | At a grid factor of 0.4 kg per kWh |
| Diesel forklift fuel | 30,000 liters | Scope 1, per actual fueling records |
| Scope 1 emissions | ~80 tonnes CO2e | Diesel factor ~2.68 kg per liter |
| After LED retrofit plus rooftop solar | ~30% annual electricity saving | Must be verified against meter readings before and after — never written into the report in advance |
The point of that example: Scope 1 plus Scope 2 comes to 560 tonnes, which looks substantial — but for a 3PL, the real volume sits in Scope 3. The GHG Protocol splits emissions into three scopes. Scope 1 is what you burn yourself. Scope 2 is the electricity, steam, and heating you buy. Scope 3 is everything up and down the value chain — inbound freight, customer pickups, employee commuting, purchased goods and services — fifteen categories in total. For most companies, Scope 3 is 70% to 90% of the total footprint. Reporting only Scopes 1 and 2 is reporting the small change.
Scope 1, 2, and 3: Get One Boundary Wrong and the Whole Inventory Is Wrong
First, contracted fleets. The trucks are not yours and you do not buy the fuel, so those emissions are Scope 3, category upstream transportation and distribution — not Scope 1. The other way around: a leased forklift that you operate and fuel is Scope 1. A lease does not change who controls it. Second, Scope 2 must be reported two ways: location-based, using the average grid factor where you operate, and market-based, using the actual power contracts you buy. The GHG Protocol's Scope 2 Guidance requires both where contractual instruments exist. Reporting only the flattering one guarantees a question. Third, Scope 3 is not "skip it if we cannot estimate it." The Science Based Targets initiative's position is that companies whose Scope 3 exceeds 40% of their total must set Scope 3 reduction targets. There is no hiding from it — start with the two or three biggest categories, like upstream transport and purchased goods, and widen coverage year by year.
The frameworks keep moving, and you need to track that too. GRI 305: Emissions 2016 is still the most used disclosure standard, with 305-1, 305-2, and 305-3 mapping to Scopes 1, 2, and 3. But GRI has announced that GRI 102: Climate Change 2025 will replace disclosures 305-1 through 305-5 from January 1, 2027. The EU's CSRD requires all three scopes under the ESRS E1 climate standard. Frameworks change every year. The logic of the working papers does not: activity data, emission factor, evidence. Get those three right and a new framework is a reformatting job, not a new data project.
The Five Questions Auditors Always Ask About Warehouse ESG Reporting
Auditors really only ask a few kinds of questions, and if you prepare for them, nothing on the day will surprise you. One: "This number moved 30% from last year — why?" An unexplained swing is a finding waiting to happen, so prepare the explanation in advance. Two: "What is the denominator?" An injury rate without total hours worked is meaningless, and an emissions intensity without floor area and throughput cannot be compared. Three: "Are temps included?" Injuries, hours, training — leaving out temporary and contract workers is the most common deduction. Four: "Which year's factor is this?" Emission factors need a stated source and year; calculating this year's numbers with a five-year-old factor is measuring with last year's ruler. Five: "Can we recalculate it?" The auditor will pick a number at random and trace it from the raw document all the way to the final report. One broken link and it fails.
Here is the contrarian judgment: the prettier the report, the more careful you should be. I have seen too many companies spend their money on writing the report — consultants, glossy layouts, drone shots of rooftop solar — while refusing to pay for sub-meters, a proper meter layout, or the missing data fields in the WMS. The report is the facade. The working papers are the foundation. A weak foundation makes a beautiful facade collapse harder on audit day. The cheaper way around is the opposite: in year one, get the three basic data lines solid — electricity meters, water meters, weighbridge tickets. The report can be thinner and more honest, stating clearly what is not yet covered and when it will be. Auditors tolerate "not yet done, and here is the plan" far better than "done, but we cannot show the math."
So here is my question for you: could your warehouse produce, within half an hour, a single table with last year's monthly electricity use, water use, and injury count — every line backed by an original document? If not, do not rush to write beautiful ESG prose. Build that table first.
By Lao Mi, Supply Chain Veteran (20 yrs)