Over the past few years, a growing number of warehouse operators have found the same question appearing in tender documents and annual supplier questionnaires: what are the carbon emissions of this warehouse? The way the question arrives is worth noting. It rarely appears as a standalone topic. More often it is embedded in supplier onboarding, contract renewal negotiations, and sustainability reporting requirements. According to published industry reports and disclosures from leading logistics companies, carbon data for warehousing is shifting from a nice-to-have to a must-answer — and most warehouses, when asked for the first time, do not have a ready-made emissions account to hand over.
The standard framework for a carbon inventory comes from the Greenhouse Gas Protocol's three scopes. Scope 1 covers emissions from sources the company directly controls. Scope 2 covers indirect emissions from purchased energy. Scope 3 covers all other indirect emissions in the value chain, upstream and downstream. For a warehouse, this division is not abstract: each scope maps onto specific equipment, bills, and transport records. The first step in understanding the account is to distinguish which emissions sit on your own books and which are upstream or downstream emissions that still need to be counted and disclosed.
Scope 1 carbon emissions: forklifts, refrigerants, and on-site combustion
Scope 1 emissions in a warehouse come mainly from three places. The first is fuel combustion in diesel forklifts and yard vehicles; a forklift's annual fuel use can be read directly from fuel purchase records and the fleet register, making this the most easily quantified part of Scope 1. The second is refrigerant leakage. Cold stores and temperature-controlled warehouses use refrigerants whose global warming potential is far higher than the same mass of carbon dioxide, so leakage must be accounted for separately by refrigerant type and top-up quantity — and omitting it is the most common source of underestimation in cold-chain warehouses. The third is on-site combustion, such as backup generators and gas heating. These emissions are usually small, but without proper records they are easily missed altogether in an inventory.
In the autumn of 2024, a third-party logistics warehouse near Rotterdam in the Netherlands discovered during its first carbon inventory that its Scope 1 emissions were about 30% higher than expected. The cause was not forklift fuel, but the annual top-up volume of refrigerant for its cold store: over the previous three years, the refrigeration system had needed regular top-ups, and that leakage had always been recorded as a maintenance cost, never as an emissions item. The case illustrates a wider point: the difficulty with Scope 1 is often not the calculation, but the fact that the emission source was never identified in the first place.
In terms of data sources, Scope 1 is relatively straightforward: fuel purchase invoices, fuel card records, refrigerant purchase and top-up logs, and generator operating records. The key task is to bring these records — scattered across finance, equipment, and maintenance teams — into a single table, aggregated on a consistent time basis. Without that, the error in the inventory will be far larger than any error in the method itself.
Scope 2 carbon emissions: purchased electricity is usually the largest line
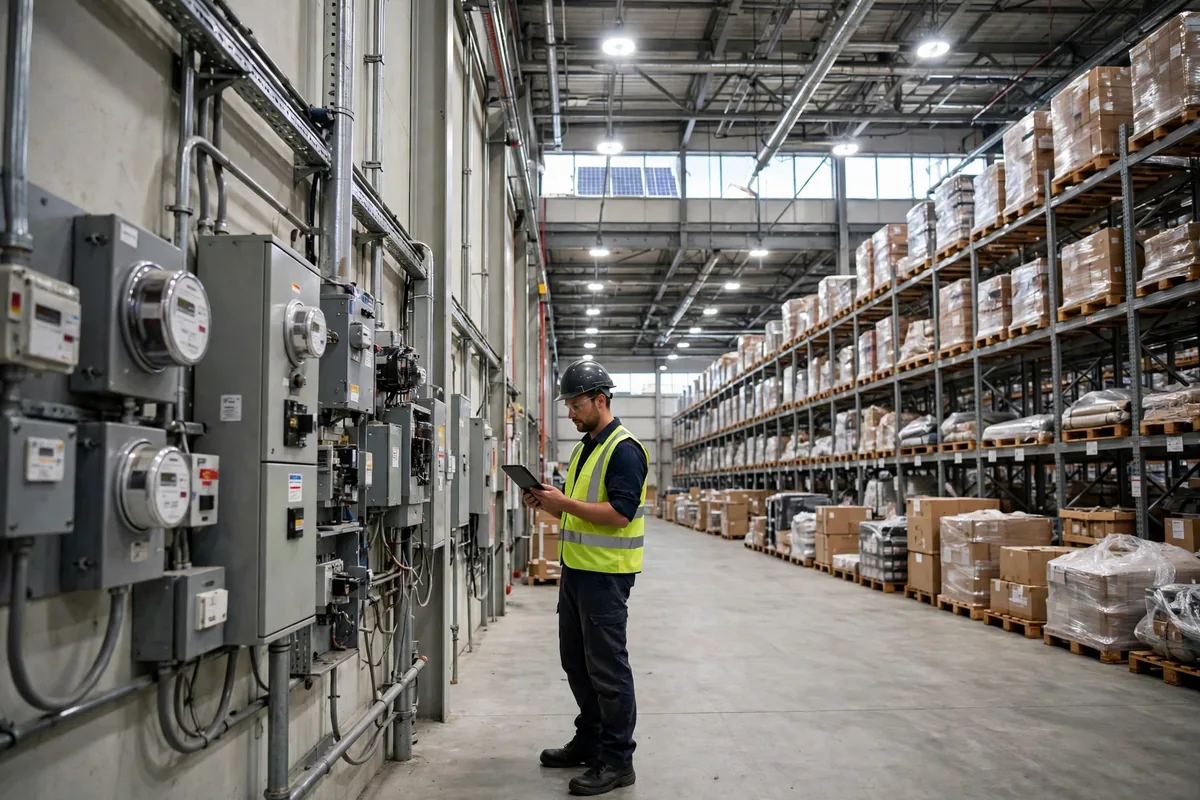
For most ambient warehouses, Scope 2 — emissions from purchased electricity — is often the largest single line in the whole inventory. Lighting, air conditioning, conveyors, sortation equipment, and charging stations concentrate electricity use in one place, and the electricity bill is the most direct data source. Monthly meter readings, multiplied by the local grid emission factor, give the basic Scope 2 figure.
But there is a detail that is easy to overlook: the choice of emission factor can change the result significantly. Using a national average grid factor versus a regional actual factor, or a market-based versus a location-based method, can produce markedly different numbers from the same electricity consumption. According to internationally recognized accounting guidance, both methods can be disclosed, but external reports must state clearly which one was used — otherwise figures from different warehouses cannot be compared at all.
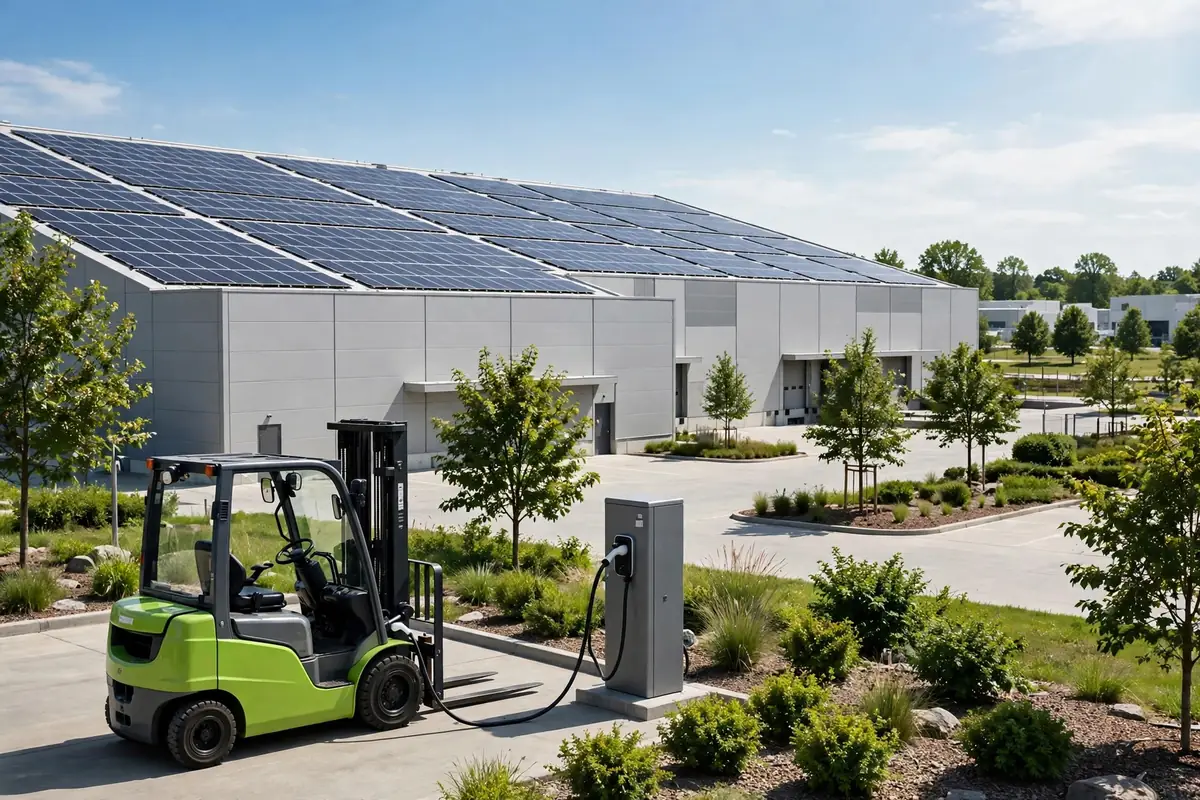
Another notable development is that rooftop solar is changing the structure of Scope 2. A warehouse near Duisburg in Germany completed a rooftop solar installation in early 2025 and reached roughly 40% self-consumption, cutting purchased electricity and Scope 2 emissions in step. The lesson of this case is not that installing solar panels solves the problem, but that the improvement path for Scope 2 is relatively clear: first break down electricity use by lighting, temperature control, and equipment, then decide whether to spend on solar, energy-efficiency retrofits, or off-peak scheduling. Without itemized data, energy-saving investment is easily spent in the wrong place.
Scope 3 carbon emissions: the hardest to calculate, and the most likely to be questioned
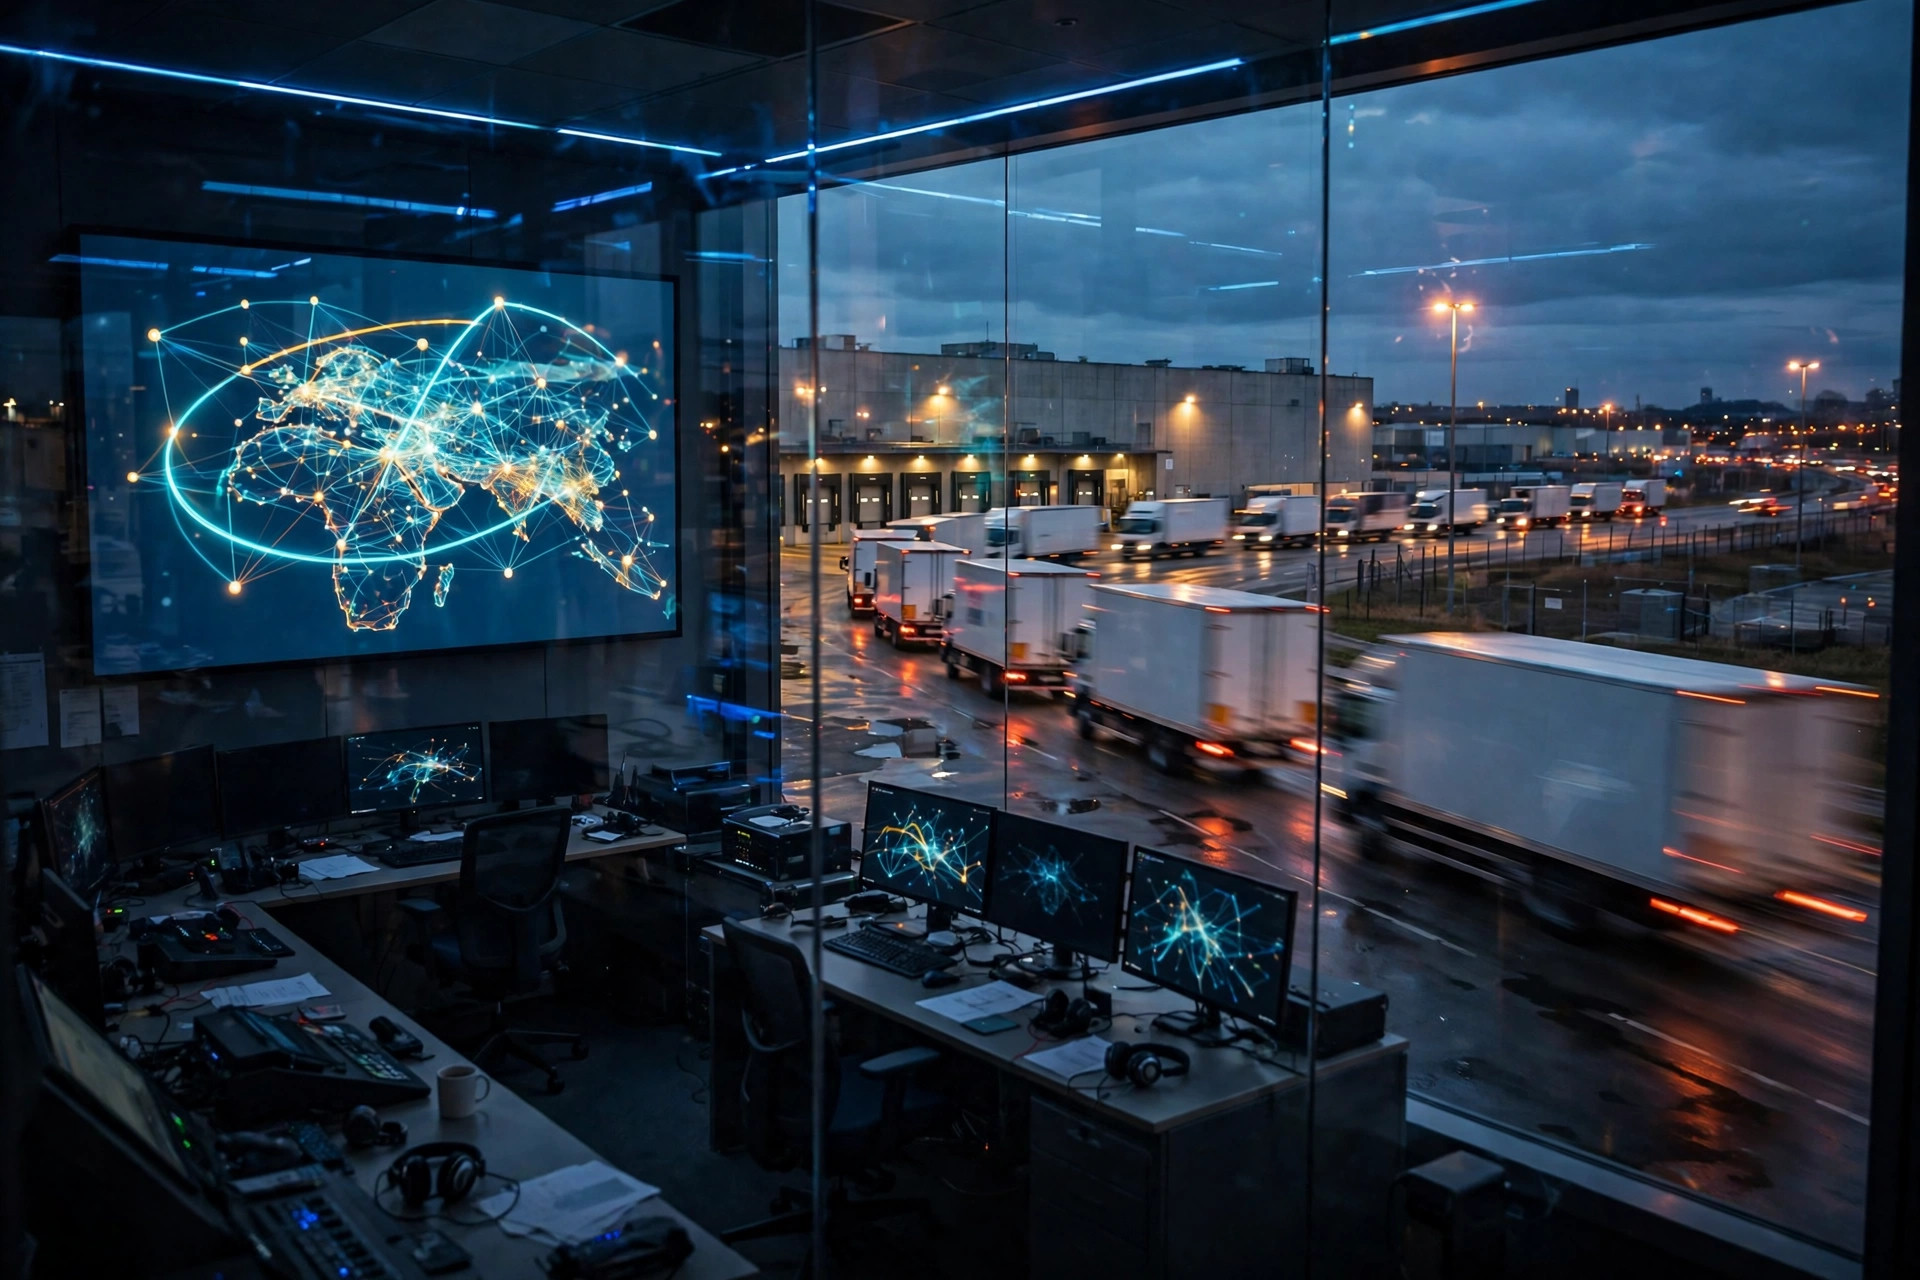
Scope 3 covers emissions upstream and downstream of the warehouse, including transport in and out, packaging materials, waste disposal, and emissions from outsourced services. For a warehouse operator, this data is the hardest to obtain, because the sources sit outside direct control and the figures must be requested from carriers, packaging suppliers, and waste handlers.
Transport is usually the largest item in Scope 3. Line-haul mileage and load can be taken from the transport management system and carrier invoices, then converted by vehicle type and fuel type; last-mile delivery emissions are spread across multiple carriers, and inconsistent definitions are the norm. Packaging emissions are converted from purchase volumes by material type, while waste is split by disposal method — landfill, incineration, and recycling have very different emission intensities. In mid-2025, a UK warehouse serving fast-moving consumer goods clients found during its Scope 3 inventory that packaging accounted for about a quarter of total Scope 3 emissions, far above management's expectation — because cartons and void fill had always been tracked by cost, never by weight and material.
The counterintuitive judgment is this: the more precisely Scope 3 is calculated, the more clearly the real problems emerge — but also the easier it is to fall into the trap of believing the data will never be detailed enough. The reasonable approach is to estimate by broad category first, establish the scale of transport, packaging, and waste, and then decide which suppliers are worth pursuing for detailed data, rather than demanding shipment-level emissions figures from every supplier from day one. The purpose of an inventory is management, not a perfect report.
Why customers are asking for warehouse carbon data under CBAM
Against the background of the European Union's Carbon Border Adjustment Mechanism (CBAM), the carbon cost of some imported goods is becoming a real variable in trade. The specific coverage, reporting requirements, and timelines of CBAM should be checked against the latest official policy, and this article does not restate specific effective dates or rates. What deserves attention is the knock-on effect of the mechanism: when importers must take on compliance obligations for the embedded carbon of their products, they will work back up the supply chain asking questions, and the carbon data of every link — warehousing included — may be requested.
This transmission is not linear. Some customers ask only for Scope 1 and Scope 2 data from the warehouse; others want inbound and outbound transport included; still others write carbon data into supplier scorecards, linked to contract renewal and pricing. The trend points in one direction: requirements will only grow, not shrink. A warehouse that waits until a customer formally requests the data will often have only a few weeks to prepare, and the quality of the result will show it.
On frequency, the pragmatic approach is one full inventory per year, with core Scope 1 and Scope 2 data updated quarterly and Scope 3 refreshed on a rolling annual basis. Common omissions include refrigerant leakage, backup generator test runs, empty return legs of outsourced transport, electricity use at temporarily leased warehouses, and employee commuting — whether the last item is included depends on the accounting boundary the company adopts, which should be stated explicitly in the inventory report rather than silently ignored.
So where does the data for a warehouse carbon inventory come from? The answer is not mysterious: electricity meters, fuel records, refrigerant registers, transport mileage, and supplier data. Most of these records already exist; they are simply scattered across different systems and departments. The real work of an inventory is to bring them together under a consistent set of definitions, and to repeat the exercise every year. As for how this account will ultimately reshape competition in warehousing — whether it becomes a hard threshold in customer selection or remains for a long time at the level of reporting — it is too early to judge. What is certain is that warehouses that get their numbers in order first will at least not enter the next round of negotiations at a disadvantage for having no data to show.
By Dr. Chen, Supply Chain Researcher