The "warehouse AI data flywheel" has appeared with growing frequency in supply chain circles: the more a warehouse AI system is used, the more data it collects and the more accurate its models become; the more accurate they are, the more people rely on them; and greater reliance feeds still more data back in. But based on my tracking of warehouse AI deployments, this flywheel does not spin nearly as smoothly as the legend suggests: it genuinely exists in some scenarios, and in others it is closer to a vision. To get this right, we look at the data first, and only then at attribution.
Where the Data Flywheel Actually Spins in Warehouses
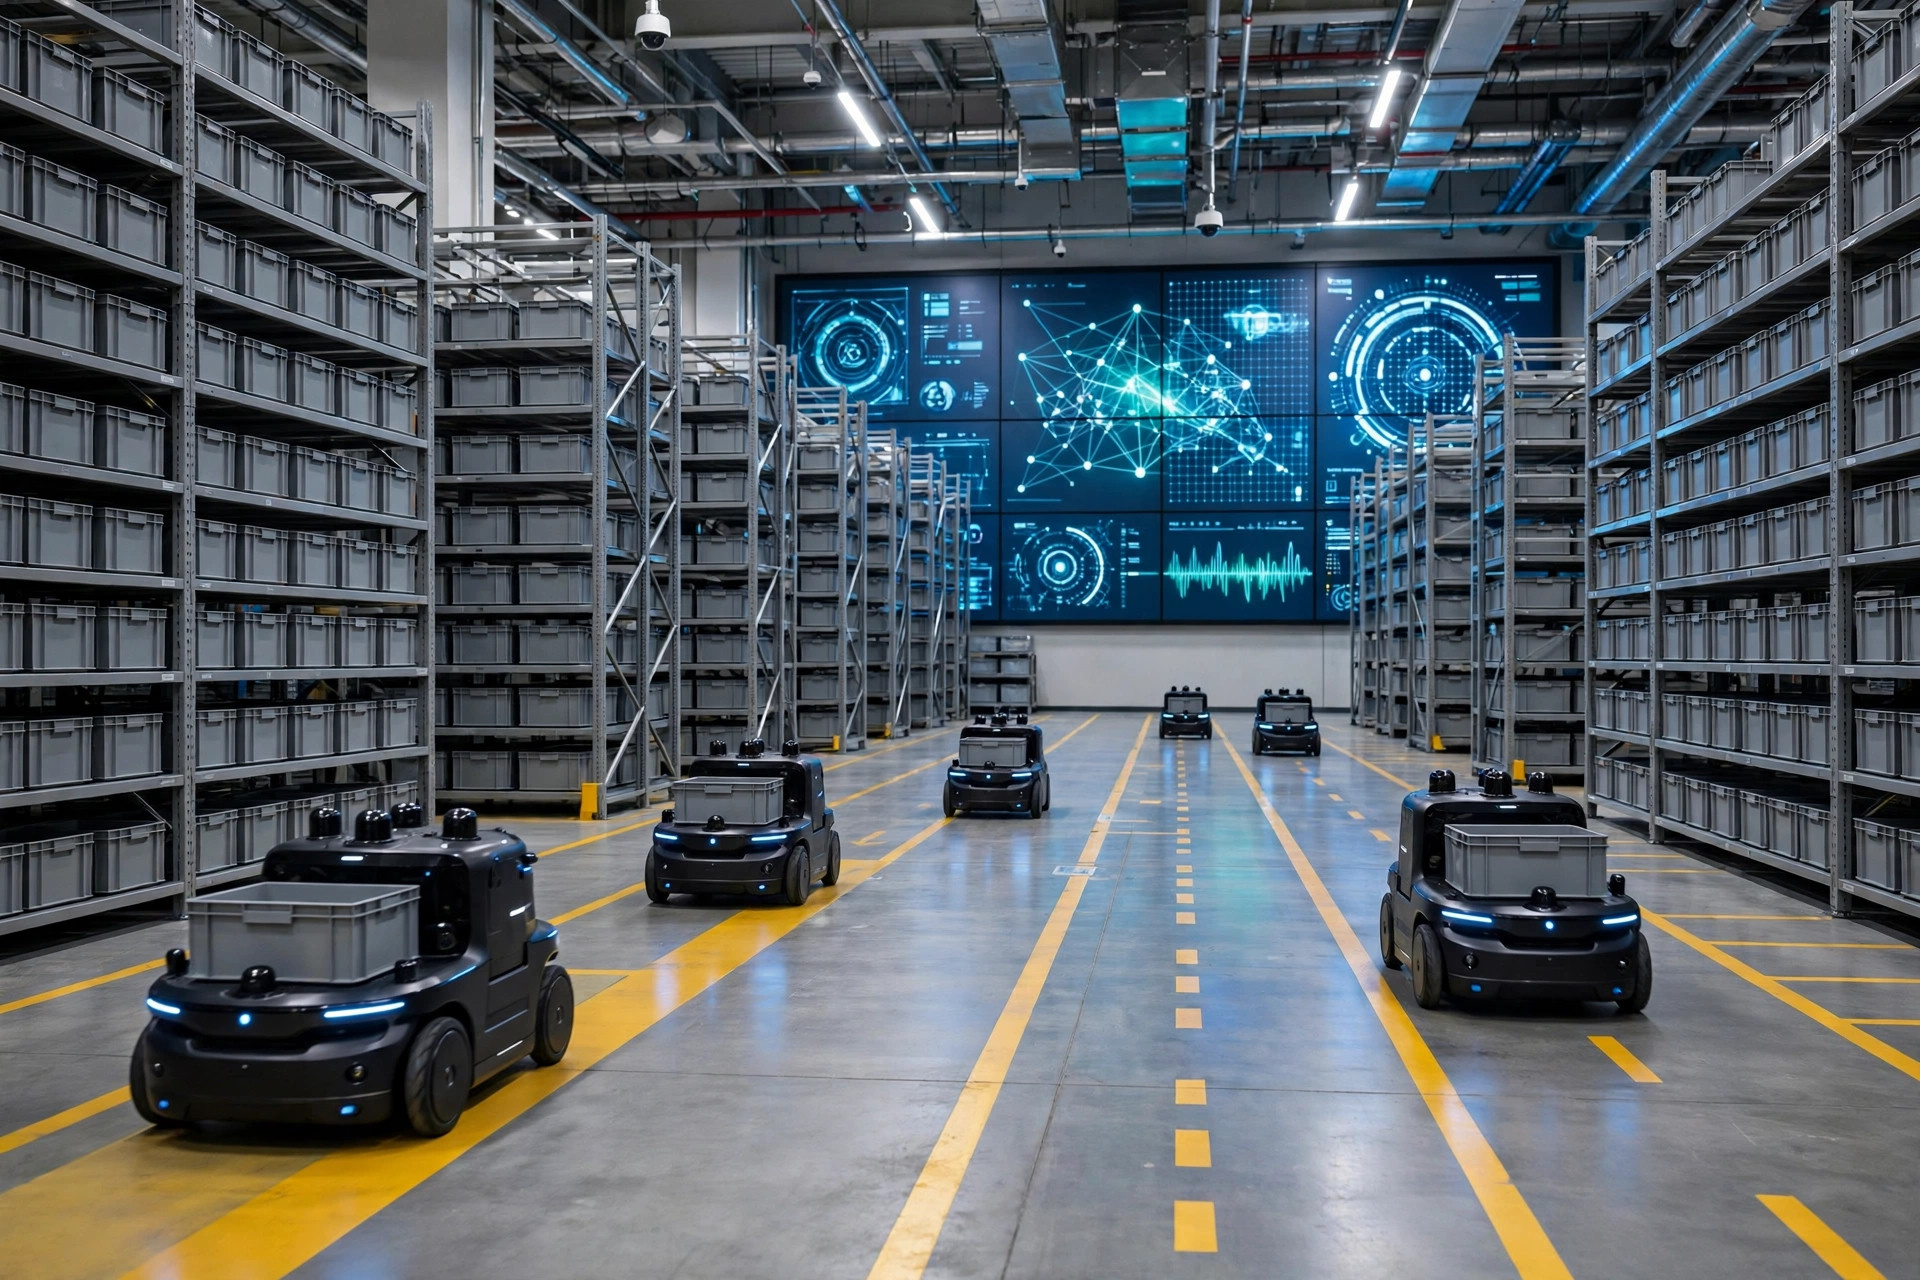
In warehouses, the data flywheel is not a slogan — it has three concrete, verifiable forms. First, demand forecasting and replenishment: historical orders and inventory feed the model, the model outputs SKU-level forecasts, forecasts guide replenishment and slotting, and actual sales become new training data. Second, vision inspection: inbound checks, damage detection, recounts — every manual review doubles as a free annotation. Third, robot task allocation: every AMR move records a travel time, every grasp records a success or failure — data born labeled, needing no secondary processing.
To observe a flywheel's true rotational speed, you need a long-enough timeline, and Amazon's warehouse robotics network is the best public sample: Kiva Systems acquired in 2012, goods-to-person robots at scale; the Sparrow arm unveiled in 2022, said to handle roughly 65% of products in its inventory; more than 750,000 mobile robots announced by 2024. Twelve years — every pick, every grasp, every failure became incremental training data.
Sparrow's iteration illustrates the mechanism: early arms handled only regularly shaped items in fixed positions; as grasp data accumulated, success rates on irregular and soft-packaged items improved, letting Amazon deploy it on more categories — capability boundary → data increment → capability boundary. The point is not algorithmic sophistication — grasp-planning frameworks have long been public in academia — but that Amazon holds grasp data with real failure labels nobody else can obtain.
A second sample is demand forecasting. Between late 2024 and early 2025, I studied two large e-commerce fulfillment centers — one in eastern China, one in southern China — each processing roughly 80,000 to 120,000 orders per day and both running SKU-level ML sales forecasting since around 2023. A year after go-live, stockout rates at both had fallen from about 6% to roughly 4%, and slow-moving inventory dwell time had shortened around 20%. Both supply chain heads said nearly the same thing: "At go-live the model was worse than our planners' intuition; only after six months of data accumulation did it pull ahead." The first half-turn of the flywheel runs at a loss — the point latecomers most often underestimate.
Why First Movers Spin Faster
Attribution comes down to three mechanisms. First, the compounding of labeled assets: in warehouses, business actions are annotations in themselves — a manual review, an exception handled, an inventory variance, each carries its own label. First movers went live earlier, so these "free annotations" started compounding earlier. A latecomer can buy the same algorithm but cannot buy those years of labeled assets. Second, feedback-loop speed: rotational speed is determined not by data volume but by how long one full cycle takes — data → model → decision → new data. In Amazon's fulfillment network that cycle is measured in hours; in demand forecasting, in days. The shorter the cycle, the faster a first mover's lead widens. Third, the breadth of long-tail coverage: how to grasp irregular items, how to cut order waves during peak season, how to handle exceptions. A model trained by a latecomer on public datasets performs comparably in standard scenarios, but the gap opens up immediately in the long tail — and warehousing is dense with long-tail scenarios.
The Uncomfortable Truth: Flywheels Don't Spin Themselves
Up to this point, it sounds like a story destined to belong to first movers. But three counterintuitive judgments come first — they determine whether the flywheel spins at all.
First, the flywheel has a cold-start threshold, and it is not low. "The more it is used, the more accurate it becomes" only holds if the system is already accurate enough that people are willing to use it. If early accuracy trails human performance, operations will route around it, and the data stream dries up. The two warehouses above survived their first six months not through technology, but through a management mandate: forecast output must drive replenishment. Without an organizationally enforced closed loop, the first turn never happens. Many warehouse AI projects die right here: the data exists, the model exists, but the process reserves no position the model "must pass through."
Second, data depreciates. Warehouse data has a hidden enemy: distribution shift. A major SKU mix overhaul, a relocation, a switch from standard to non-standard products — and old data decays fast. A vision model trained for three years on apparel can lose half its accuracy overnight in an auto-parts warehouse. A data moat has a shelf life set by scenario stability: the more stable the scenario, the deeper the moat; the faster things change, the faster it evaporates.
Third, the flywheel amplifies initial bias: poor early annotation quality or systematically biased labeling rules, and the faster it spins, the faster the bias amplifies. I once saw a sortation anomaly-detection project where "slightly wrinkled packaging" was massively labeled "damaged" early on; after go-live the model grew ever stricter, the false-interception rate climbed relentlessly, and operations finally shut down automatic interception. A flywheel has no sense of direction — it only accelerates.
These three judgments form a framework for judging whether a scenario is worth betting on the flywheel:
| Dimension | Flywheel-Friendly Scenario | Flywheel-Hostile Scenario |
|---|---|---|
| Data density | High-frequency repetitive actions, e.g., picking | Low-frequency long-tail actions, e.g., cycle counts |
| Feedback loop speed | Verifiable in minutes to hours, e.g., grasp success | Results known only after months, e.g., demand trends |
| Labeling cost | Produced naturally by the process, e.g., manual reviews | Requires dedicated offline annotators |
| Scenario stability | SKUs and processes stable long-term | Frequent assortment changes and relocations |
| Initial data scale | Years of historical data banked | Cold start from zero |
If a scenario lands in the right column on three or more of these five dimensions, "the more it is used, the more accurate it becomes" is most likely just a vision — work out the cold start and closed-loop design before investing.
Three Catch-Up Paths for Latecomers
A first mover's moat does not mean latecomers have no road. I see three viable paths. First, pretrained models plus light fine-tuning. Large vision models are changing the game: damage detection that once required hundreds of thousands of labeled images can now reach usable accuracy fine-tuned on a few thousand images from the operator's own warehouse. But this helps little with demand forecasting, which needs the depth of a site's own history. Second, data alliances. One mid-size warehouse cannot sustain a flywheel alone, but dozens pooling de-identified operational data can assemble a meaningful training set. Some European 3PLs already experiment this way: data never leaves each company's systems; only model gradients or de-identified features are shared. The difficulty is not technical but trust and benefit-sharing. That is a business problem, not an AI problem. Third, asymmetric competition: choosing scenarios where flywheels cannot spin. Non-standard-product warehouses, warehouses serving customized manufacturing, fast-fashion warehouses with frequent turnover — data depreciates so fast there that first movers' historical advantage largely evaporates. Latecomers starting here begin on the same starting line. A moat only exists where a moat can be dug.
A Timeline for the Next Three to Five Years
My judgments below rest on the historical slope of model capability curves, the falling cost of annotation, and the penetration pace of warehouse automation over the past five years — falsifiable, timeline-stamped judgments you are welcome to revisit in a few years.
From 2026 to 2028: pretrained models for warehouse vision AI become standard equipment; mid-size operators buy "eighty-point" vision inspection at modest cost, and the first-mover advantage here visibly dilutes. Meanwhile the advantage in demand forecasting keeps widening — it is decided by years of accumulated depth in a site's own data, where pretrained models cannot help.
From 2028 to 2030: regional or category-specific data alliances emerge, and leading 3PLs begin trading "data for algorithm services." Algorithms keep commoditizing, and the premium rises on "data engineering plus closed-loop operations" teams — the people worth paying for will no longer be those who can tune models, but those who can get the flywheel spinning.
I will close with an open question: if data really is the moat, does its water belong to the one who dug it, or to every piece of land it flows through? As data alliances and regulation both enter the picture, how much will today's first movers' cards still be worth five years from now? No standard answer exists — but anyone betting on warehouse AI should have their own figured out first.
By Dr. Chen, Supply Chain Researcher