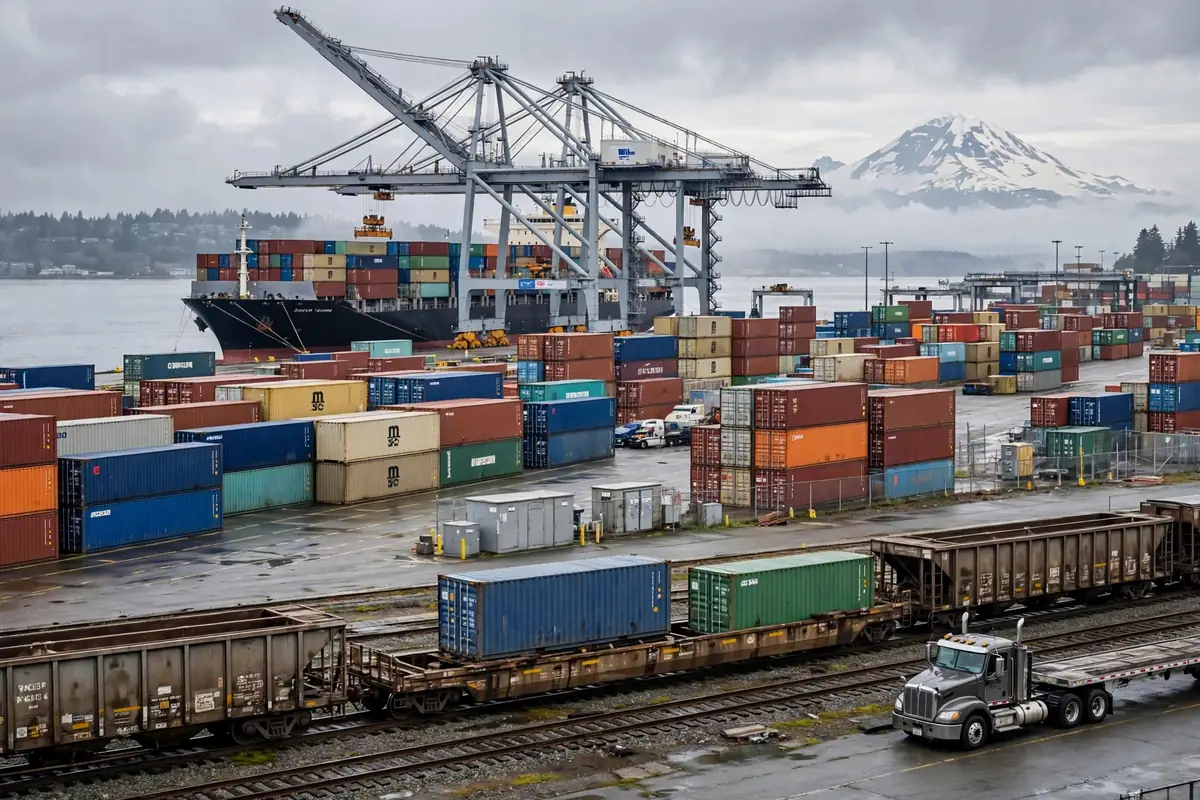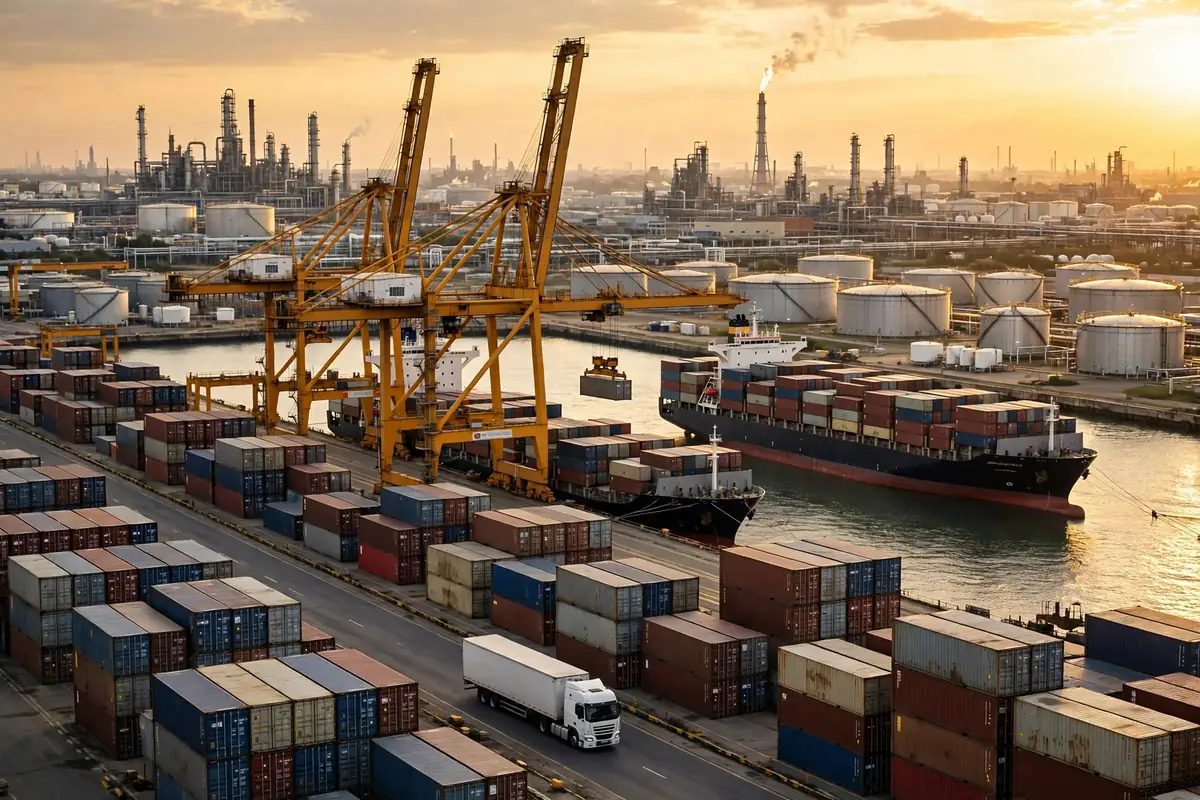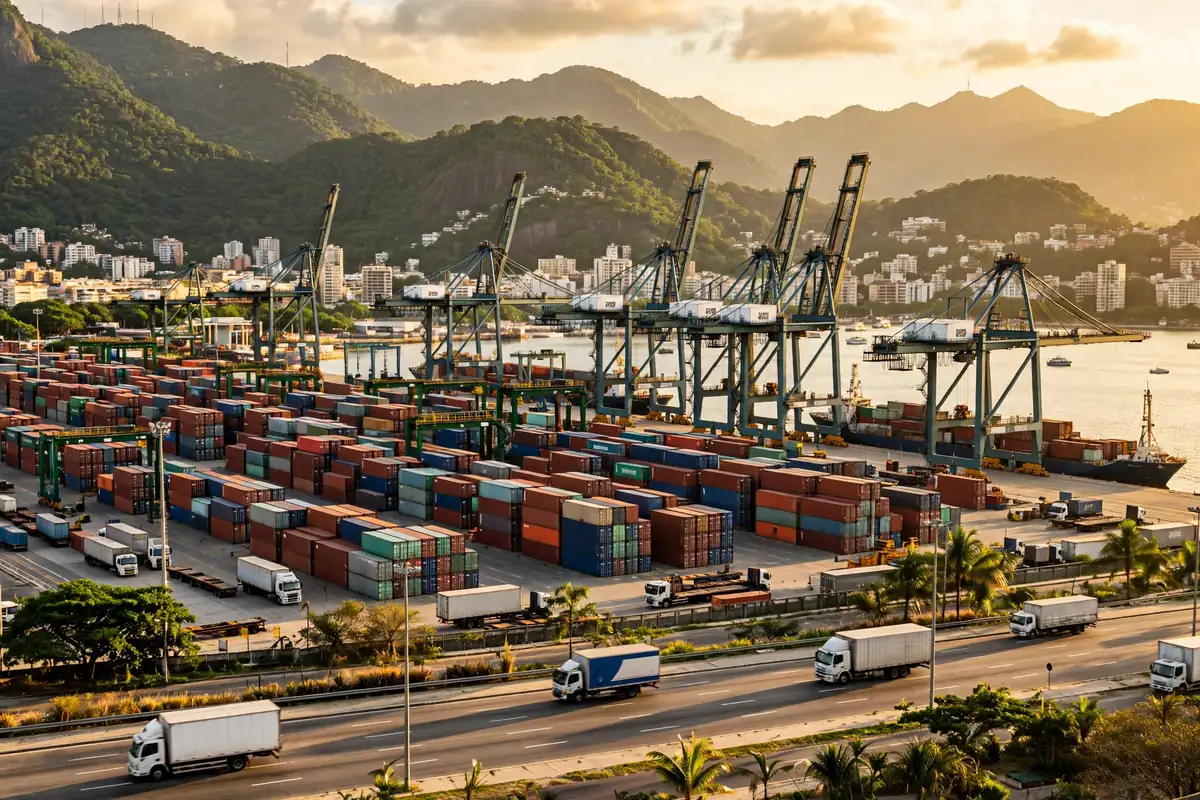
Rio de janeiro urban warehouse distribution last mile is a story that starts at the quay, not at the doorstep. ICTSI has announced an expansion of the Rio container terminal worth roughly 948 million reais, delivered over 2025–2029, lifting annual handling capacity from 440,000 TEU to 750,000 TEU — a 70.5% increase. Volume rises first; warehouses and roads catch up later. That sequencing is the basic tension of distribution in Rio: the port's capacity curve is already drawn, and whether the city's warehouse network and its access roads can keep pace is a separate calculation.
What the port expansion changes for Rio de Janeiro urban distribution
The money splits into two parts: about 414.4 million reais for infrastructure and about 533.5 million reais for equipment. Once complete, the terminal will be able to receive Panamax and post-Panamax vessels up to 366 metres long carrying more than 13,000 TEU. That matters because discharge stops being a steady flow and becomes a pulse. A ship berths, containers come off in a wave, and the trucks waiting to collect them all need road and warehouse capacity at the same time. The port sets the rhythm; the city absorbs it or it does not.
Picture the morning after a large vessel berths at the expanded terminal. Containers are released in batches, trucks queue around the port area, and every cargo owner wants the same thing: freight out of the port zone, into a warehouse, broken down, and on its way to shops and consumers across the city. The bottleneck has moved. Expansion solved the waterside constraint; the landside constraint — road capacity around the port, warehouse space within reach, cross-dock throughput — now has to be solved on its own terms. A port that discharges faster without a city network that receives faster simply relocates the queue.
Utilisation is forecast at around 75% in 2029–2030. That figure deserves attention. It is neither full nor half-empty. The headroom is there for volume that keeps growing, which means the distribution system faces not a one-off shock but a rising curve. A warehouse network planned only for today's volumes will be tight on the day the expansion completes.
Rio de Janeiro: a city where the roads were never straight
Rio is squeezed between hills and sea. Flat land is scarce, arterial roads follow the coast and the valleys, and detours are the norm rather than the exception. That geography makes warehouse location a trade-off, not a formula. A warehouse near the port sits close to the freight, but land and traffic pressure are high, and peak-hour access competes with port traffic itself. Move inland and rents and space ease, at the price of a longer leg into the city — and every extra leg has to be paid for in time and fuel.
Vehicle choice is part of the same trade-off. Large trucks do not suit every hillside street, and some districts cannot take them at all. The chain therefore breaks at a transfer point: heavy vehicles run the trunk leg, smaller vehicles carry freight into the neighbourhoods. Where that transfer point sits decides whether the arithmetic works. Too far out, and the small vehicles run empty for too long; too far in, and the heavy vehicles struggle to get in and out. Warehouse planning in Rio is not a site-selection exercise on a flat map. It is a balance struck between terrain, vehicle size, and delivery promises.
There is a cost here that spreadsheets often understate. Time lost in traffic and distance added by detours are harder to compress than warehouse rent. Rent can be negotiated; the road network cannot be redrawn. A network plan that optimises only for rent per square metre will leave its real costs on the road.
The last mile: where standard delivery stops working
The hardest last mile in Rio is not downtown, with its offices and shopping districts. It is the hillside communities and favelas, where streets are narrow, gradients are steep, and addresses and navigation signals often fail to line up. Delivery processes designed for flat urban grids have to be rethought on arrival.
The working practice is layered delivery. Trunk vehicles go only as far as a handover point at the edge of the community, and couriers who know the terrain — often on motorcycles or on foot — carry parcels the rest of the way. The handover point is the most delicate part of the whole chain: where it sits, who holds the goods, and who bears responsibility for loss or delay matter more than the vehicles themselves. One handover point means long round trips for the last-mile courier; too many of them, and management and rental costs climb.
Timing is another trade-off. Avoiding peak hours and busy community periods, and valuing reliability over raw speed, is the practical choice many local delivery teams make. For merchants, the metric that counts here is not how fast a promise is, but whether it is kept. One on-time delivery builds more trust than several fast but unreliable ones.
Consider a rainy evening in a hillside community. A courier rides up the slope on a motorcycle while the navigation signal drifts between buildings, and the delivery address resolves only to a small shop near the community entrance. The final stretch runs on the courier's knowledge of the terrain and an understanding with the shopkeeper: the parcel waits at the shop, and the recipient collects it on the way home from work. That informal handover is hard to model in a system, yet it is how delivery actually functions in these neighbourhoods. Any plan to cover the whole city with a single standard process will run into trouble here.
Where the money goes
Breaking down the terminal investment makes half of the distribution arithmetic visible:
| Investment | Amount |
|---|---|
| Infrastructure | About 414.4 million reais |
| Equipment | About 533.5 million reais |
| Total | About 948 million reais |
One derived calculation follows. Capacity rises from 440,000 to 750,000 TEU, an increment of 310,000 TEU, which works out at roughly 3,058 reais of investment per additional TEU of annual capacity. That is the port-side ratio. The city-side ratio has to be calculated separately: moving a warehouse closer to consumers saves trunk time and costs more in rent and access pressure; moving it outward saves rent and costs more in distance and handover expense. Neither option is inherently cheaper. The answer depends on the freight mix — high-frequency, small-batch goods justify proximity to consumers, while low-frequency, large-batch goods belong further out.
Here is the counterintuitive part. No amount of spending on port infrastructure and equipment buys certainty in the last mile. Faster discharge at the quay can mean faster congestion on the roads into the city. Whether the expansion pays off depends on whether the warehouse network, the transfer points, and the last-mile handover organisation keep pace. The port's calculation is done. The city's is just beginning.
Looking ahead, utilisation is forecast at around 75% in 2029–2030, and volumes are set to keep rising along a curve the city can now see coming. The port expansion gives Rio a clear timetable. The remaining choices — where warehouses go, where transfer points sit, who handles handover in the hillside communities, and how reliability is weighed against speed — will have to be worked out, one decision at a time, by the people who actually run distribution in the city.
By Dr. Chen, Supply Chain Researcher