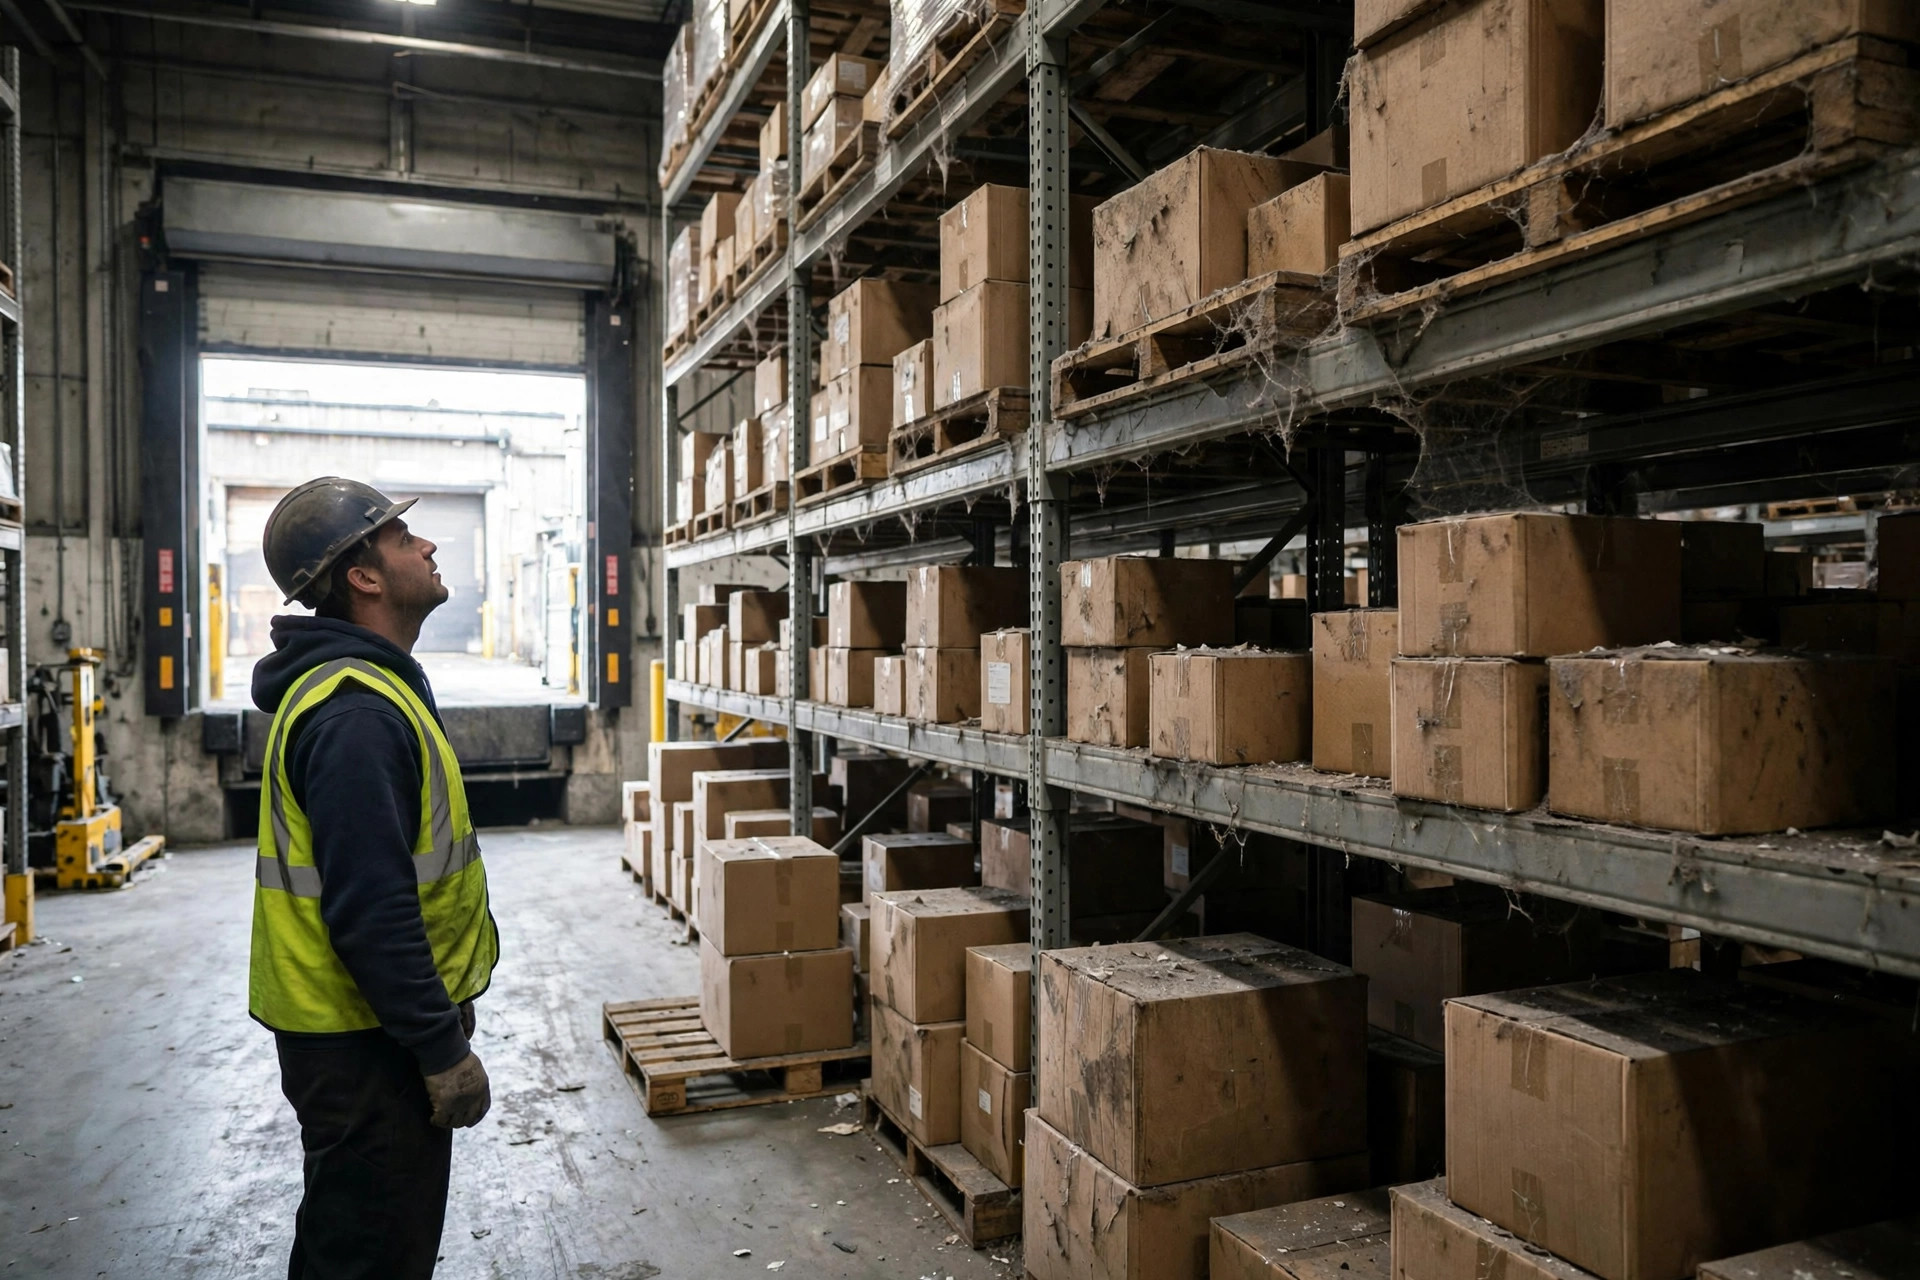
In September 2024, a 3PL client in Ontario, California selling small home appliances asked me to run the numbers on his inventory aging. Book inventory: $4.2 million. Stock aged over 180 days: $1.6 million, or 38%. After I finished the math, he went quiet for a while. That $1.6 million of goods sitting in the warehouse cost him $115,000 a year in warehousing rent plus $128,000 in capital cost at an 8% annual rate — $243,000 total. The goods earned him nothing, yet burned $243,000 a year before making a dime. That money was spent for nothing.
The Real Math: Every Extra 30 Days of Inventory Aging Costs You Three Ways
First, capital cost. The formula: inventory value × annual capital cost rate ÷ 365 × days aged. $1.6 million × 8% ÷ 365 × 180 = $63,000 — and that is only half a year; a full year is $128,000. Cash tied up in goods is the same as borrowing money from yourself at 8% to hoard stock.
Second, warehousing rent. Slow-moving goods occupy pallet positions that charge rent by the month. That $1.6 million occupied roughly 900 pallet positions at about $10.60 per pallet per month locally: 900 × 10.60 × 12 = $115,000. Fast-moving goods turn 12 times a year, so rent spread across each unit is invisible. Slow goods turn once a year, and the rent lands entirely on their own heads. That is what "occupying slots without earning" means.
Third, depreciation and obsolescence risk. Small appliances refresh twice a year. Goods aged over 180 days suffer aging packaging and discontinued parts, and can only move at a discount — a 10%-30% write-down is routine. It never shows up as a finance expense, but it eats your margin directly.
Added together: $1.6 million of slow stock carries a true annual holding cost of at least $243,000, before write-downs — an annualized holding cost rate above 15%. A bank pays you 4%-5%; meanwhile you fund depreciating goods at an 8% cost of capital.
The Breakdown: One Inventory Aging Report, Five Buckets, Five Playbooks
| Aging bucket | State of the money | How cost escalates | Action |
|---|---|---|---|
| 0-30 days | Normal turns, negligible capital cost | Base rent | Ship FIFO, business as usual |
| 31-60 days | Capital cost starts accruing | Capital cost adds about 2% | Yellow flag: diagnose slow movement, draft a promo plan |
| 61-90 days | Depreciation risk appears | Write-down risk starts accruing | Discount, bundle, switch channels |
| 91-180 days | Pricing power gone, you are begging buyers | Annualized holding cost rate breaks 15% | Clearance pricing, negotiate vendor returns in parallel |
| 180+ days | Sunk-cost risk, highest slot opportunity cost | Every extra day is a net loss | Pick one of three exits: clear out, donate for tax deduction, or scrap — free the slots |
Note: cost rates are illustrative, assuming an 8% annual cost of capital and warehousing at roughly 12% of goods value per year. Plug in your own rates.
In March 2025, an auto-parts distributor in Dallas, Texas with 4,800 SKUs ran an aging report at my suggestion. SKUs aged over 90 days occupied 27% of slot count yet contributed only 4% of sales. Twenty-seven percent of the slots, four percent of the output — zombies in the warehouse. The fix: 90-180 day stock cleared at 30% off through repair-shop channels; of the 180+ day stock, 60% went back to vendors and the tail lots were sold in bulk to a liquidator. Two months freed 1,900 pallet positions and cut monthly rent by $23,000 — $276,000 a year. That money had been an "invisible" cost to him until the aging report made it visible.
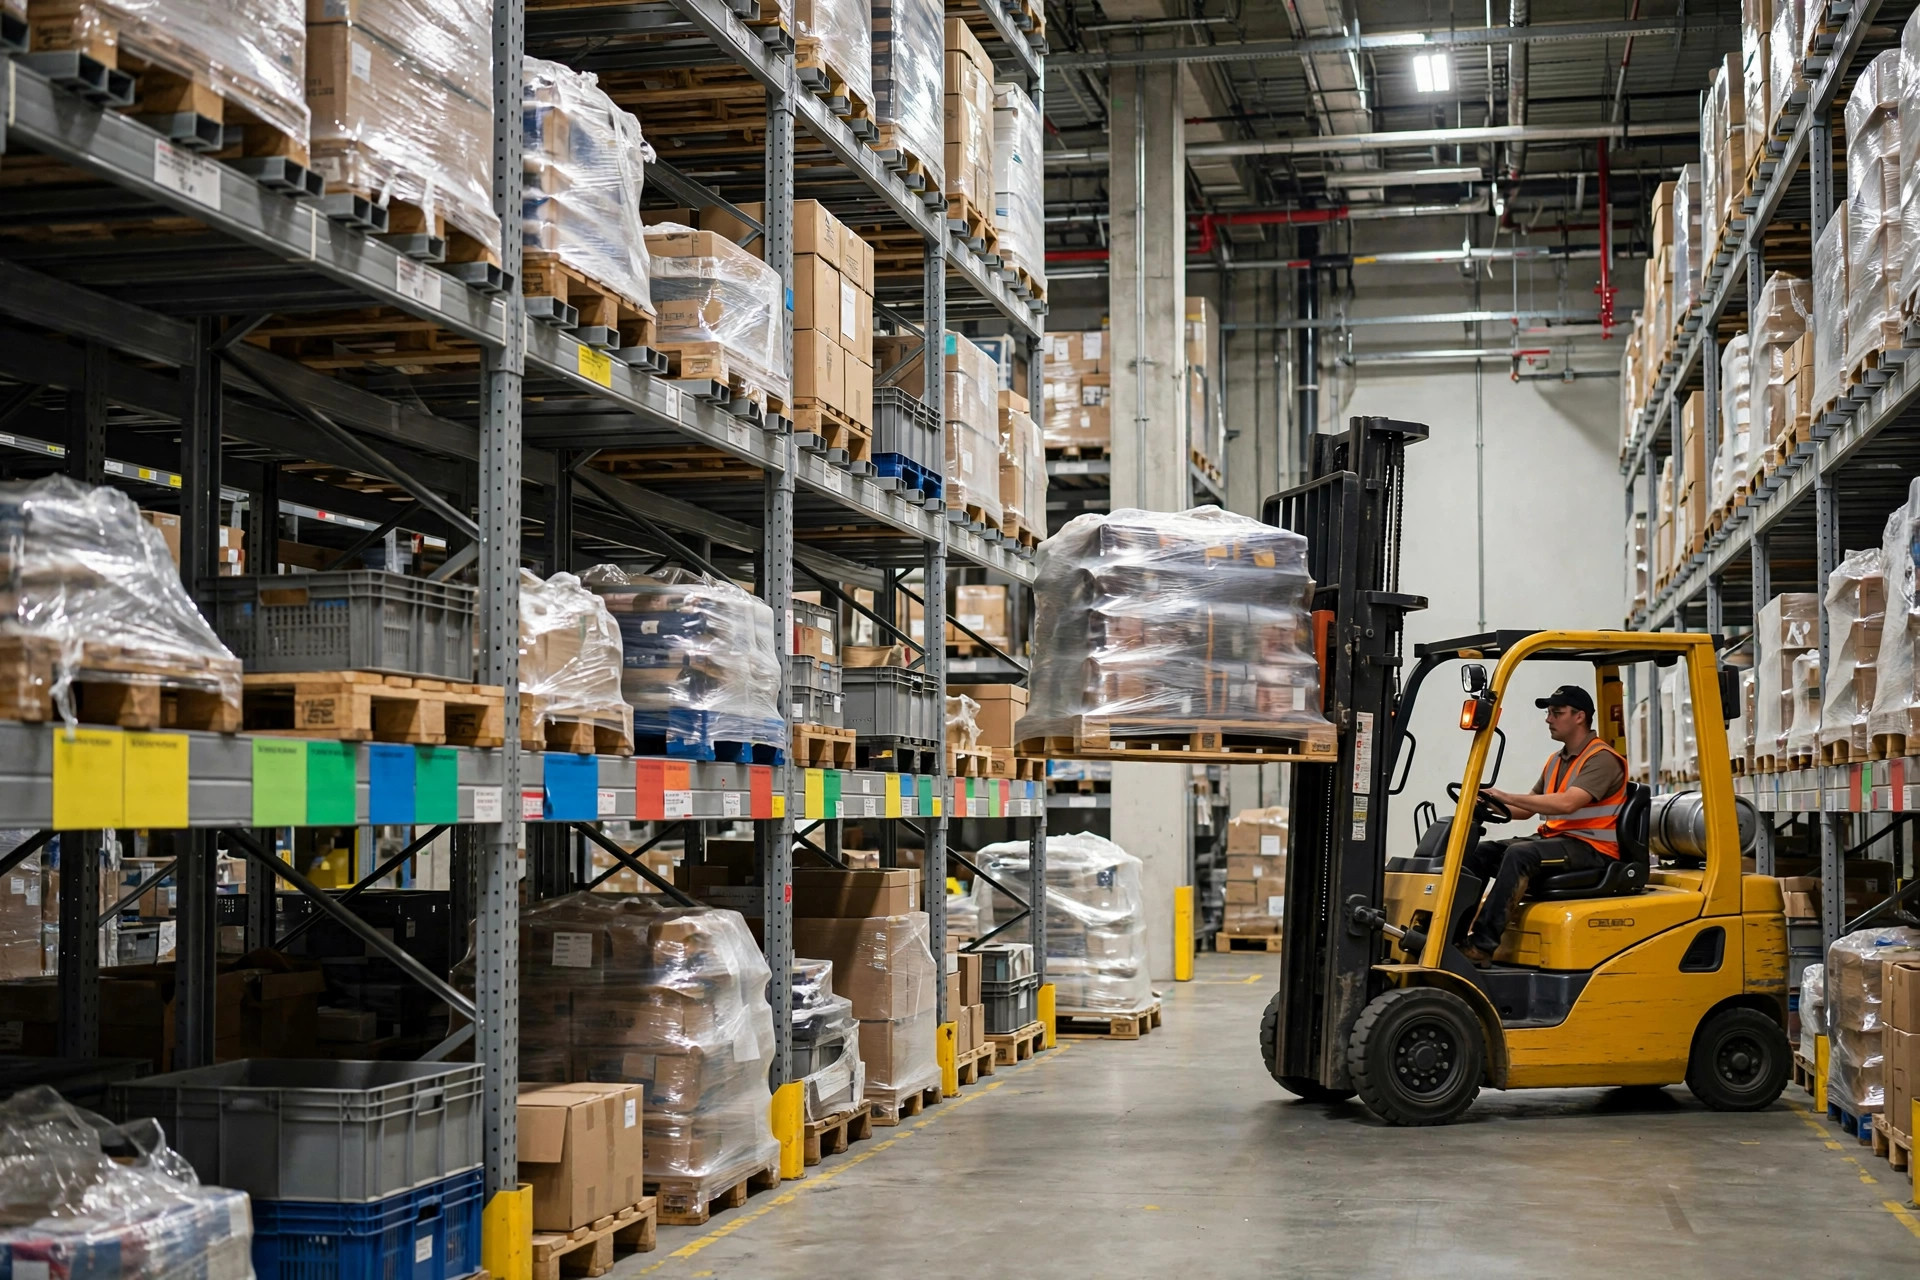
Execution detail: during cycle counts, tag every slot holding 90+ day stock with a colored rotation label — red for 180+ days, yellow for 90-180. Forklift drivers can see at a glance which pallets are the money-burners. The labels cost pennies; the effect is moving the aging data from the system onto the floor.
Counterintuitive: Don't Clear the Oldest Stock First
Most people get an aging report and their first instinct is to liquidate everything over 180 days. Wrong. The clearance decision is not driven by age — it is driven by three numbers: gross margin, replenishment lead time, and slot opportunity cost.
High margin (above 40%) plus a 90-day replenishment lead time means 180 days of aging may be perfectly rational safety stock — clearing it just creates stockouts and lost orders. Low margin (below 15%) plus replenishment available anytime means 60 days of aging is already clearance-worthy; every pallet position it holds is paying rent on behalf of fast movers.
The math: slot opportunity cost = the slot's average monthly margin contribution if filled with fast movers − the slow SKU's actual monthly margin contribution. If the difference is positive, clearing the stock is profitable. The most extreme case I have seen: one SKU aged 220 days at 55% margin with a 120-day lead time — keep it. Another SKU aged 75 days at 12% margin, available locally in three days — clear it. An aging report is a medical checkup, not a verdict; read the three numbers before operating.
The Lever: Run the Inventory Aging Report on the 1st of Every Month
It is not complicated. Pull four fields from the WMS: SKU, inbound date, current inventory value, and trailing-90-day movement. Aging = today − inbound date, weighted-averaged across batches for the same SKU. On the morning of the 1st each month, finance and warehousing review the report together and watch exactly three numbers:
- Share of inventory value aged over 90 days: above 25%, and a clearance plan is mandatory that month;
- Inventory value aged over 180 days: every dollar is a stop-loss candidate — no "let's wait and see";
- Pallet positions occupied by slow stock × rent per pallet per month = the rent you paid this month on behalf of slow goods.
The Calculable Conclusion
On the 1st of every month, run this: inventory value aged 90+ days × (annual capital cost rate of 8% + annualized warehousing rate) ÷ 12 = the real money you paid this month for slow stock. Example: $1.2 million of 90+ day stock at a 15% annualized warehousing rate gives a monthly cost of 1.2M × 23% ÷ 12 = $23,000.
The target: push the 90+ day share below 15% within six months. On a $1.2 million base, cutting it to $600,000 saves 600K × 23% = $138,000 a year — the price of a new electric forklift. An aging report will not save you money by itself, but it shows you exactly where every dollar burns. A cost you cannot see is a cost you can never cut.
By Lao Zhou, Logistics Cost Analyst