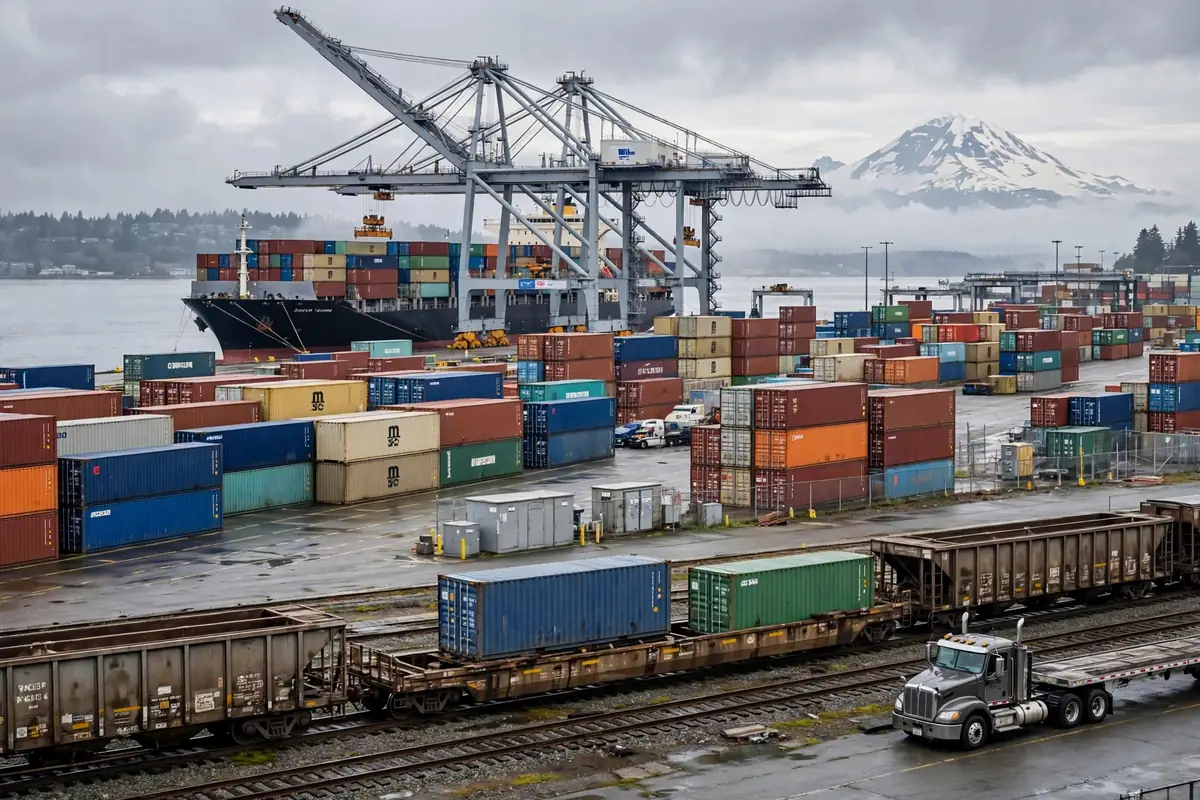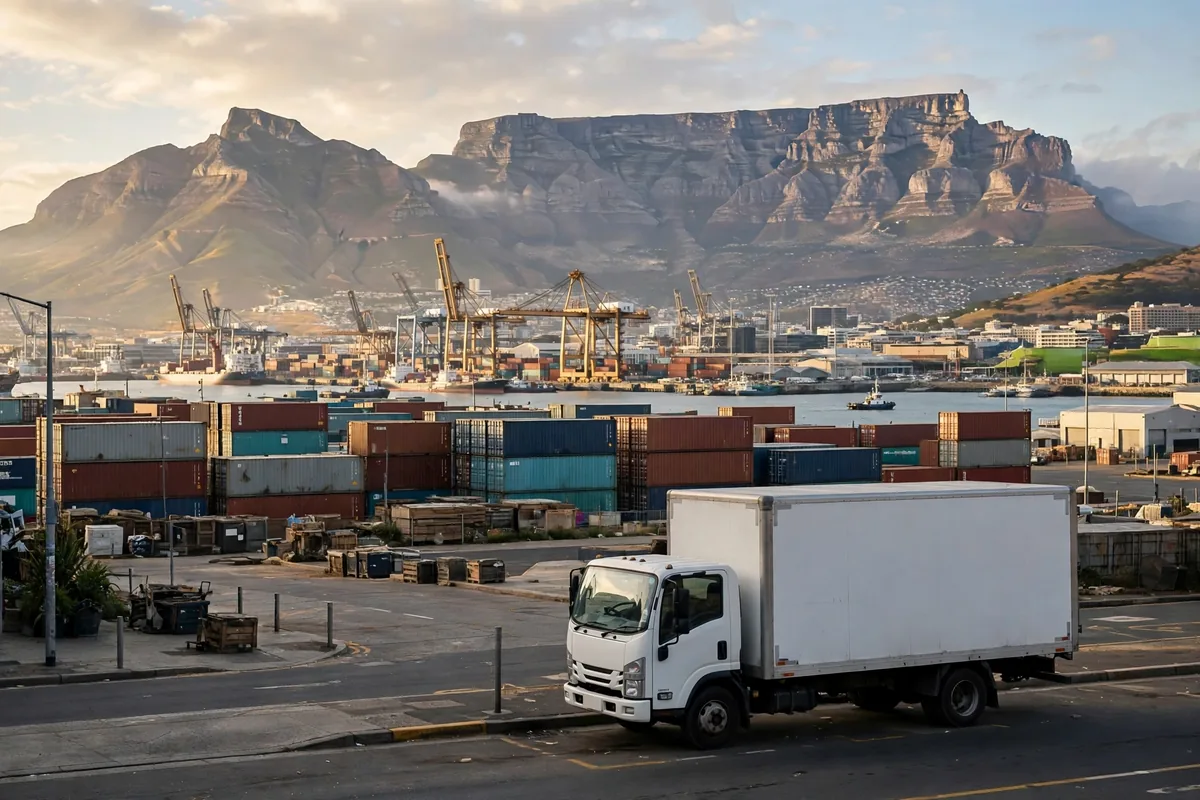
Cape Town urban warehouse distribution is a problem shaped first by geography and only second by price. The city's port sits on Table Bay, just north of the central business district, while Table Mountain rises 1,086 metres behind the City Bowl and the Cape Peninsula narrows southward toward the Cape of Good Hope, roughly 50 kilometres away. Freight coming off a ship is therefore close to downtown and yet a long way from the metropolitan area it must serve.
A city where the map decides the warehouse
According to Britannica, Cape Town is South Africa's legislative capital and the capital of the Western Cape, a seaport city whose first settlement grew between Table Mountain and Table Bay. That origin still governs logistics. The City Bowl is an amphitheatre enclosed by Table Mountain, Devil's Peak, Lion's Head and Signal Hill, and the flat land that can hold large warehouses lies mostly outside it, across the Cape Flats and up the northern corridor.
The corridors themselves are the constraint. According to the City of Cape Town's draft Freight Management Strategy of February 2026, freight pressure is heaviest on the N1, N2 and N7, and most freight moves by road. The strategy also records 20 to 30 truck crashes each month on the freeways, growth in light delivery vehicles driven by online shopping, and operational challenges at the port itself. In other words, unreliability arrives from both ends of the journey: the road into the city and the terminal at its edge. A distribution plan that treats either end as stable is building on an assumption the city's own documents do not support.
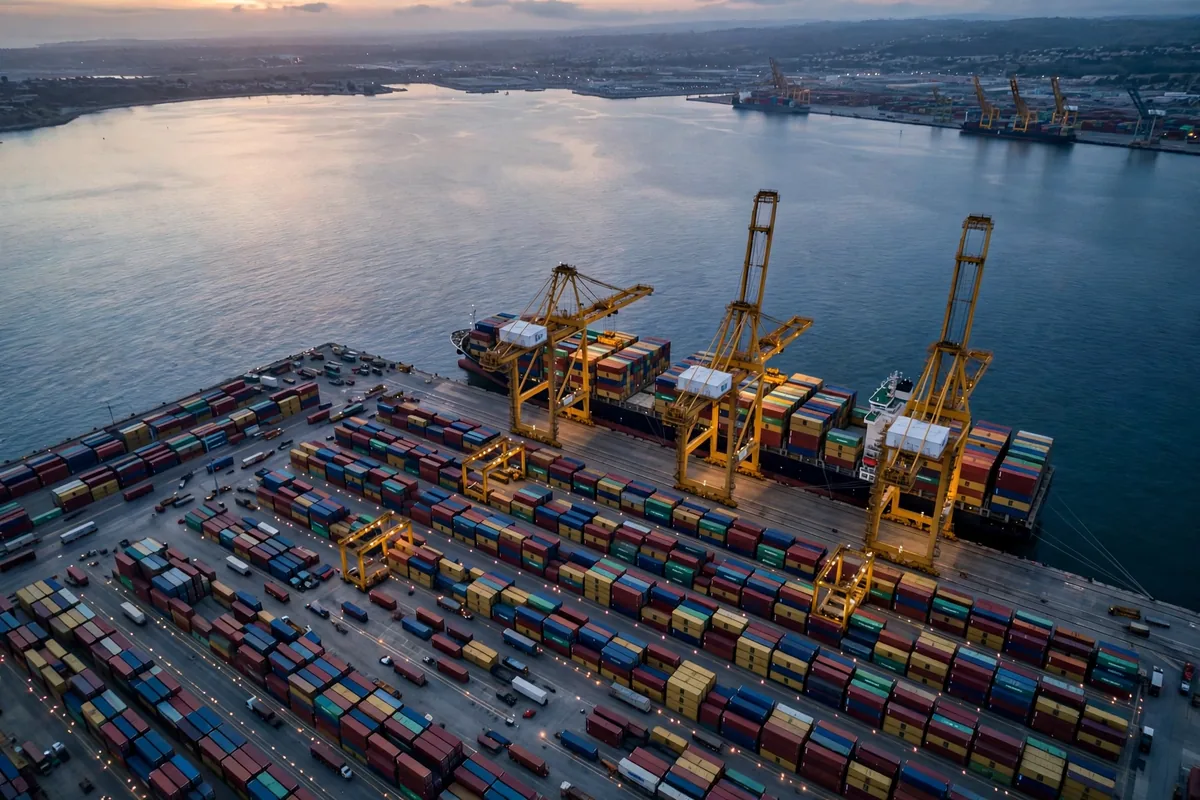
Consider a fruit exporter in harvest season, a case that recurs every year in the Western Cape. Reefer containers must meet a sailing, and the Cape Town Container Terminal is being expanded from about 1 million TEU a year toward 1.4 million TEU, with 2,700 reefer plug points and the ability to handle vessels of 8,000 TEU, according to reporting on the Transnet upgrade programme. A warehouse beside the port shortens the final leg to the vessel, yet it also places the exporter inside the most congested approach and the most volatile part of the port's operation. Staging the same fruit further north, pre-cooling and sorting it in a larger facility, then sending it to the port in scheduled batches, adds kilometres but gives the exporter control over the rhythm of loading.
Congestion is the baseline for Cape Town last-mile delivery
The scale of the road problem is visible in a single corridor. Research published through the University of Pretoria records average daily traffic of 152,000 vehicles on the N1 between the Koeberg interchange and Sable Road, against 84,000 in 2000, an increase of about 80 percent over 24 years, or roughly 2.5 percent a year. For a last-mile operator, the implication is practical: schedules built on free-flow travel times will fail on ordinary weekdays, and the failure will look like lateness at the customer's door rather than like a traffic report.
A second scene makes the point at street level. A light delivery vehicle leaves a northern-suburbs warehouse in the early morning with a round of drops in the City Bowl. The distance on a map is modest. The time is not. The N1 inbound flow, the traffic signals of the central area, and the scarcity of loading space outside older buildings stretch the round, and the driver can spend more of the shift waiting and circling than actually unloading. The same round run off-peak, or re-routed through a small inner-city transfer point where a larger truck drops consolidated loads for small vehicles to finish, looks more expensive per drop on a spreadsheet and often performs better across a full day.
This is where a counter-intuitive judgement belongs. The warehouse closest to the port is not necessarily the cheapest warehouse in total cost. Proximity saves line-haul kilometres and shortens the window to the vessel, but it concentrates the operation exactly where land is scarcest, congestion is worst, and port disruption transmits fastest. Pushing the warehouse outward trades those risks for a longer stem into the city every day, with more fuel, more driver hours and more exposure to peak-hour delay. Which trade is right depends on how much lateness the cargo can absorb: reefer exports bound to a sailing value certainty at the port, while replenishment stock for e-commerce values the sorting efficiency and space of a larger suburban facility.
Three ledgers before choosing a Cape Town warehouse
A workable decision framework for Cape Town comes down to three ledgers: the line-haul ledger, the last-mile ledger, and the volatility ledger. The line-haul ledger covers distance and reliability to the port, the airport and the main freeways. The last-mile ledger covers the density of drops, the distance between stops, and the practical conditions for unloading at each address. The volatility ledger covers what happens in peak season, after weather downtime, or when port operations slip, and whether the chosen location can still hold its service promise. Few locations win on all three, and the choice is a matter of pricing different risks rather than finding a site without any.
| Location | Space and rent level | Line-haul and port access | Last-mile profile | Suits | Main risk |
|---|---|---|---|---|---|
| Near the port and CBD | Tight, at the higher end locally | Shortest run to the vessel | Dense stops, constrained unloading | Reefer exports on fixed sailings, high-turnover cargo | Congestion and port disruption transmit directly; expansion is hard |
| Northern and eastern freeway corridor | More available, mid-range locally | Along the N1, N2 and N7, dependent on freeway flow | Longer stem into the city, suited to bulk replenishment | E-commerce fulfilment, regional distribution, buffer stock | Peak hours lengthen every inbound trip |
| Small inner-city transfer point | Small footprint, higher unit cost locally | No line-haul role, handover only | Short radius, few stops, steadier on-time performance | Frequent small batches, time-sensitive city orders | Limited area and sorting capacity, hard to scale |
Rent is described only in relative terms here, because quoted rates vary sharply by precinct, size and lease term, and any live decision should be checked against current local listings. The more important line in the table is the one it does not contain: with about 95 percent of the city's exports moving by road and only about 5 percent by rail, according to the city's draft strategy, every location's volatility ledger is heavier than it looks. A well-chosen warehouse cannot outrun a freeway system that slows as a whole in the peak, which is why the structure of the network matters more than the address of any single building. Splitting a journey into a line-haul leg and a last-mile leg, with a transfer point between them, moves the volatility to the leg where it can be managed rather than letting it land directly on the customer.
The direction of travel is toward a more layered network. On the line-haul side, the city's strategy points to shifting freight from road to rail, supporting inland terminals such as Belcon and Kraaifontein, and protecting land for future logistics hubs. On the last-mile side, the growth of light delivery vehicles and micro-freight on local streets is already in the strategy's problem list, which suggests more small vehicles and more inner-city handover points rather than fewer. Warehousing in this picture stops being a place to store goods and becomes a buffer between a volatile trunk and a time-sensitive final leg.
That leaves an open question rather than a verdict. Geography gives Cape Town no shortcut around its own congestion: the mountain, the bay and three freeways fix the shape of the distribution network, and two decades of traffic growth suggest the pattern will not reverse because a single project opens. What can change is the structure laid over that geography, and the evidence to watch is specific: whether rail's share of exports moves measurably above its current low level, whether inland terminals such as Belcon gain the capacity to absorb peak-season reefer flows, and whether inner-city transfer points appear in enough numbers to take the last mile off the freeways. Until those three move together, the honest way to price a Cape Town delivery is to price the delay as well as the distance, and to choose the warehouse that survives the worst ordinary day rather than the one that looks cheapest on the best one.
By Dr. Chen, Supply Chain Researcher