Let me start with a complaint: in every integrator's slide deck, warehouse automation ROI always pays back in two and a half years.
I've sat through at least five integrator pitches. AMRs, conveyor sorters, AS/RS — every single one lands at 2.5 to 3 years payback, neat as if they'd all coordinated. Then I figured it out: the whole trick lives in one denominator, the warehouse automation utilization rate. Fudge that number and the ROI looks however pretty you want.
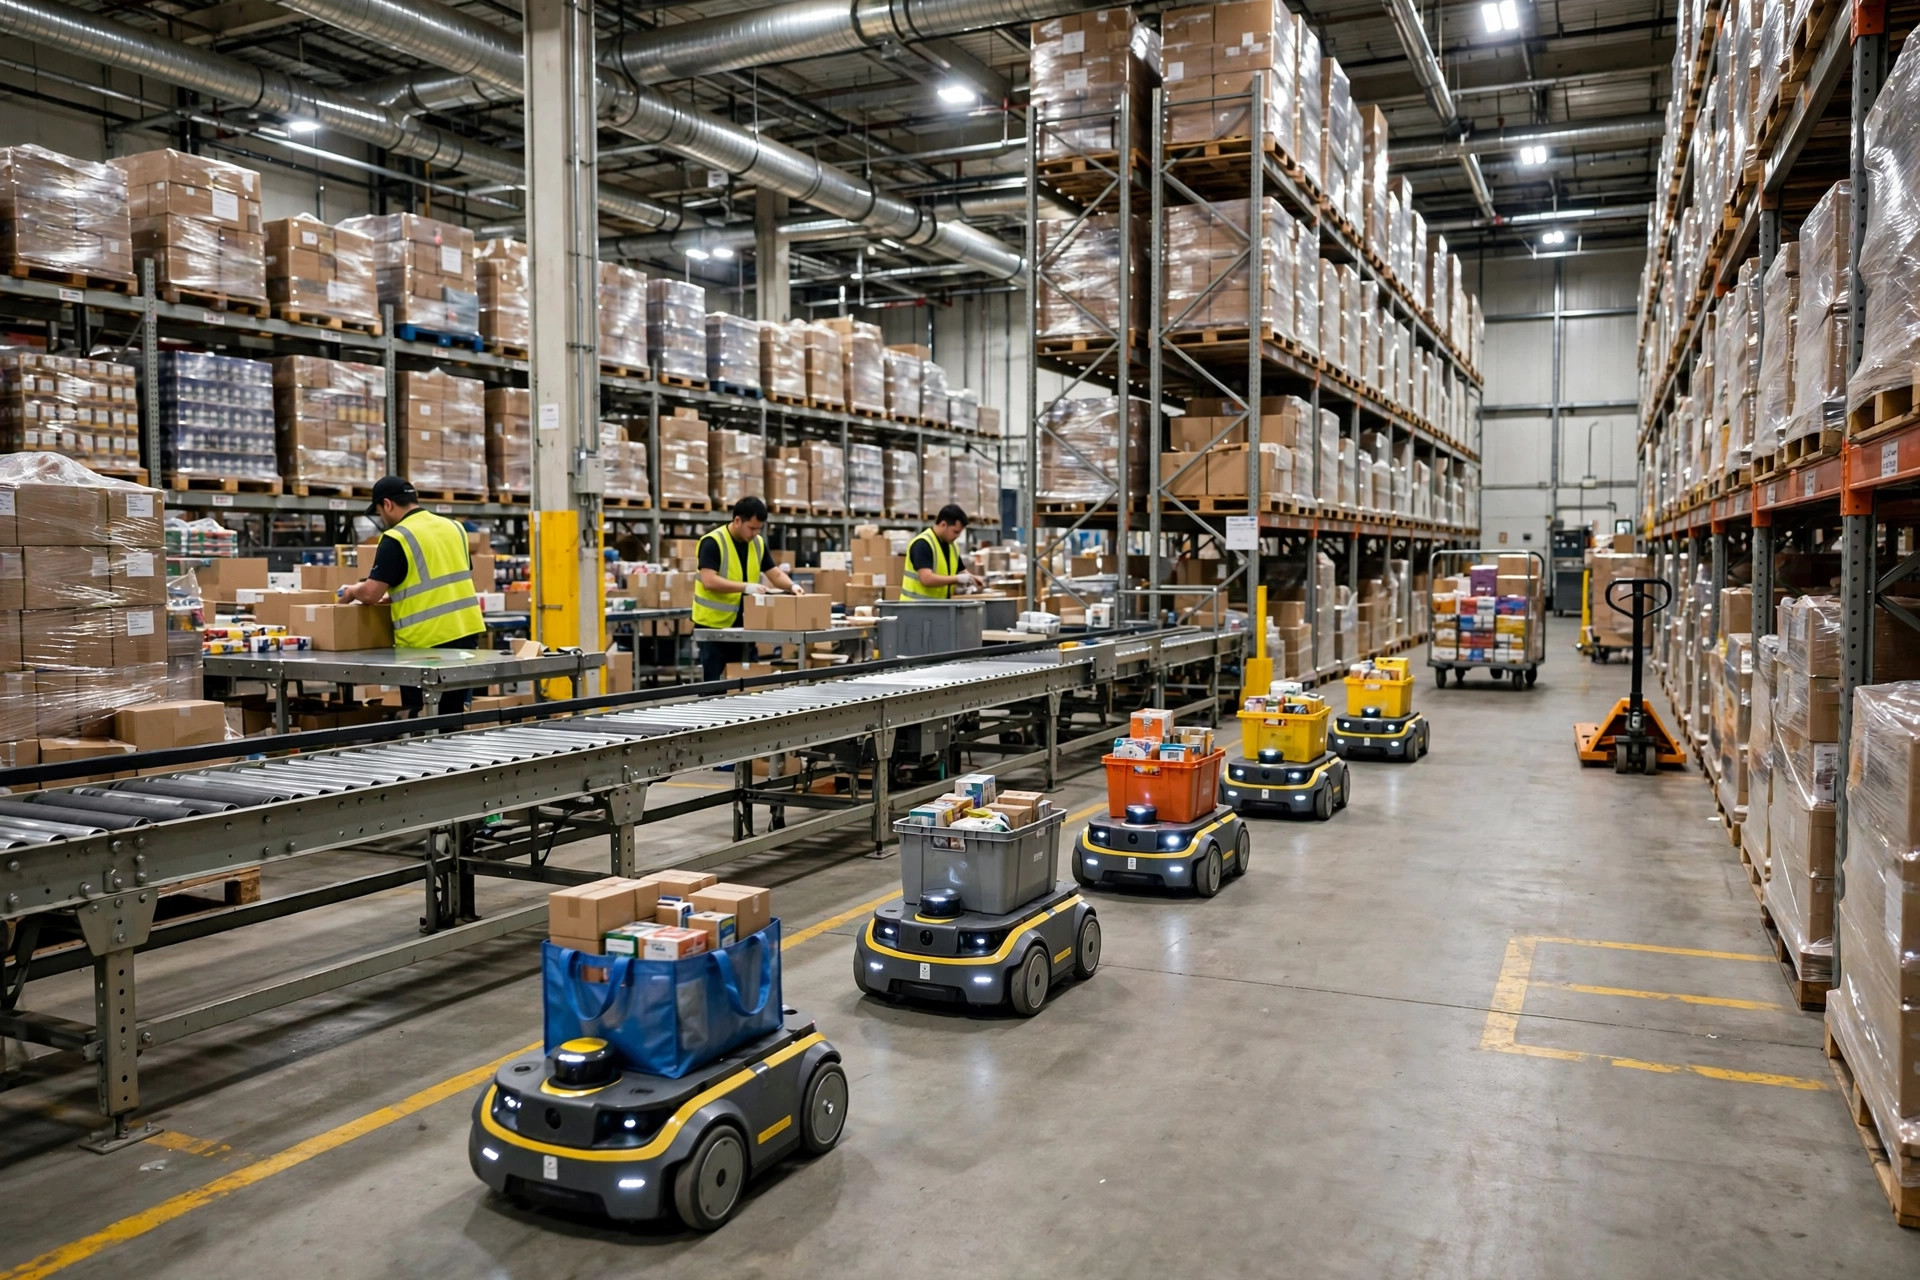
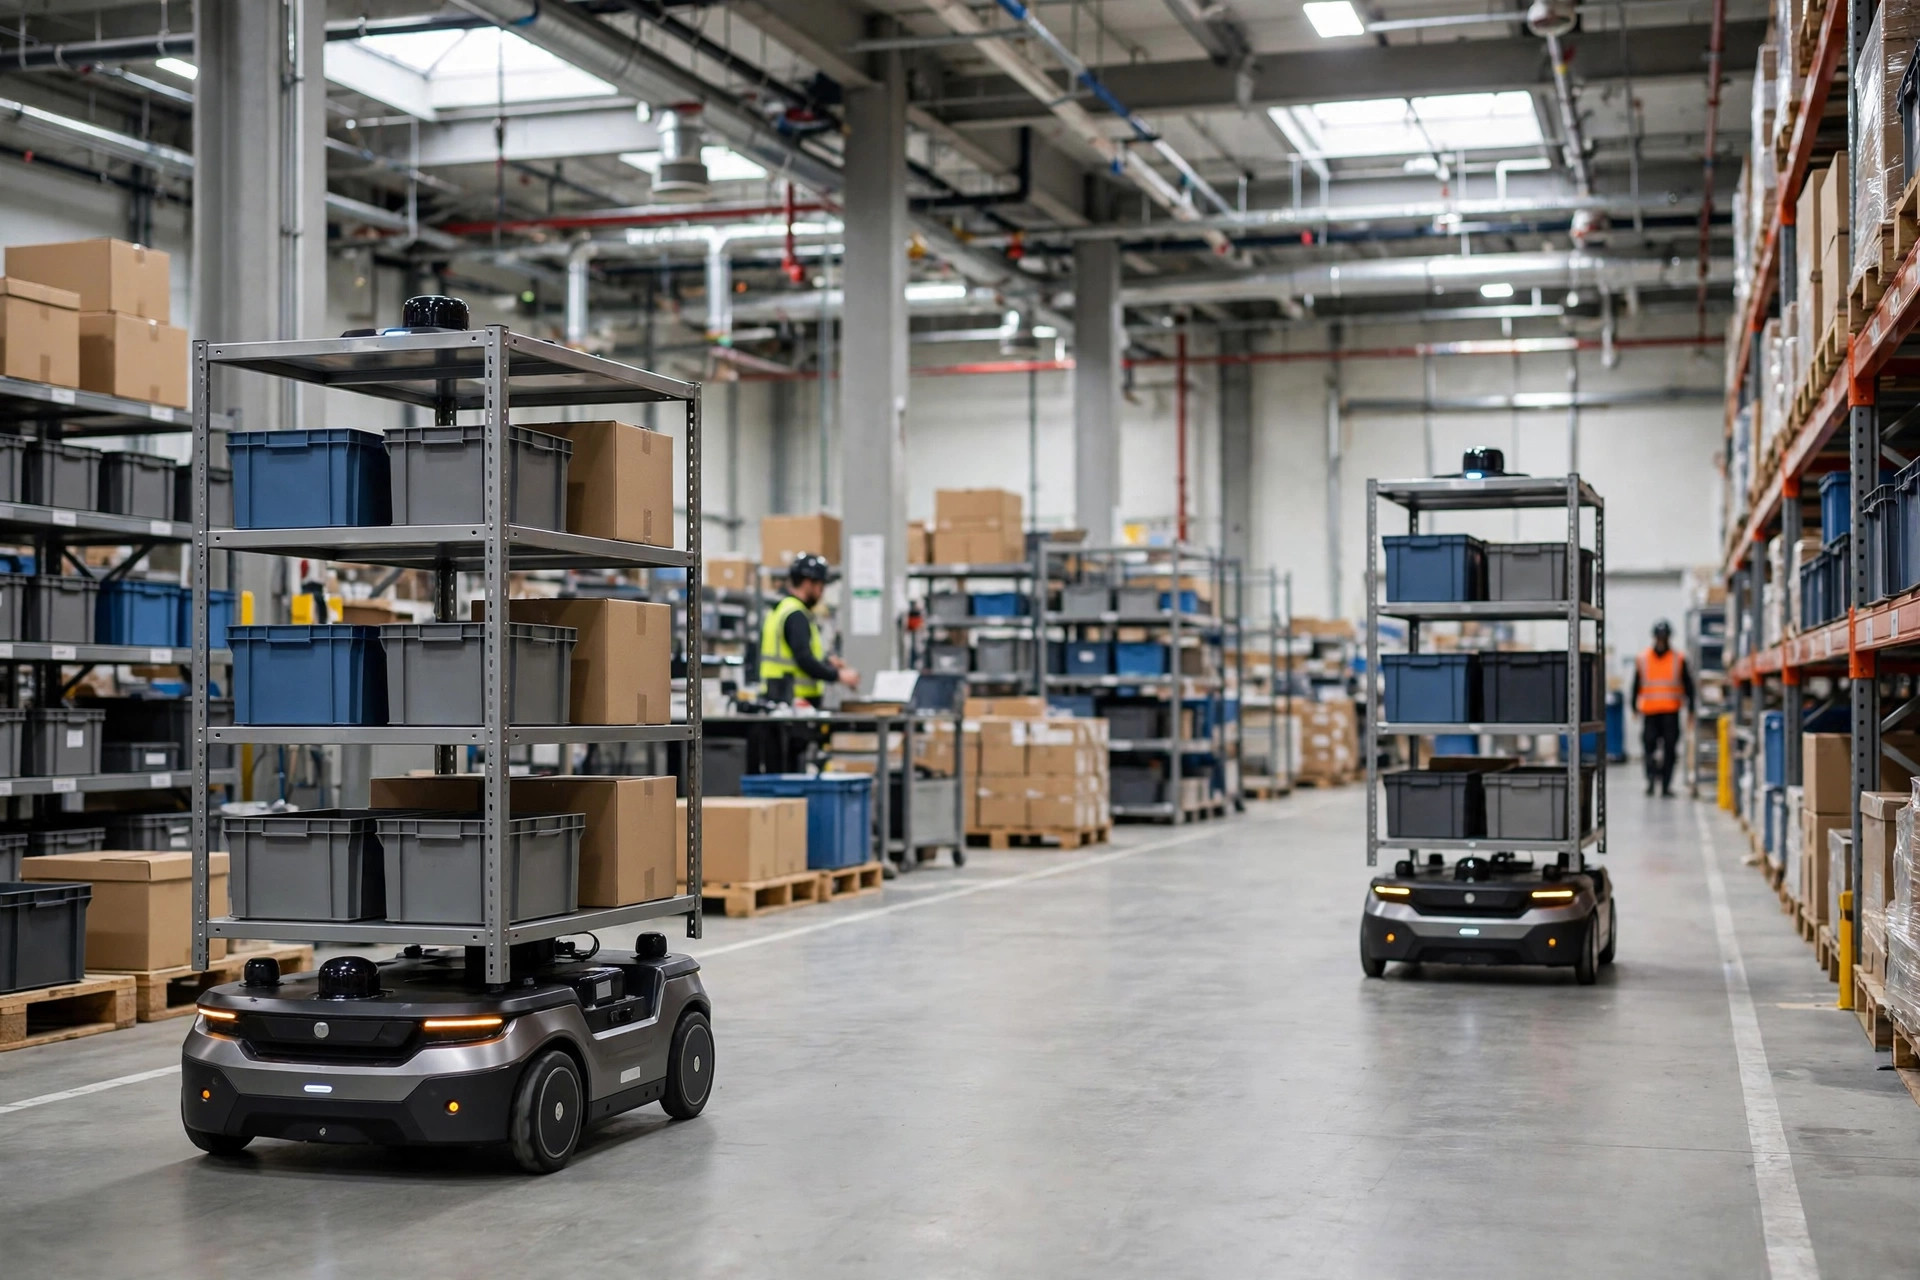
In March 2024, the 3PL warehouse we use in Ontario, California rolled out a 24-bot AMR goods-to-person system for our inventory. I still keep the integrator's model on file: 8,000 orders a day, 90% warehouse automation utilization rate, pick labor cut from 40 heads to 18, about $700K a year in labor savings against a $1.8M equipment investment. Payback: 2.6 years. I signed thinking I'd found a bargain.
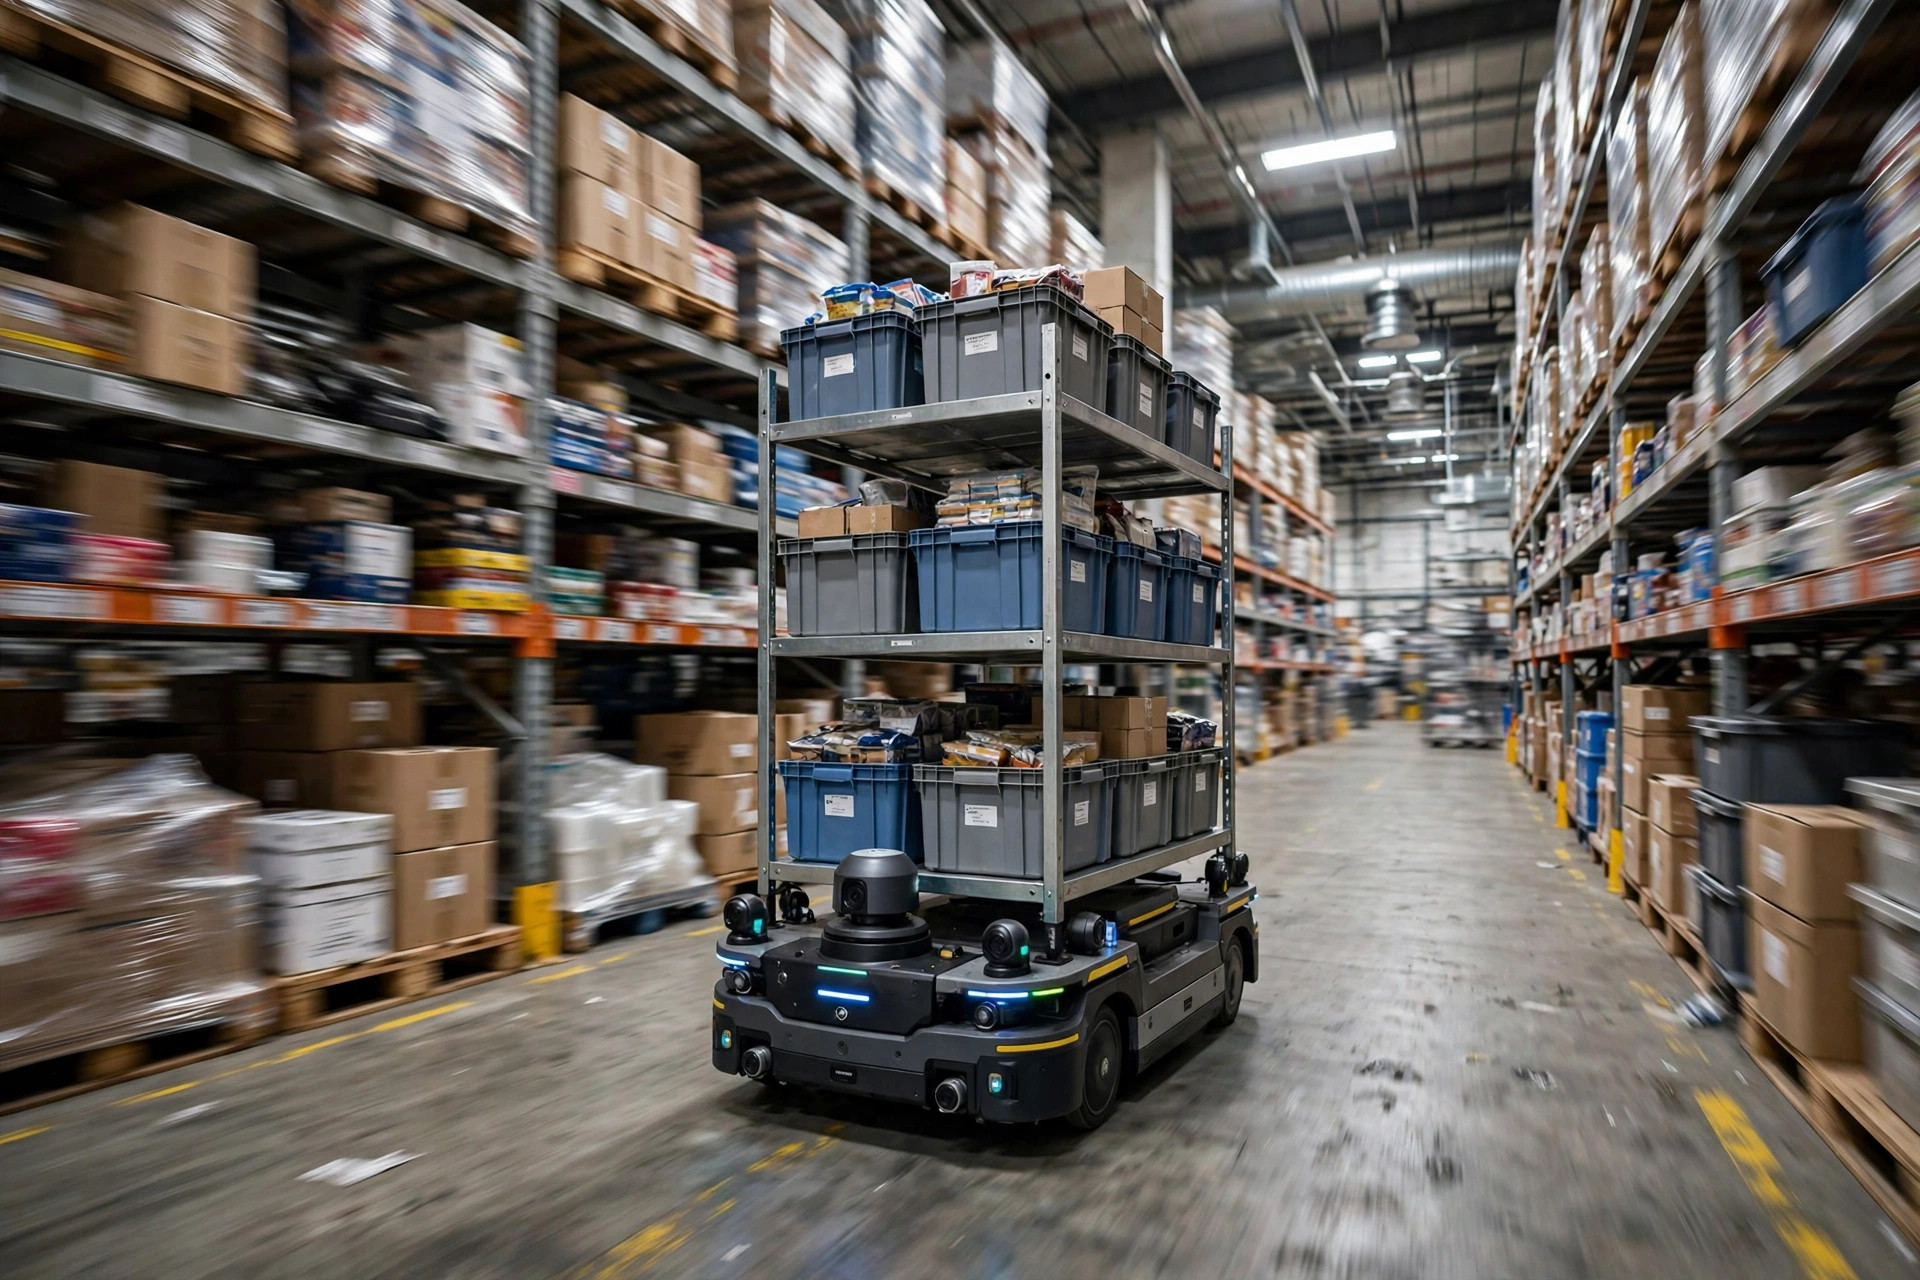
Reality? Q4 2024 peak season was genuinely sweet — utilization hit 85%, pickers loved it. Then January 2025 arrived, orders fell to 3,000-3,500 a day, and half of the 24 robots spent their days parked at the charging stations. The warehouse automation utilization rate dropped to 45-55%. And the labor never actually got cut: the 3PL added two equipment maintenance techs, pick rates wobbled, and peak season still needed temp workers. Recalculated on actual utilization, annual savings came to around $350K. Payback stretched past 5 years.
Trap #1: Utilization Rate Modeled at Peak Season, ROI Breaks in Off-Season
This is the most common trap.
What order volume do integrators plug into the model? Nine times out of ten, it's peak season — or "design capacity." Our 8,000-orders-a-day figure was extrapolated from Black Friday week 2023. Out of twelve months, only October through December ever hit that number. The other nine months ran at 40-60% of peak.
Here's the thing every seller learns the hard way: utilization follows your orders, not your equipment. No orders, no utilization. A $1.8M fleet of robots sitting at chargers generates exactly zero ROI.
The fix is one sentence: make the integrator re-run the ROI on your off-season average order volume before you sign anything. I tested this myself — after the re-run, our second warehouse's AMR proposal dropped from 24 bots to 14, saving nearly half the investment.
Trap #2: "Running" Is Not Producing — the Utilization Number Has Water in It
Even with enough orders, the utilization number itself has water in it.
During Q4 2024 peak, our dashboard showed 85% AMR utilization and I felt pretty good about it. Then I sat down with the 3PL's ops manager and reconciled the numbers: inside that 85%, empty runs, queueing for tasks, and trundling back to chargers all counted as "running time." Actual loaded travel time was barely above 60%.
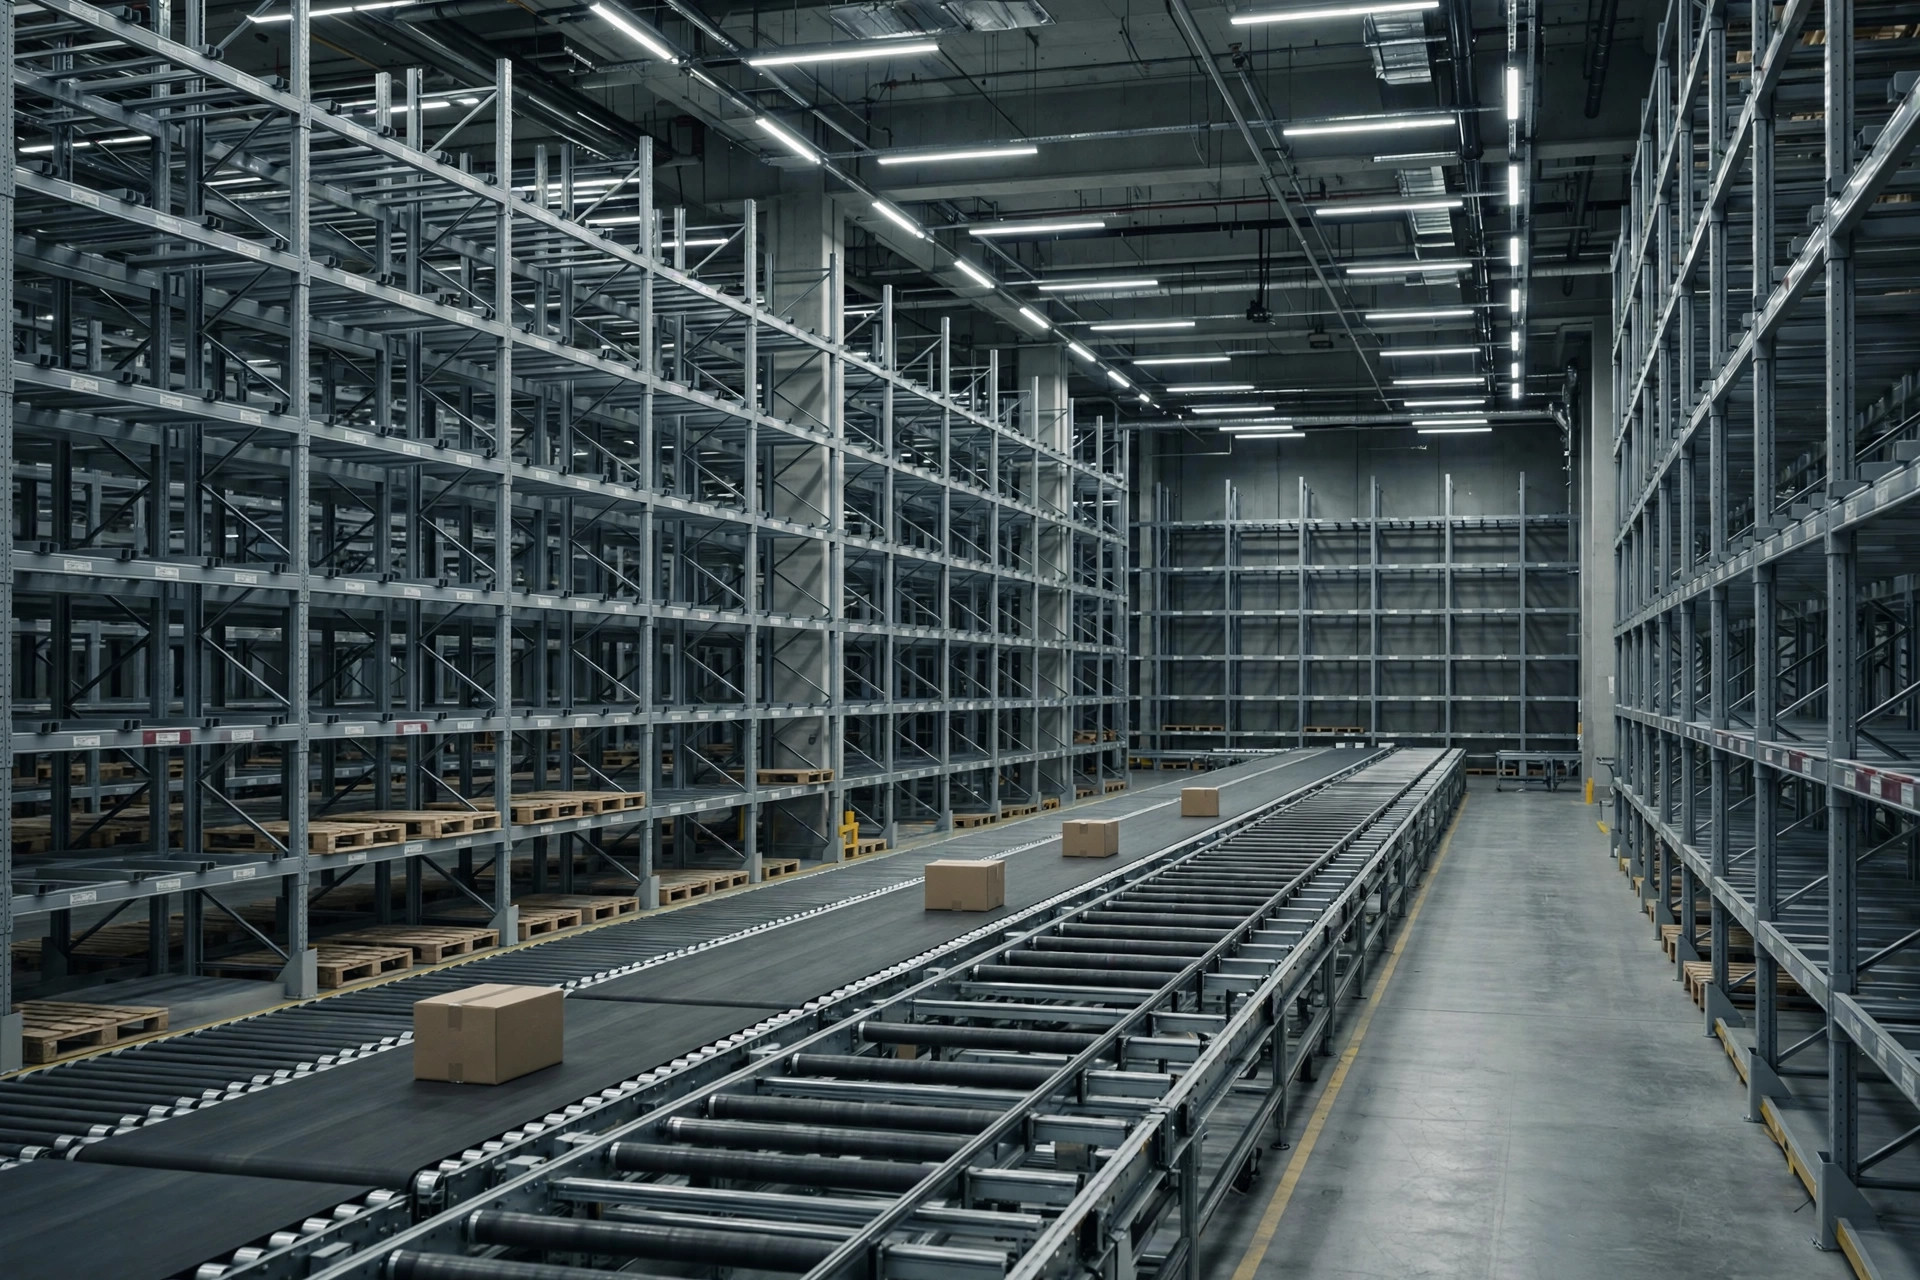
Worse is when your SKU mix changes. My buddy Lao Chen installed a 60-meter conveyor sorter in his New Jersey warehouse in 2023: modeled at 5,000 units a day, 85% utilization, 2.8-year payback. In 2024 his main category got throttled by the marketplace — you know how it is, Amazon changed the rules again — and he pivoted to bulky home goods. The sorter can't handle oversized items. Actual utilization has sat around 40% ever since, the line half-idling.
Here's the counter-intuitive take: low utilization doesn't always mean you bought the wrong equipment. Chen's line is mechanically fine. What broke was the original assumption that "SKU mix stays constant." When your order profile changes, even great equipment can't run full. Before signing, ask yourself one question: if my category mix changes next year, does this system still fit?
Trap #3: The Heads You "Saved" Never Left
The biggest line item in any automation ROI is always "labor savings."
Our model said 40 pickers down to 18. Reality? Fewer pickers, sure — but two new equipment maintenance techs, one exception handler, and night shifts still staffed for monitoring. Peak wobble? Temps, as always. And on the 3PL invoice, a shiny new "automation service fee" line quietly ate back half the labor savings.
My advice: don't count "heads saved." Count whether your total monthly labor-plus-service spend actually went down. One year after go-live, our warehouse's total labor cost was down about 30% — nowhere near the modeled 55%.
The Numbers: Payback at 90% vs 50% Warehouse Automation Utilization Rate
Same $1.8M investment, our California warehouse's real books:
| Utilization | Annual savings | Payback |
|---|---|---|
| 90% (integrator's model) | ~$700K | 2.6 yrs |
| 70% | ~$550K | 3.3 yrs |
| 50% (our actual off-season) | ~$350K | 5.1 yrs |
| 40% | ~$280K | 6.4 yrs |
See the pattern? Utilization dropping from 90% to 50% doesn't "add two years" — it doubles the payback period. Every 10 points of utilization you lose makes the ROI uglier. That's exactly why integrators insist on modeling at peak: run it at off-season volume and the ROI never gets signed.
3 Things To Do Before You Sign
- Make them re-run the ROI on off-season volume. The peak-season version is for looking at; the off-season version is your real payback.
- Put utilization guarantees in the contract: miss the promised utilization rate and the final payment gets discounted, or the free maintenance period extends. An integrator who won't sign it doesn't believe their own model.
- Rent before you buy. Lease AMRs for three months across one full off-peak stretch; only buy when the data looks good. That's what we did at warehouse number two — 14 bots, honest utilization numbers, then we committed.
Automation itself isn't the problem. The problem is an ROI built on a watered-down utilization rate. Get the denominator honest, and the ROI gets honest.
Tested it myself — after re-running the numbers on off-season volume, we spent nearly $800K less on the second setup. I sleep better now.
By Ah K, E-commerce Seller (5 yrs)