"Three-year payback." Every automation vendor's proposal ends with that sentence.
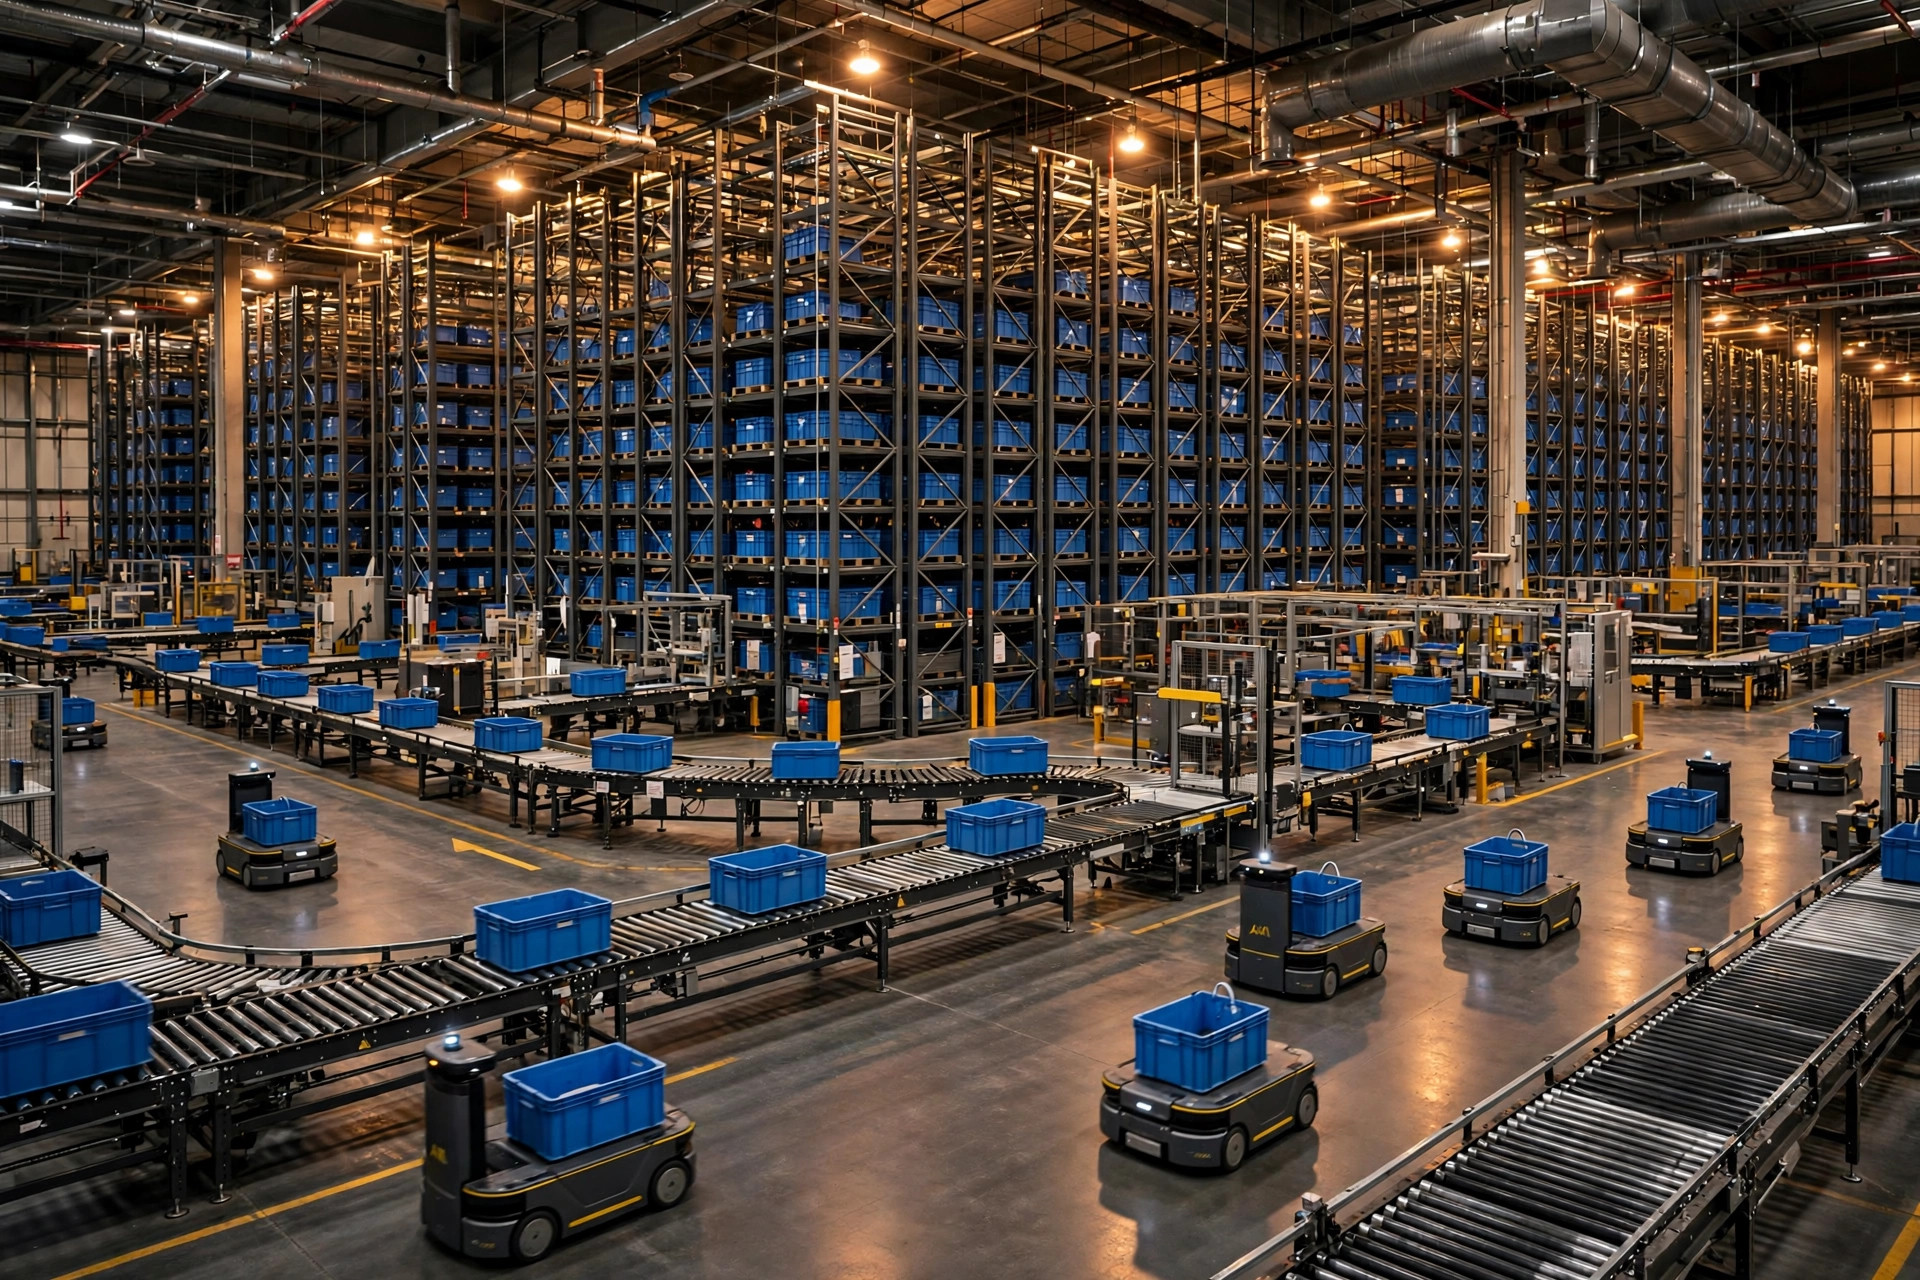
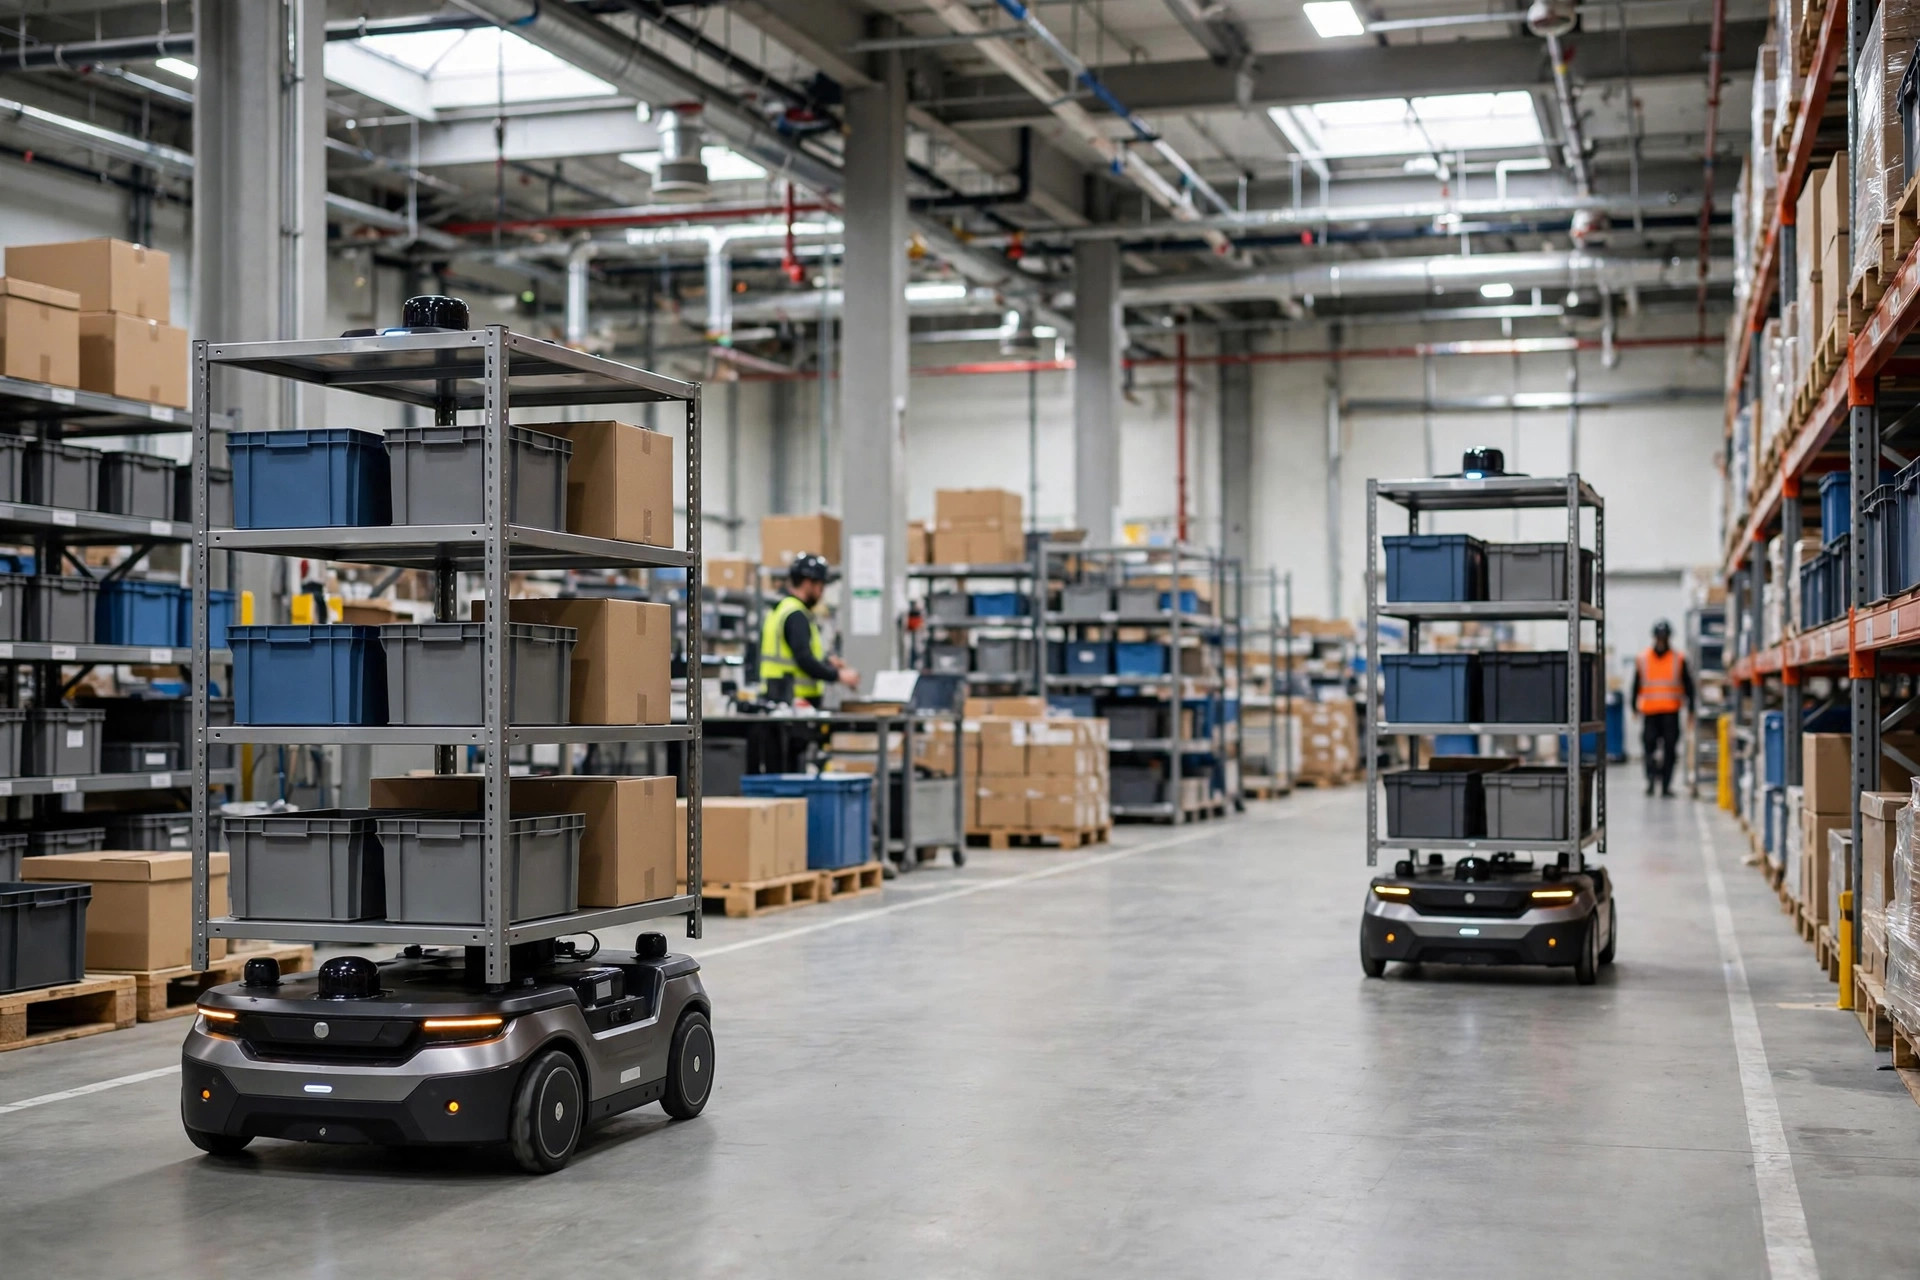
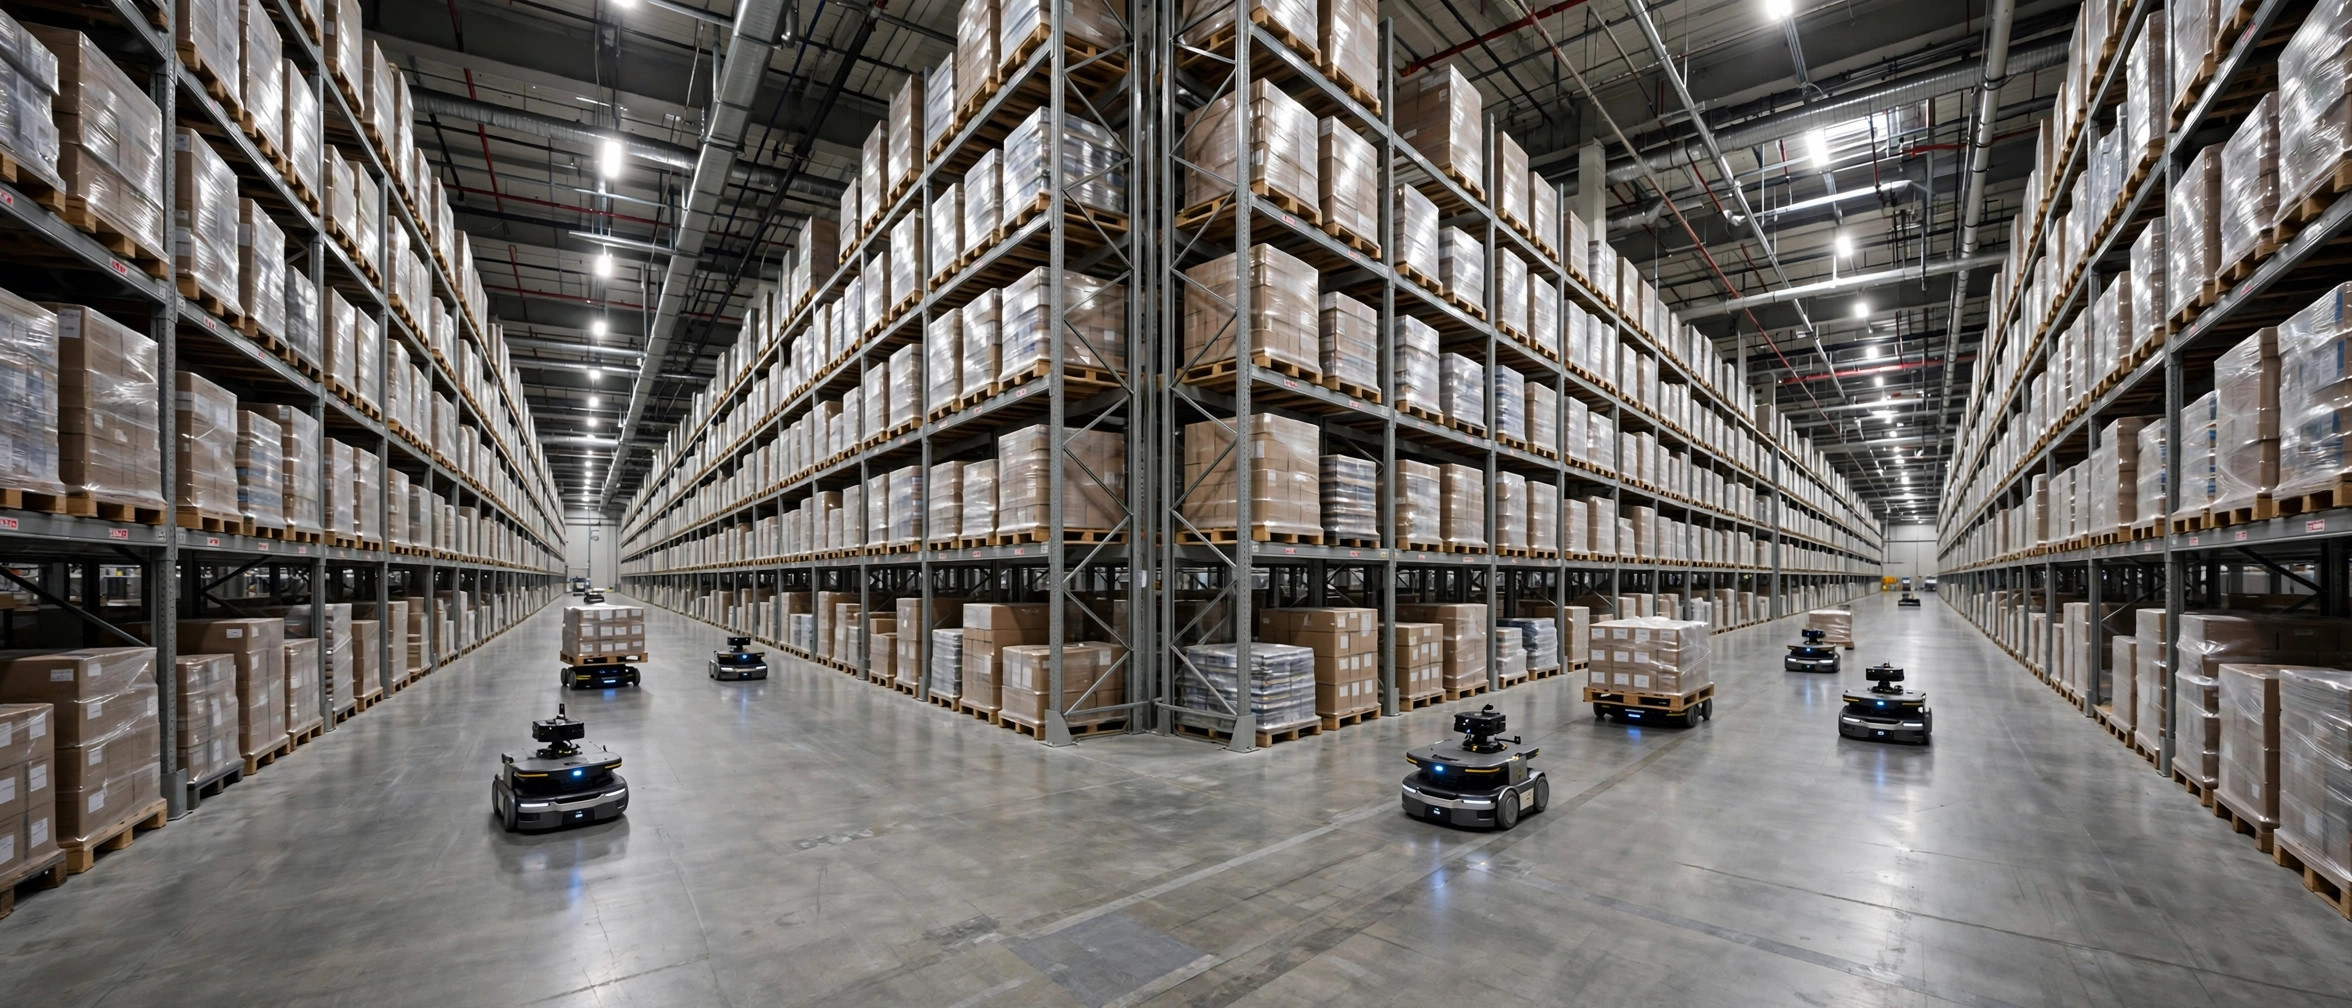
In 2024 I followed a project for a third-party warehouse in Southern California: AMRs for transport plus goods-to-person picking stations. The vendor's ROI model was clean and precise — about $2.8 million in, $1 million a year in labor savings, $80k in maintenance, payback in 3.0 years. The owner signed. A year and a half after go-live, I re-ran the numbers against actual operating data: 5.6 years, drifting toward six. The equipment wasn't bad — it really did save labor. The problem was in the math: the vendor's spreadsheet contained three optimistic assumptions, and each one shaved the payback period down a notch.
The vendor's version of the bill
The figures below are an illustrative example for the calculation, not industry statistics.
A 100,000-square-foot picking operation, $2.8 million in automation — roughly $2 million for the equipment itself, $500k for systems integration and process rework, $300k for civil and network upgrades. The vendor's math usually runs like this: 28 fewer workers × $36k fully loaded each = $1 million in annual labor savings; annual maintenance at 3% of equipment cost = $84k; net annual benefit of about $920k; payback 2.8M ÷ 920k ≈ 3.0 years.
The arithmetic checks out. All three inputs don't.

Pulling the three assumptions apart
Assumption one: 85% equipment utilization. Vendor models assume the system runs hot, as if every day were peak season. Real warehouses have real seasonality. November and December — Black Friday, the holiday rush — the equipment runs flat out. But for the other nine months, half-empty picking stations are normal. Weight three months at 90% against nine months at 50%, and annual utilization lands around 60%.
Hidden inside this is the most expensive error in the whole ROI: you pay for peak capacity but earn back at average utilization. Sizing follows peak throughput, the money goes out the door on day one, and depreciation runs all twelve months — nobody discounts your idle time. A 25-point gap in utilization means the labor savings get the same haircut: from $1 million down to roughly $700k in year one, growing at the local wage rate.
A real case: that Southern California 3PL in 2024. The vendor modeled 85% utilization against peak throughput. I pulled the full year of order data from the WMS after go-live — actual utilization was around 60%. The temp labor they avoided was 40% less than projected. That's where the payback period started slipping.
Assumption two: wage growth of 5% and up. Labor savings compound year over year, so vendors love setting annual wage growth at 5% or even 6% — it makes the far-year "savings" swell nicely. In reality, California's minimum-wage increases arrive through legislation, and actual frontline warehouse wages have been growing at roughly 3 to 4% a year — higher in some years, but the long-run average doesn't reach 5%. Overestimate by two or three points every year, and compounding inflates the far-year benefits by more than 20% over five years.
The fix is simple: don't take the vendor's number. Use the median growth rate of local minimum wage or actual frontline warehouse wages over the past ten years. In this example, 3.5%. One more caution: turnover-driven hiring and training costs, and overtime volatility in peak season, are effectively zero in vendor models. If you want to be strict, the number gets more conservative still.
Assumption three: maintenance at 3%. The most dangerous of the three. The vendor's 3% usually covers only the basic service contract. Spare parts, system upgrades, and the most expensive line of all — unplanned downtime, the overtime it forces, and SLA penalties — never appear in that spreadsheet. My experience: the true maintenance-related cost of an automated system runs at roughly 6 to 8% of equipment cost. This example uses 7%, or $196k a year, instead of the vendor's $84k.
I saw another one in 2023 — an e-commerce fulfillment site that signed a five-year full-service maintenance contract at 4% of equipment cost. Looked reasonable. At year-end the finance team discovered that three unplanned outages had cost more in overtime and late-delivery credits than the maintenance contract itself. The contract price was real. The full cost never made it into the table.
The three corrections side by side:
| Assumption | Vendor figure | Corrected figure | Effect on payback |
|---|---|---|---|
| Equipment utilization | 85% (full-load) | about 60% (season-weighted) | Labor savings $1M → $700k |
| Annual wage growth | 5–6% | 3.5% (historical median) | Far-year benefits de-inflated |
| Annual maintenance | 3% of equipment cost | 7% (downtime included) | Maintenance $84k → $196k |
Corrected math: $700k in annual labor savings (growing at 3.5%), $196k in annual maintenance, net benefit of about $500k. Payback: 2.8M ÷ 500k = 5.6 years. Three years becomes five and a half — and the extra two and a half are the price of those three assumptions.
The counterintuitive call
The same equipment pays back in five and a half years in Southern California and maybe seven in Nevada. The number-one variable in automation payback isn't throughput — it's your local labor price.
Once you see it, the decision is straightforward: the warehouses that should automate first are always the ones where wages are rising fastest and hiring is hardest, not the ones with the most orders. Where labor is cheap, the savings can't cover depreciation and maintenance, and the ROI never works — you'd be spending dollars to buy an experience. Where labor is expensive, the math can hold even at 60% utilization. Automation investment always has to be modeled against the local labor market. An equipment ROI detached from labor costs is a fantasy.
Beyond the three assumptions: three levers that actually move payback
Getting the assumptions honest is only the first half of the job. The second half is finding the levers — the same equipment can swing payback by a year or two.
First, monetize idle capacity. The equipment was bought for peak; off-season picking stations sit half-empty. That doesn't mean they have to sit empty. I know a 3PL that rented idle picking stations to another e-commerce tenant in the same industrial park for peak-promo overflow, by the hour — it recovered the equivalent of 1.5% of equipment cost a year. Pushing utilization from 60% toward 70% can shave most of half a year off payback. Before signing the equipment contract, ask whether anyone nearby would rent your off-season capacity.
Second, negotiate downtime terms, not just price. The cheaper the vendor's maintenance quote, the harder you should look at response SLAs and downtime compensation in the contract. The best contract I saw: spare parts from a local depot within 24 hours, and hourly penalties for unplanned downtime beyond four hours. On maintenance, what's won at the negotiating table beats what's calculated in a spreadsheet.
Third, phase the rollout — transport first, picking later. AMR transport runs at stable utilization all year and typically pays back a full round faster than goods-to-person stations. Use the transport phase to prove your team's ability to operate the system, and add picking stations once the order profile is stable. Going all-in on day one is the most common starting point for a payback period that spirals out of control.
A conclusion you can calculate
Next time a vendor hands you an ROI model, don't sign until you've done four things: recompute utilization with two weighted rates — 90% for three peak months, 50% for the other nine; take local wage growth at the ten-year median and reject anything north of 5%; budget maintenance at 7% of equipment cost plus an estimate for downtime losses, and put it in the contract appendix rather than leaving it in the spreadsheet; and name the headcount — the 28 people saved are exactly which shifts and which roles, or they don't go into the model.
If that's too much work, remember the shortcut:
Corrected payback ≈ vendor payback × (vendor utilization ÷ your real utilization) × 1.15
Check it against the example: 3 × (85% ÷ 60%) × 1.15 ≈ 4.9 years — within a stone's throw of the detailed 5.6. Rule of thumb: multiply the vendor's payback period by 1.5 to 1.7, and you get an honest number.
By Lao Zhou, Logistics Cost Analyst