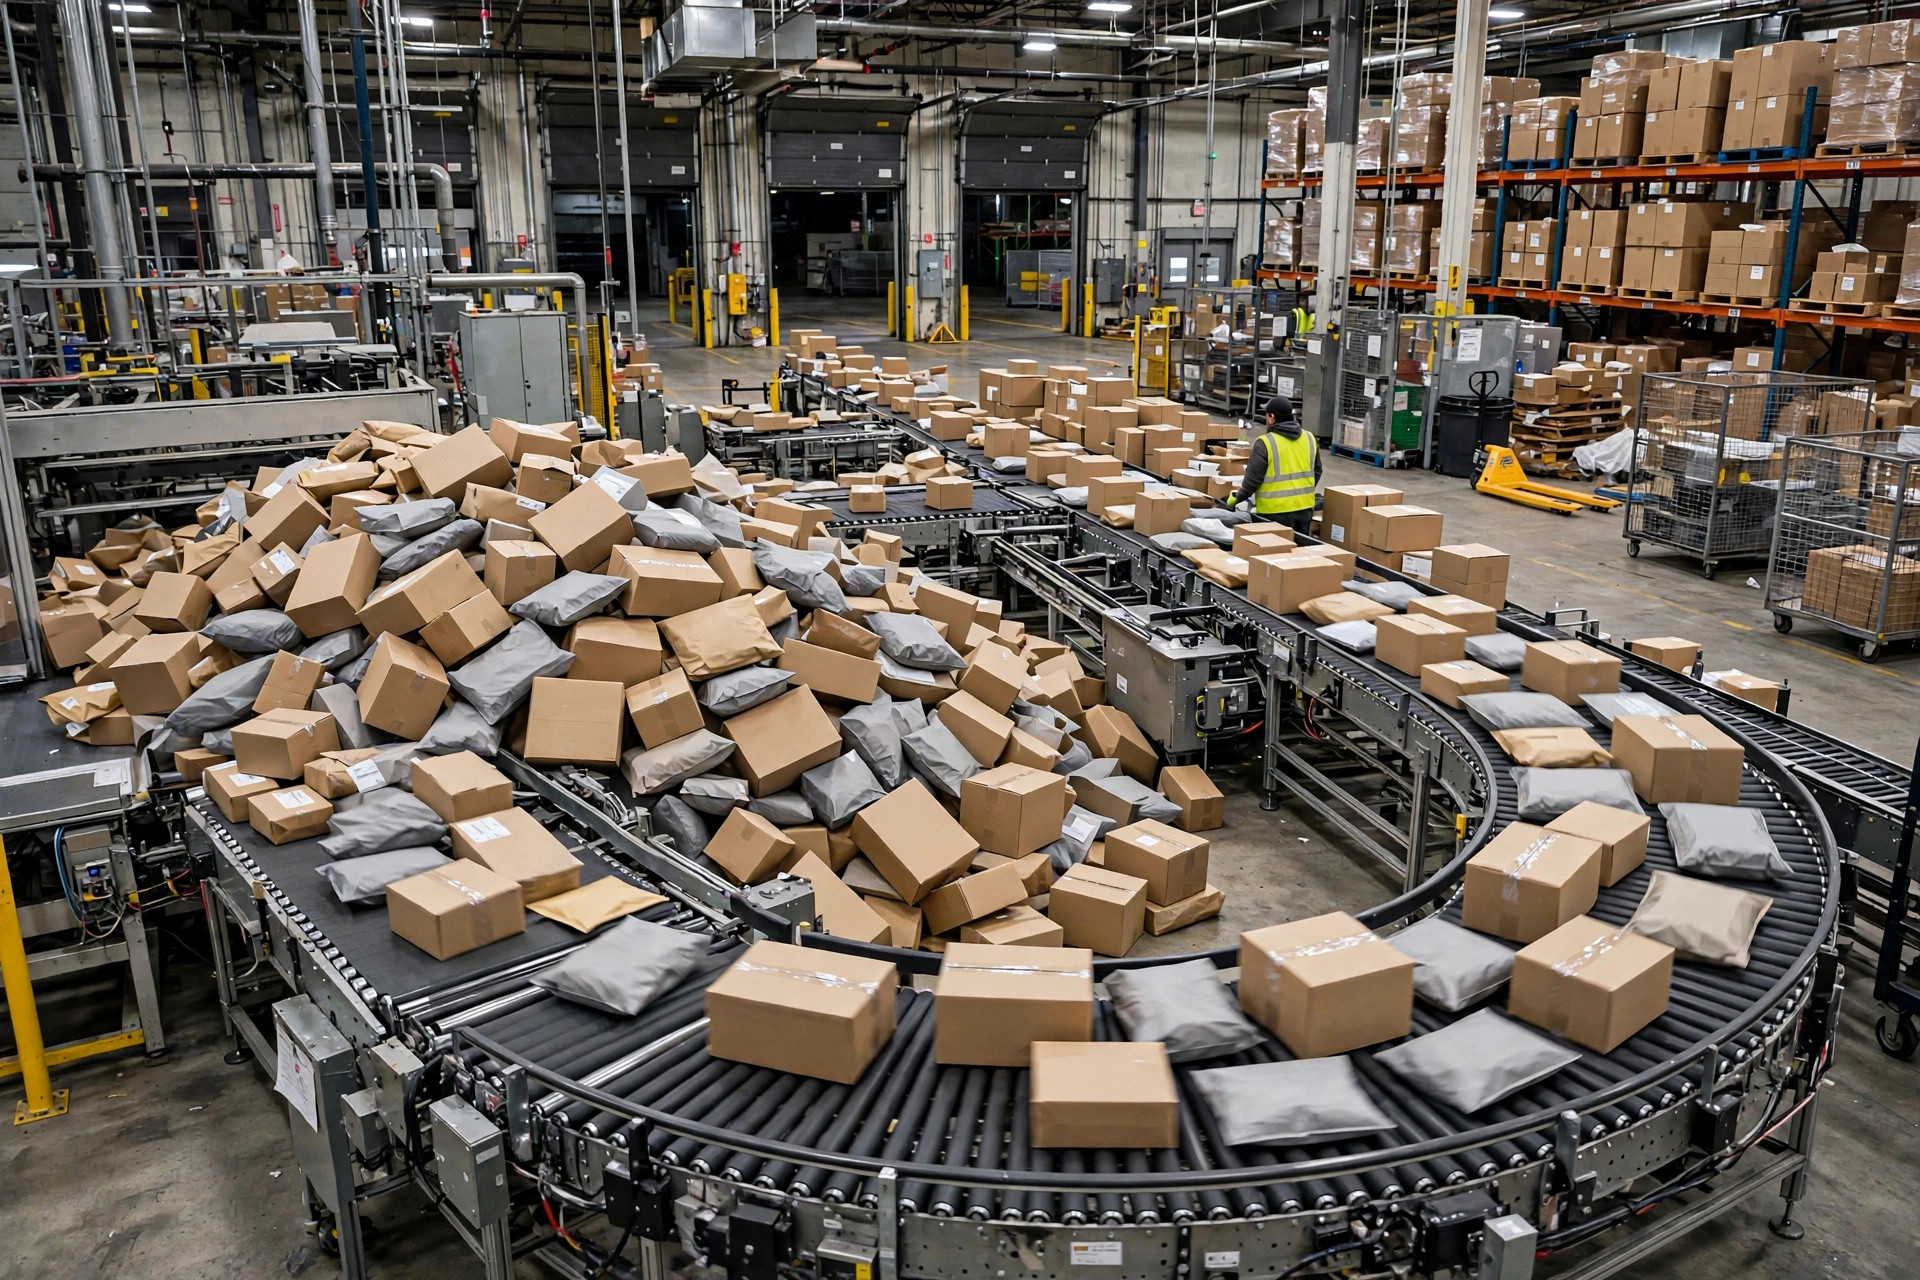
In November 2023, I walked into a 3PL warehouse in Ontario, California, and saw a brand-new cross-belt sorter buried under a mountain of parcels. The system was rated at 9,000 units an hour and had been live for four months. On Black Friday it choked by 2 p.m. — cartons piled waist-high in front of the chutes, trailers queued at the dock doors waiting to load. For three days the crew hand-sorted freight on the floor next to a multimillion-dollar machine. The overtime bill alone would have covered half the cost of sizing the system correctly in the first place.
The root cause wasn't the equipment. It was the number on page one of the proposal: average daily volume.
The Average Is a Comfortable Lie
Average daily volume feels solid. It is also one of the most misleading numbers in warehouse planning. E-commerce demand does not arrive in a neat bell curve — it arrives in pulses. A building doing 20,000 orders on a normal day can do 80,000 on Black Friday, with a handful of 40,000–50,000-unit promo days scattered through the year. Size your automation for the average and you get a system that works beautifully eleven months a year and collapses in the twelfth.
Worse, breakdowns never happen on "average" days. They happen in peak hours. Sorter capacity is an hourly number: 9,000 units an hour means a single hour at 12,000 units starts a backlog. And backlogs do not clear themselves — they snowball. Chutes fill, freight recirculates, people intervene, and effective throughput falls off a cliff.
So step one: delete "average daily volume" from your spec. Replace it with two numbers — required peak-hour throughput, and how long the peak lasts.
Measure Your Own Peak Factor
Proposal decks love the phrase "designed for 3x peak." Where does that 3x come from? Usually thin air. Your peak factor has to come from your own data, and the method is straightforward.
Pull two to three years of outbound data from your WMS, aggregated by hour. Find the highest-volume days each year, then take the busiest consecutive four-hour window on those days. Divide that by your average hourly volume — average daily orders divided by operating hours. That is your peak factor.
In my experience, US e-commerce warehouses in beauty, consumer electronics, and apparel usually land between 3x and 5x. Do not just borrow that range — an auto-parts operation has a completely different promo rhythm than a baby-products one. I have seen the extreme end too: a beauty warehouse doing 8,000 orders on a normal day, spiking to nearly 60,000 overnight when an influencer featured a product. No equipment survives that kind of pulse — only a plan does. Two details people routinely miss:
Duration matters as much as height. A 4x spike lasting two hours is a different animal from a 4x plateau lasting three days. Short pulses can be absorbed with staging areas and deferred shipping. Long plateaus cannot — you need real capacity.
There is also the intraday shape. Eighty thousand orders spread evenly across the day is one problem; eighty thousand orders landing between 8 p.m. and midnight is a different one entirely. The latter can demand 30–50% more peak-hour capacity. One hourly order curve from your WMS tells you which one you have.
And do not forget the returns wave. Early-January reverse logistics crushes receiving and inspection, and that capacity deserves its own calculation.
Once you have the number, you can negotiate with integrators on facts. An integrator who never asks for your peak factor? File that proposal in the trash.

The Real Math: What Peak Coverage Actually Costs
Sizing for 100% of peak means equipment sunbathing ten months a year — ugly ROI. Sizing for the average means a three-day collapse that can cost more than the equipment delta. Here is how I frame the trade-off.
First, price the collapse. Late-shipment penalties, marketplace SLA fines, emergency overtime, the big customer who walks — convert it all to dollars per day. Most owners discover that a single day of peak-season failure costs more than several years of "redundant" capacity.
Then price the redundancy. Take the delta between "sized for average" and "sized for 80% of peak," amortize it over five to seven years of depreciation, and you have your annual insurance premium in black and white. Run it on that Ontario building: stepping the sorter from 9,000 to 12,000 units an hour, amortized over six years, costs a low six figures a year. Three days of Black Friday collapse burned several hundred thousand in overtime and penalties alone. You do not need to run that math twice.
My rule of thumb: size core equipment — sorter, main conveyor lines — for 70–80% of peak, and cover the rest with flexible labor and process buffers. Why that band? The very top of the peak usually lasts only a few hours, and buying permanent equipment for a few hours a year is the worst dollars-per-unit you will ever spend. But do not go below 70%: under that line, your "backup" labor becomes the main workforce, the floor turns chaotic, and you are back in Ontario.
One more verdict, for small operations: if you are under 5,000 orders a day, do not touch heavy fixed automation. Your absolute peak volume cannot carry the fixed cost. Put the money into your WMS, slotting optimization, and wave management instead — the returns are far better.
Flexible Labor Is Insurance — Buy It 90 Days Early
Labor backup is not a week-before-peak trip to the staffing agency. Real flexible capacity takes a quarter to build.
Hire temps early and train them early — they need at least a week working alongside veteran shifts before the surge. Plan staging areas in advance: overflow freight needs a home with location IDs and traceability, not a mystery mountain of parcels. Lock your wave strategy before peak: smaller, more frequent waves, so one giant wave cannot jam the whole line. And stock critical spares — belts, totes, scanner batteries. Waiting on parts in December is the dumbest downtime there is.
If you genuinely cannot afford the capacity, there is one more lever: shave the peak itself. Open presales two to three days early, split the promo into two waves, offer a small discount for 48-hour shipping tolerance. Demand management flattens peaks for an order of magnitude less than equipment. It works especially well for private-label brands, because you control the calendar.
Here is something you can do tomorrow: export two years of hourly outbound data from your WMS and calculate your peak factor using the method above. That single number is the starting point for every automation decision you will make next. Without it, every sizing conversation is guesswork.