The worst part of a big sale isn't failing to sell. It's selling a ton and then watching it all come back.
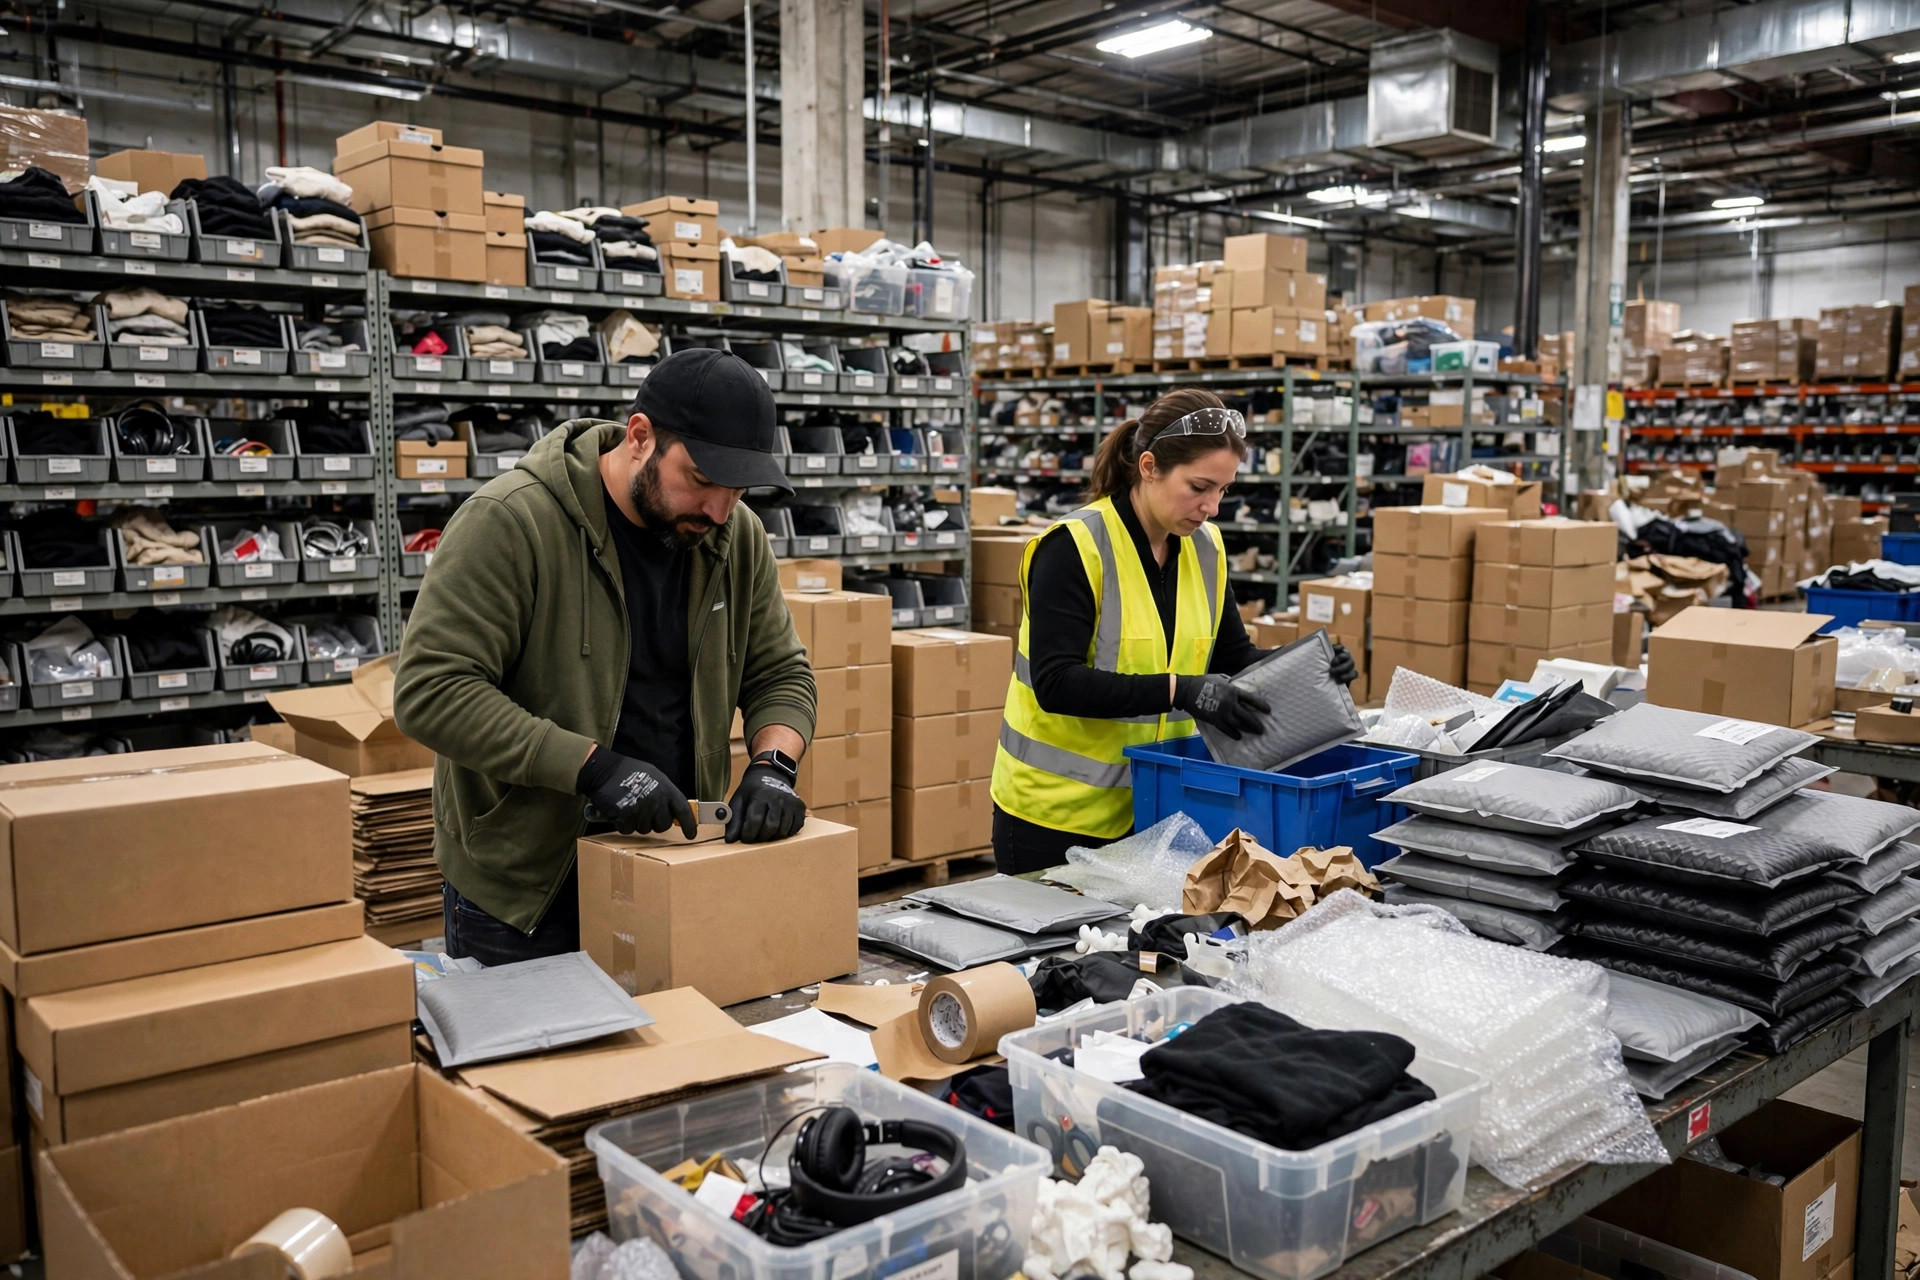
Every Black Friday, Christmas, and Prime Day, seller groups light up with revenue screenshots. Nobody posts what happens about ten days later: the returns tsunami. Boxes flooding your returns area, shelves overflowing, packing supplies gone, customer service drowning in "where's my refund" tickets. You're counting money on the front end while the back end is on fire.
I got burned twice before I learned: returns are predictable. No fancy models needed. A spreadsheet gets you started. Staff up two weeks early, clear your bins, stock your packing materials, and when the wave hits you'll just nod and say "there it is" instead of "we're screwed."
Last Black Friday, My Returns Area Drowned
Here's the disaster scene. Last holiday season I was selling apparel and small home goods on the US site. By late December my return rate kept climbing, and in the second week of January it hit 28%. Let that sink in: 28 out of every 100 units sold came back.
My returns area had 4 bins. Fine for a normal 8% return rate. Useless when returns tripled. Boxes piled up in the aisles faster than QC could open them. Staffing was the real killer: normally 2 people handled returns part-time, so I grabbed 3 warehouse guys as emergency help. It took two full weeks to clear the backlog.
I ran the numbers on those two weeks: overtime for the borrowed staff, rush-ordered packing supplies, and the slow refunds that triggered buyer complaints — 6 extra negative reviews. Those reviews alone cost me more than the overtime. And some returns sat so long the packaging got damp, killing any chance of reselling them.
Prime Day wasn't much better. That time I did staff up early, but I staffed wrong. I planned for total return volume and got slammed with oversized home goods. My small-item QC crew stared at giant boxes, helpless. Right headcount, wrong mix. Might as well have done nothing.
Two disasters, one lesson: the returns wave isn't a question of if. It's when, how many, and what kind. Data answers all three.
My AI Returns Forecast: A Spreadsheet Is Enough
Reality check first: you don't need machine learning. You don't need to buy some SaaS tool. My method is one spreadsheet, tuned once a year, running for three years now.
Step 1: Where the data comes from
Three sources, all free and sitting in your seller accounts:
- Your returns report — pull it weekly. Three fields only: return date, SKU, return reason. This is the core.
- Your order data — also weekly: units sold. That's your denominator.
- FBA returns report — if you use FBA, don't skip this. FBA return data lags 3-5 days, so remember that when you forecast.
Export all three, merge them into one weekly table: units sold per week, returns per week, return rate per week. Once you have a couple years of history, the pattern jumps out at you.
Step 2: How the forecast works
Returns have a natural lag: most buyers return within 7-30 days of purchase. So forecasting return volume is really just "sales from X weeks ago × the return rate for that week."
My formula is crude but works:
Returns in week N ≈ Sales in week N-1 × historical return rate + Sales in week N-2 × adjustment factor
How do you set the historical return rate? Look at last year's curve after the same event. If Black Friday week +2 ran at 22%, week +3 at 28%, week +4 at 19%, multiply this year's known Black Friday sales by those rates and you've got the wave's size and timing.
Here's how the three forecasting methods stack up:
| Method | What you do | Accuracy | Effort | My verdict |
|---|---|---|---|---|
| Gut feel | "Last year was rough, let's hire extra hands" | Random | Zero | The standard way to fail |
| Historical average | Use last year's returns as this year's forecast | Direction right, volume way off | 30 min in Excel | Fine for beginners |
| Lag regression | Sales × historical return-rate curve, rolling weekly | Usually within 10% error | 2 hrs to build + 10 min/week | What I use now. Tested and proven |

Step 3: Does it actually work?
Honest answer: year one, my error was 25%. But even that beat gut feel — at least I knew "roughly the second week of January will explode" and had temp workers lined up.
Year two I added two fixes: split return rates by category (apparel and electronics have totally different curves) and separated FBA from self-fulfilled. Error dropped to about 12%.
Before this year's Black Friday, I forecasted roughly 3,400 returns for the second week of January. Actual: 3,550. Error: 4%. I had scheduled 4 temp workers two weeks ahead, cleared 12 return bins, and stocked 5,000 return mailers. On wave day, I drank my coffee in peace.
The counterintuitive truth: accuracy is cheap, lead time is gold
Most people hear "forecasting" and think they need decimal-point precision. Dead wrong.
An 80%-accurate forecast two weeks early beats a 95%-accurate forecast one day early. Every time. Why? Because returns staffing, bins, and supplies all need to be locked in ahead of time. Temp workers need advance booking. Bins need clearing. Packing supplies take 7-10 days to arrive. Forecast perfectly with one day's notice and you still can't conjure people out of thin air.
My bar has always been: within 15% error, two weeks ahead. That's a perfect score. The remaining 15% gets absorbed by flexible labor — I book temps on "3 days guaranteed + extend as needed." Over or under, it balances out.
One more counterintuitive one: your lowest-return SKUs aren't your most profitable SKUs, but they're definitely your least stressful ones. I ran the numbers: SKUs under 5% return rate generate one-third the support tickets of high-return SKUs, and their negative review rate is a full tier lower. Picking products on margin alone while ignoring return rate is like counting revenue and ignoring cost. Now when I launch a product, I watch its return rate in month one. Over 15%? Delist and fix. No hesitation.
Pitfalls: I've hit all four
- Building the spreadsheet and never touching it again. The forecast table needs a weekly refresh — 10 minutes. During peak season, every 3 days. Data is alive, so your forecast has to be alive too.
- Forgetting FBA's data lag. FBA return reports lag 3-5 days. If you use lagged data to forecast "next week," you're really forecasting the week after. Keep FBA and self-fulfilled in separate columns. Don't mix them.
- Forecasting volume but not mix. That's the Prime Day lesson. Oversized returns and small-parcel returns need totally different labor and bins. My table now splits large/medium/small and forecasts each separately.
- Ignoring return reasons. "Wrong size" and "defective" are two different animals. The first means staff up. The second means your product is broken — if defect returns pass 8%, stop forecasting and go fix the product.
One last thing
Nobody will do this for you. Not the platform, not your service providers. AI returns forecasting sounds fancy, but in a seller's hands it's one spreadsheet and 10 minutes a week of discipline.
This January, while sellers in my group chat were wailing "my returns area is a mountain," mine ran like clockwork. Temps on schedule, supplies stocked. One word for that feeling: sweet.
This method is tested and proven — three years running. You can start tonight: pull last year's returns data by week, plot the curve, and the pattern will speak for itself. Don't wait for the next big sale. Don't wait until the wave is at your neck.
Tested by me, works for real. Give it a try.
By Ah K, E-commerce Seller (5 yrs)