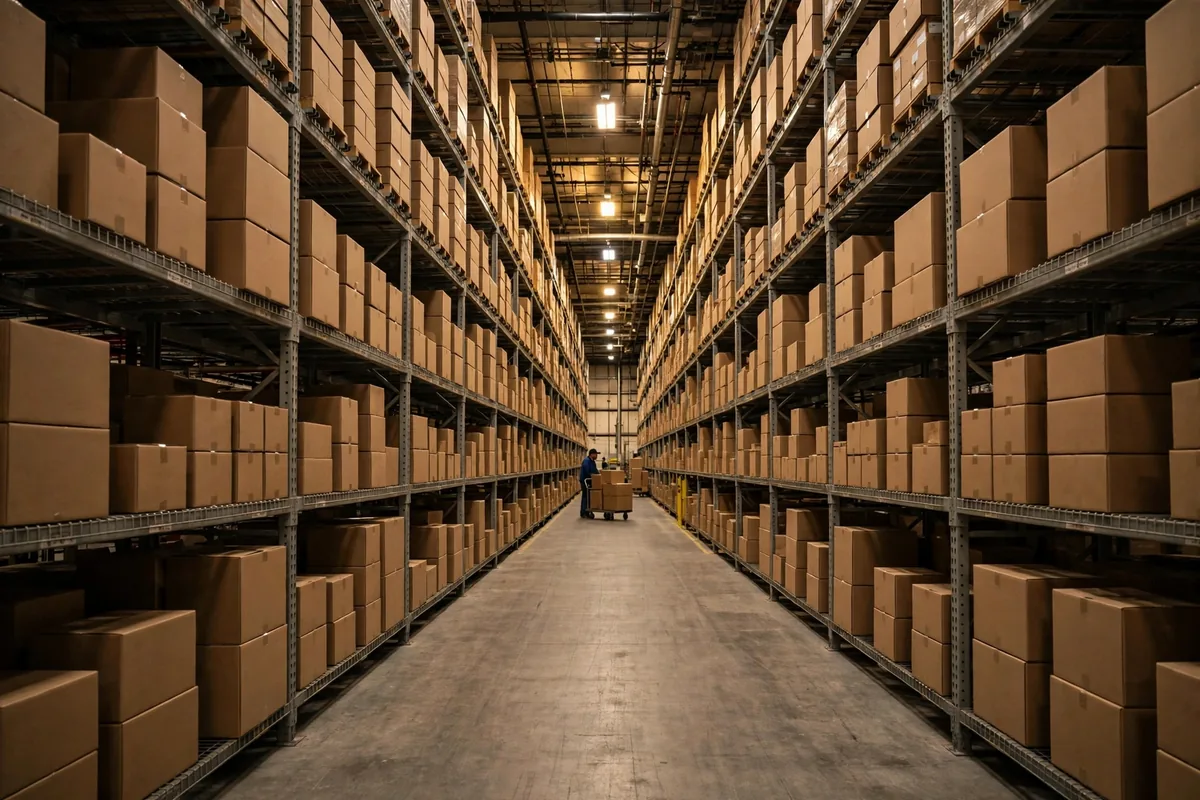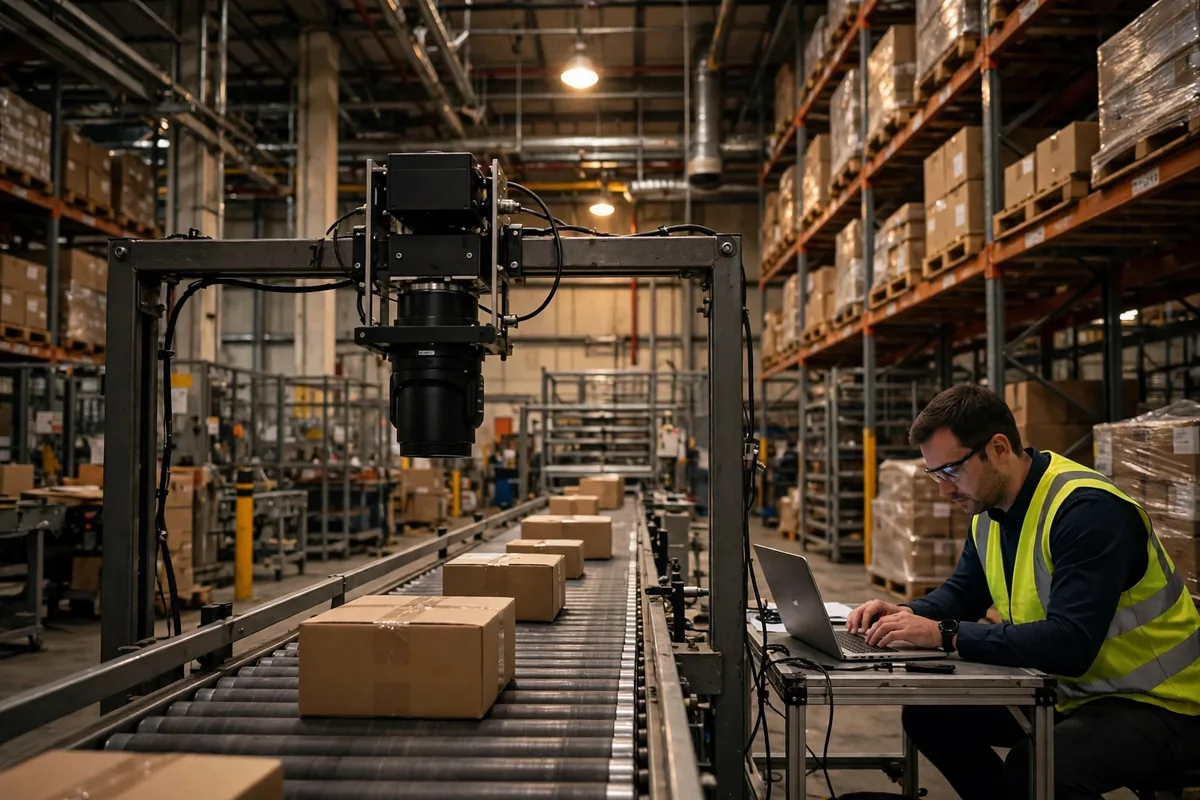
In September 2025 I managed to mess up in both directions at once. A storage bin went out of stock for 11 days right before Black Friday, while the ads were still running and converting. A hook I had stocked for 90 days sold less than a third of it in three months, and the rest is still sitting in the FBA warehouse racking up storage fees. Same demand forecast system, same history, one stockout and one pile of dead stock. My first instinct was to blame the model and buy a fancier AI forecast tool. Two weeks digging through my own order history changed my mind. The model had real flaws, but the data underneath it was worse.
After five years selling cross-border, I have learned to treat a bad forecast like a bad diagnosis. You do not just switch medicine. You figure out whether the problem is the input or the calculation, because fixing the wrong one wastes money and the shelves still end up wrong.
When a Demand Forecast Misses, Check the Data First
Take the storage bin. From July to August 2025 it sold about 1,800 units a month, so I stocked for Black Friday on that number plus a 20% buffer. Then an influencer push in late October moved more than 900 units in a single week and the listing went dark. The demand forecast still said 1,900 a month. It never saw the spike coming.
The history itself was bent. I had run two 30%-off promotions in July and August, and nothing in the system marked them as promotions. The sales looked like normal demand. Worse, we stocked out for six days in mid-August. Those six days recorded zero sales, and the system read zero as no demand. A promotion pushed the number up, a stockout pushed it down, and the average that came out described a product that never existed.
Returns did the same kind of damage in the other direction. One hook had a high return rate, and returned units went back on sale and sold again. The system counted two sales for one real customer. Stocking to that number meant stocking to demand that was never there.
I now check three things before I touch any model. Were promotions marked in the history, did any stockout cut the sales record short, and were returns counted twice? If any answer is yes, the demand forecast was doomed before the model ever ran. Bad data does not get better with a smarter model. It just gets calculated more precisely in the wrong direction.
FBA split shipments hide demand too. The same product sits in three warehouses, one runs out, and the shopper buys a competitor instead. That lost sale never shows up anywhere. You think demand is flat. In reality you closed the door yourself.
A one-off bulk order can bend the numbers the same way. In April 2026 a single customer bought 200 units of a shelf in one order. The system treated it as everyday demand and lifted the next month's forecast. I caught it only because I was reconciling orders by hand that week. Now I pull bulk and one-off orders out of the history before I look at any forecast.
The Demand Forecast Model Has Its Own Blind Spots
Clean data does not make a model trustworthy. The tool I used kept tripping over the same three things.
The first is averages. My bin sold about 1,800 units a month, which sounds stable, but weekly sales swung from 300 to 700 units. The model took the average and called it a day. I stocked to the average and stocked out in every strong week. For a seller, the question is not what you sell on average. It is what you sell in your strongest week. A demand forecast built on the mean looks neat on paper and fails in the warehouse.
The second is a cold start. In March 2026 I launched a new storage rack with no sales history. The model borrowed the category average and told me 1,200 units a month. The listing sold a dozen units a day for the first two weeks while the ads were still learning and the conversion rate was still low. I had stocked the first batch to the model's number and spent two months working through it. A new product has no history, so the model is only guessing. I now stock a new launch for 30 days only. I would rather restock often than sit on dead inventory.
The third is the seasonal turn. Storage products peak from September to November and dip in January and February. A model that smooths the last 12 months is always half a step late at the turn. In October 2025 it was still forecasting at summer pace while I was already walking into Black Friday. For a seasonal product, a model that cannot see the turn is at its worst exactly when accuracy matters most.
The common thread is simple. A model knows numbers. It does not know that you just launched a new ad campaign, that an influencer is about to post, or that you are clearing a line. It cannot see the business changing around it.
Fixing a Demand Forecast: Data First, Model Second
When a demand forecast misses now, I work in this order and I rarely waste a step.
Data comes first. I export the last three months of orders and check them against my promotion calendar, my stockout log, and my returns. Were promotions marked, were stockout days really zero, were returns double counted? Half a day here clears most problems. My bin was diagnosed at this step.
Volatility comes next. I do not look at the monthly average alone. I break sales down by week and compare the strongest week with the weakest. The wider the gap, the thicker the safety stock needs to be. My cover is no longer a fixed number. Volatile products get 45 days, steady ones get 30, and peak season adds another 15.
Only then do I look at the model. If I am thinking of switching tools, I ask three questions first: how does it handle a new product, does it recognise a seasonal turn, and what does it do with high volatility? If it cannot answer, I do not switch, however expensive it looks. That check has saved me from buying tools that would have made the same mistakes faster.
Data problems and model problems look alike until you put them side by side:
| Symptom | More likely a data problem | More likely a model problem |
|---|---|---|
| Forecast runs high, stock keeps piling up | Returns counted twice, promotion sales treated as normal | New product priced off a category average |
| Forecast runs low, stock keeps running out | Stockout days recorded as zero demand | Average used, peak weeks ignored |
| Forecast breaks every peak season | Promotions unmarked, history pulled up and down | Seasonal turn smoothed away |
| New product forecast is wildly off | No history to check against | Cold start treated as a real number |
The money is easy to count. Take my bin: 2,000 units a month, $6 cost per unit. At 60 days of cover I was holding 4,000 units, or $24,000 tied up in the warehouse. After cleaning the data and adding safety stock only for the volatile weeks, I cut cover to 45 days, holding 3,000 units. That is $6,000 less cash sitting on a shelf. A forecast does not need to be perfect. Fifteen fewer days of cover is real money. And the other side costs more than it looks: 11 days out of stock cost me sales, ad momentum, and weeks to rebuild ranking after the restock.
Amazon changes its rules again every few months, ad costs keep climbing, and there is less room to get stocking wrong. My rule now is plain: when a forecast misses, read the data first, look at the volatility second, and only then blame the model. Real data makes the model worth something. Where the model has a blind spot, I fill it by hand — extra stock before peak season, less stock for a new launch — instead of handing the whole decision to a tool that only knows how to average.
What was your last stocking miss, a stockout or dead stock? Pull that month's history and check the three spots: promotions, stockout days, and returns. One of them is usually unmarked.
By Ah K, E-commerce Seller (5 yrs)