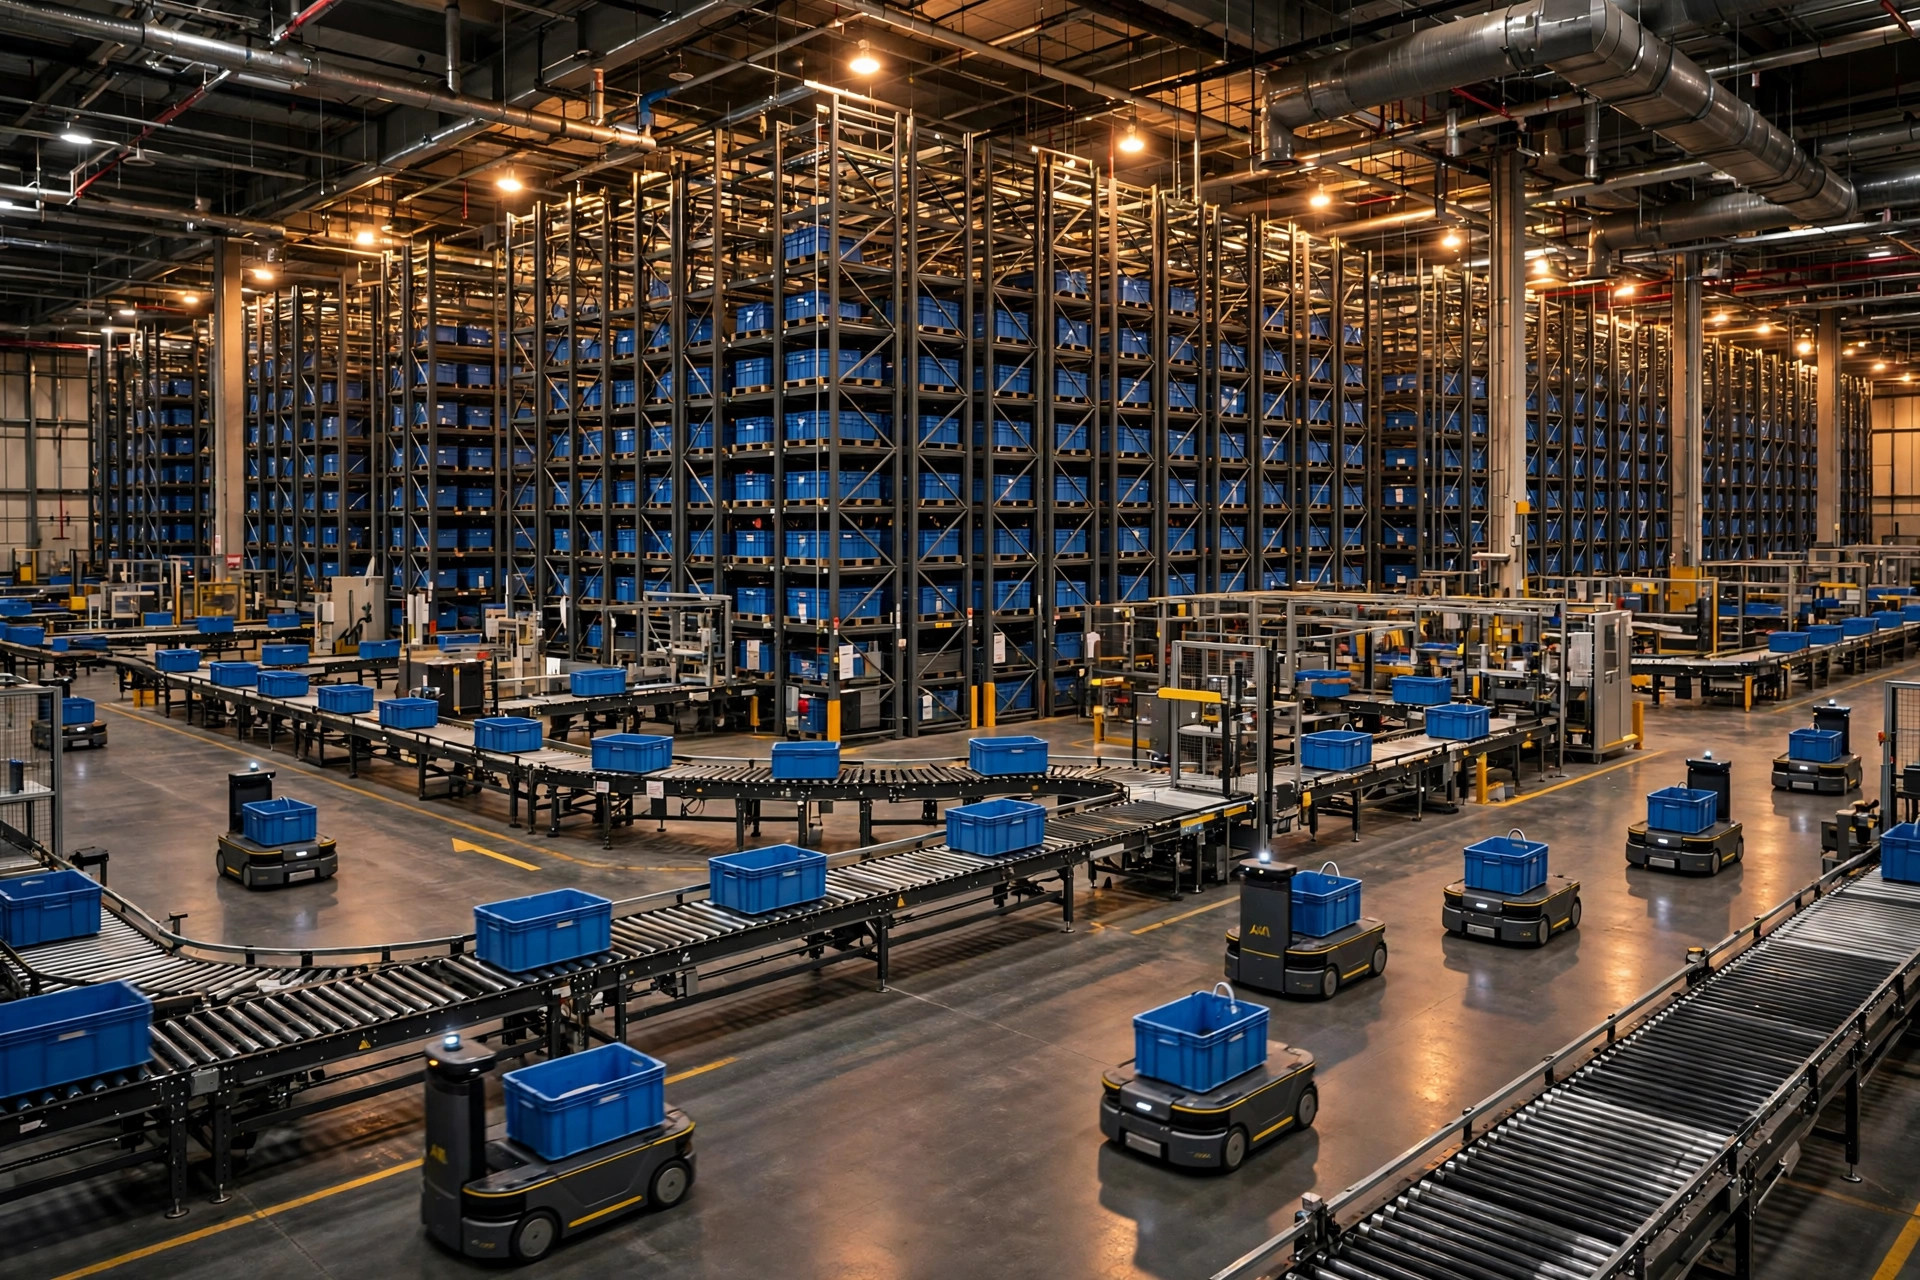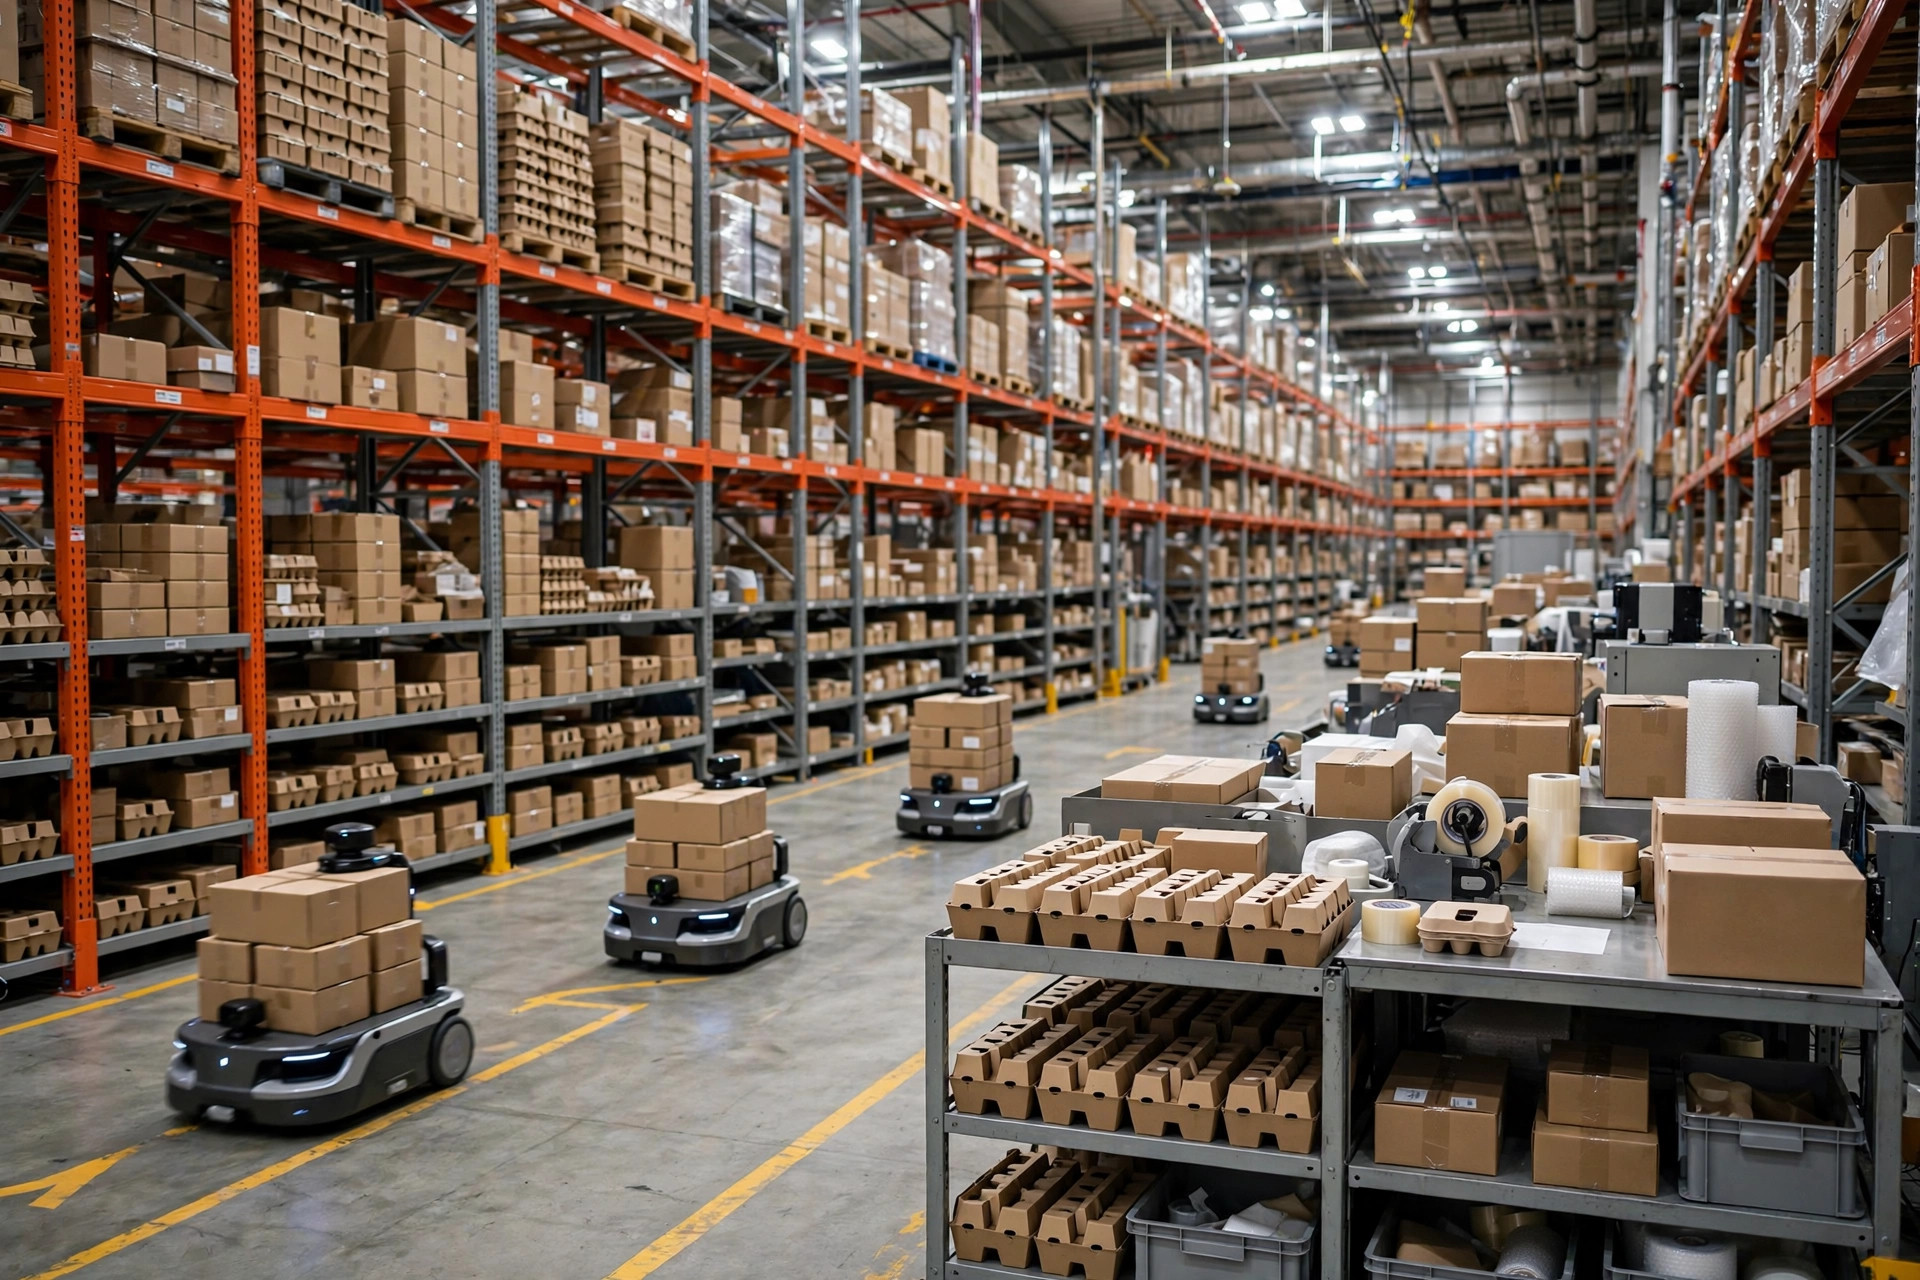
Here is the uncomfortable truth: when warehouse automation ROI fails, nine times out of ten the project failed its ABC analysis, not its equipment selection. An auto-parts distributor in Ontario, California spent about $1.6 million on a goods-to-person system, cut its picking team from 32 to 12, and landed on a payback of roughly 3.5 years. A 3C-accessories warehouse in Shenzhen spent about RMB 11 million on shelf-moving AMRs, and its robots log under four productive hours a day — the system will never pay back within its depreciation window. Same money. One prints cash, the other is decoration.
Costing basis first — every number below is illustrative: fully loaded picker cost at $45,000 per person-year in the US and RMB 90,000 in China, straight-line depreciation over 5 years, 300 operating days a year, and anonymized, rounded volumes. Run your own numbers through the same formulas before spending a dollar.
The Two Ledgers, Side by Side
Case A: Ontario, California — auto-parts distribution, live since March 2024. Roughly 11,000 SKUs. The ABC analysis showed a classic top-heavy profile: the top 18% of SKUs drove 78% of order lines. They installed a goods-to-person picking system for about $1.6 million, integration and WMS work included.
| Item | Figure (illustrative) |
|---|---|
| Total equipment investment | ~$1.6M |
| Picking headcount | 32 → 12 (20 saved) |
| Annual labor savings | 20 × $45k = $900k |
| Annual depreciation (5-yr) | $320k |
| Annual maintenance + spares | ~$120k |
| Net annual savings | $900k − $320k − $120k = $460k |
| Payback | $1.6M ÷ $460k ≈ 3.5 years |
Case B: Shenzhen, China — 3C accessories, live since October 2023. Roughly 35,000 SKUs. The ABC analysis told the real story: A-class SKUs (top 10%) contributed only 41% of order lines, with long-tail SKUs occupying most of the slots. They installed an AMR shelf-moving system anyway, for about RMB 11 million.
| Item | Figure (illustrative) |
|---|---|
| Total equipment investment | ~RMB 11M |
| Robot productive hours/day | Under 4 (two shifts, <25% utilization) |
| Picking headcount | 40 → 33 (only 7 saved) |
| Annual labor savings | 7 × RMB 90k = RMB 630k |
| Annual depreciation + maintenance | RMB 2.2M + 0.8M = RMB 3M |
| Net annual savings | 0.63M − 3M = −RMB 2.37M |
| Payback | Never, within the depreciation window |
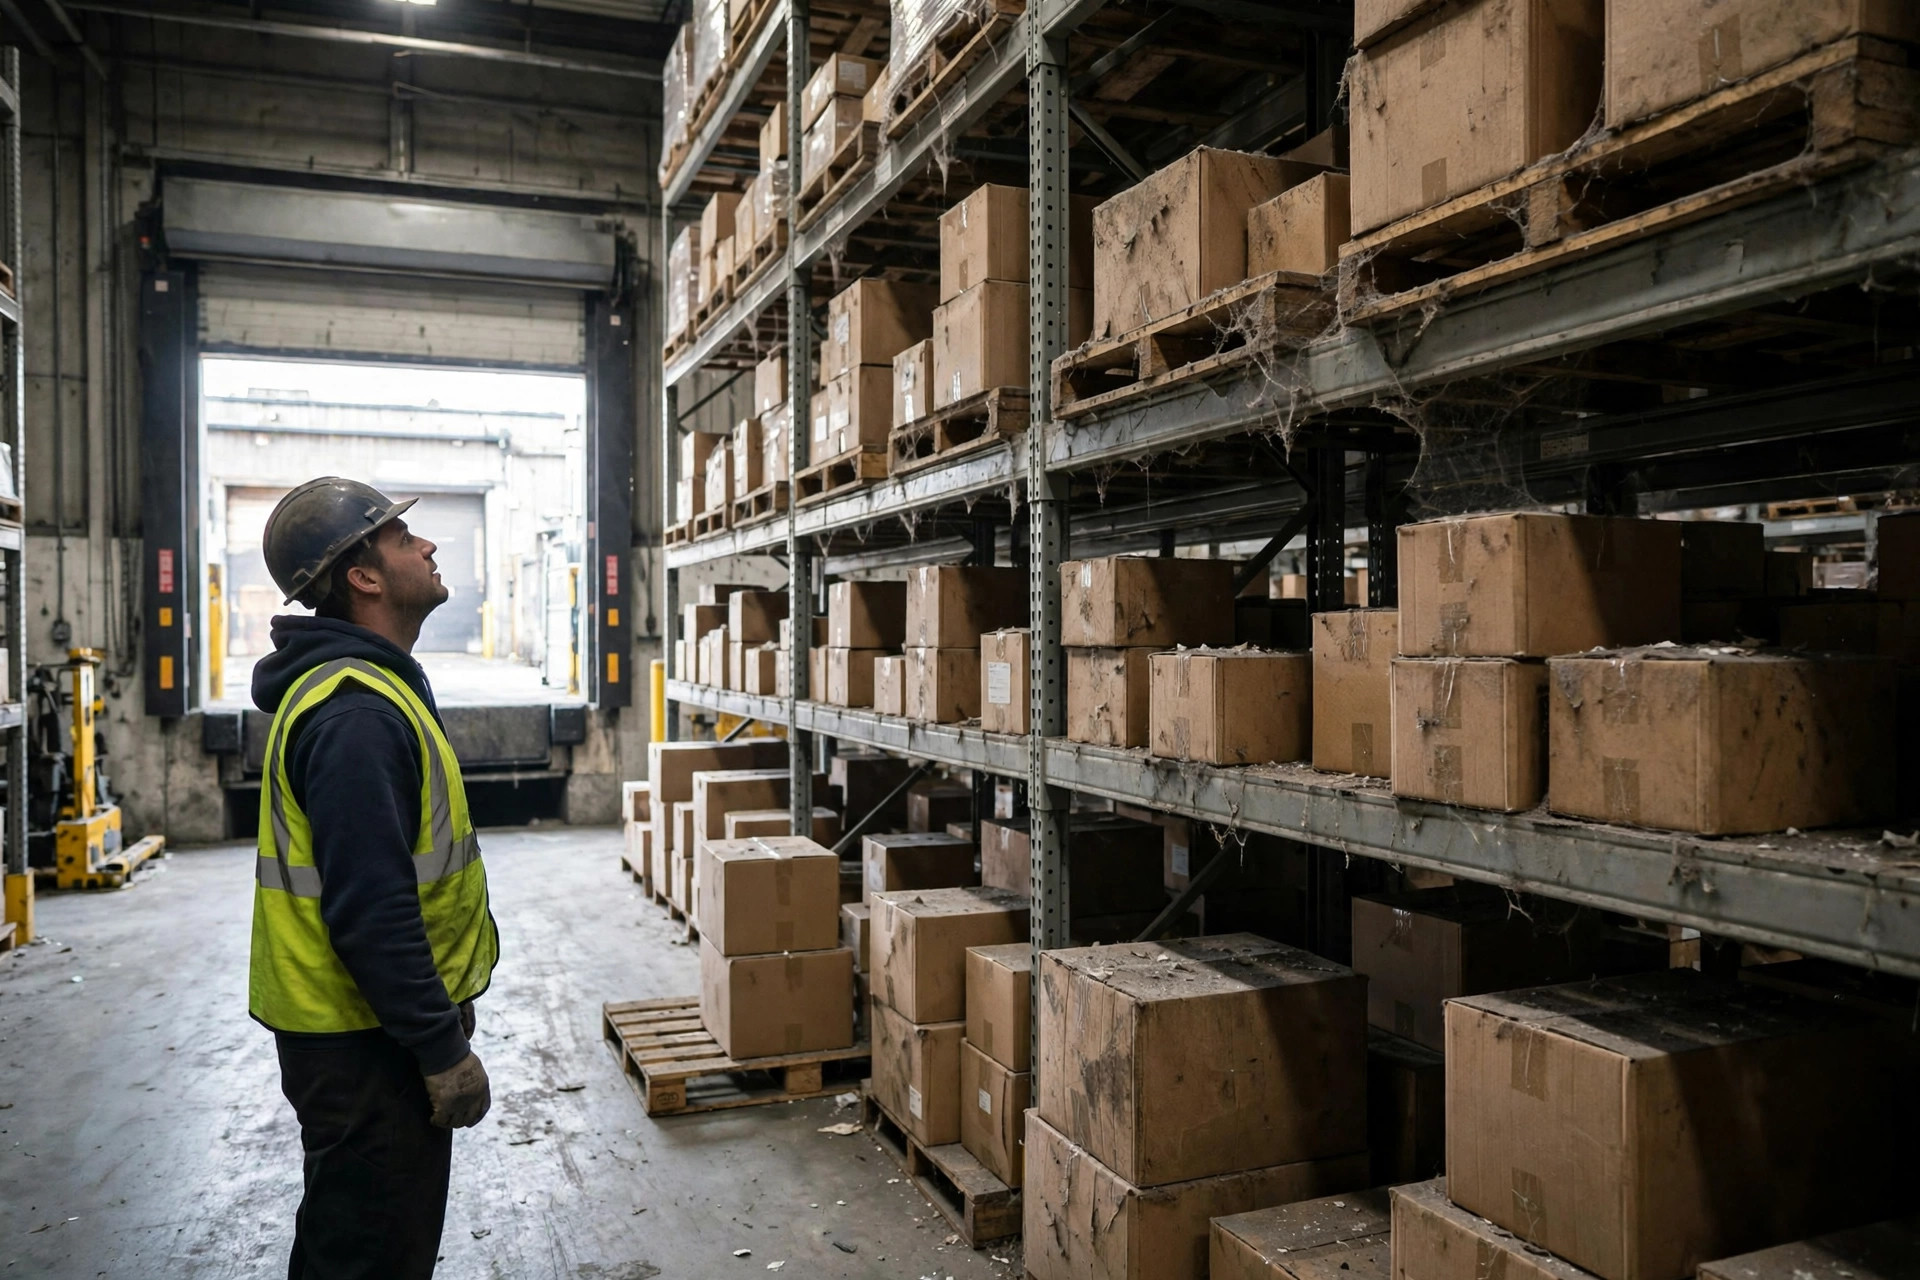
The painful read: Case B's problem is not that AMRs are bad. It is that the SKUs are too scattered for the equipment to stay fed. The robots spend their days waiting for tasks, running empty, and babysitting long-tail SKUs. That money was wasted — wasted because nobody asked, before signing, whether the SKU concentration could support the equipment.
Three ABC Thresholds That Gate Automation ROI
I will not lecture on how to run ABC analysis — pull an "SKU × order lines" report from your WMS, sort by order lines descending, and your A-class is whatever covers the top 80% of lines. The three thresholds below are the dividing lines I have watched project after project cross or miss (illustrative basis; adjust for your depreciation policy):
Threshold 1: SKU concentration — A-class SKUs must drive ≥ 70% of order lines. Below 50%, do not talk equipment. Talk SKU rationalization: cut the tail, merge SKUs, outsource C-class storage to a 3PL. Every one of those is cheaper than automating a scattered profile.
Threshold 2: Automatable order-line coverage ≥ 65%. Count order lines, not SKUs. The share of order lines your automation cell (goods-to-person stations, AMR zone) can stably cover sets the ceiling on labor savings. Case B's AMRs nominally roamed the whole building, but high-frequency order lines kept falling in manual zones — real coverage never reached half.
Threshold 3: Daily pick frequency — target stations/slots must log ≥ 5 productive hours a day. Equipment does not fear a high price tag; it fears idleness. An AMR at 25% utilization carries three times the equipment cost per order line of one at 75%. Feed your WMS wave history through the automation takt time — if you cannot fill five productive hours, halve the scope.
| Threshold | Green light | Red light |
|---|---|---|
| A-class order-line share | ≥ 70% | < 50%: fix SKU structure first |
| Automatable order-line coverage | ≥ 65% | < 50%: re-plan slotting first |
| Station productive hours/day | ≥ 5 hrs | Below: shrink scope or go lighter |
All three green before you talk equipment. One red light, and the money goes to SKU optimization and slotting first — small spend, fast payback, and it makes the automation business case honest.
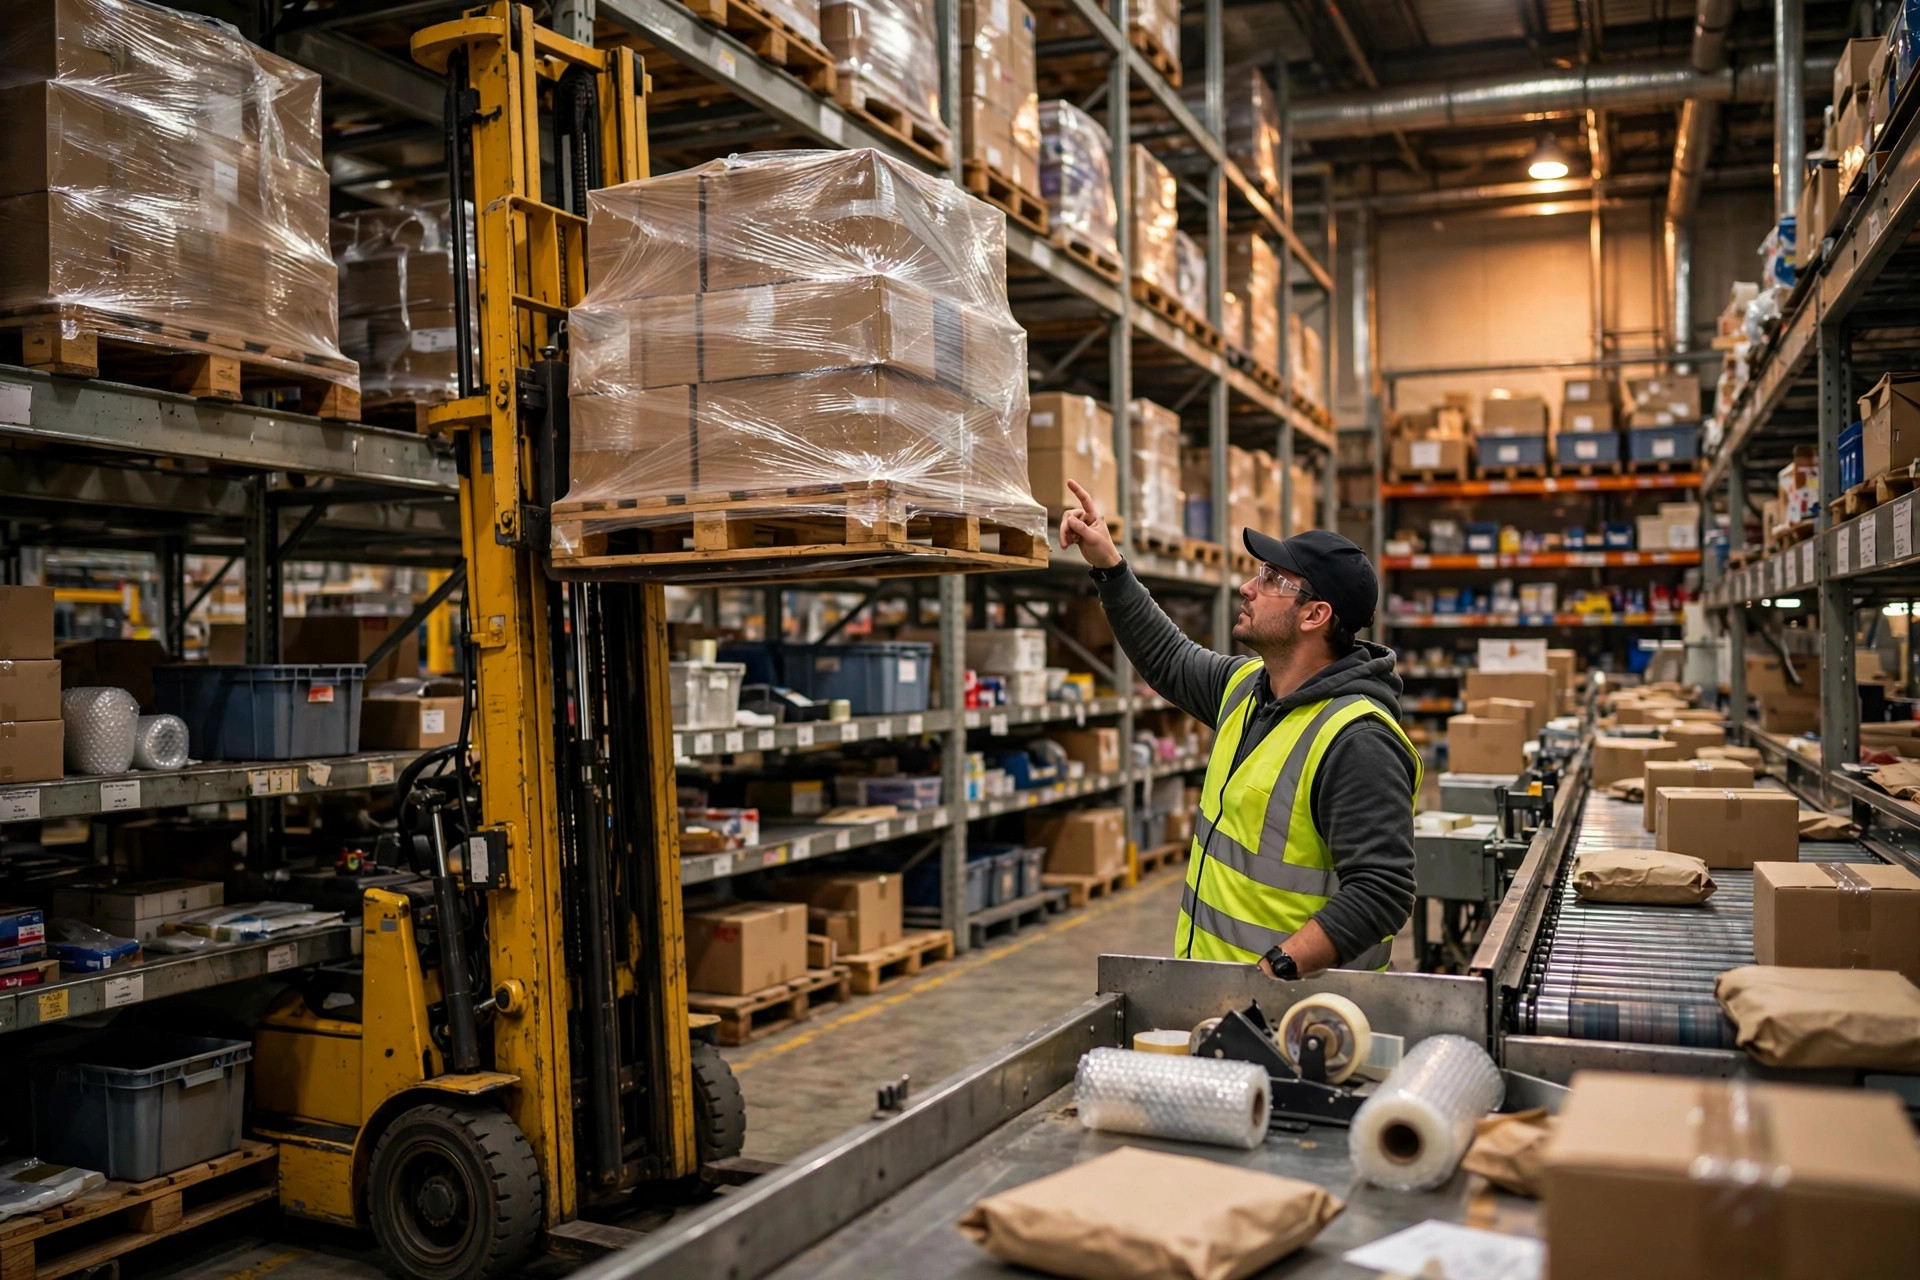
Where the Money Actually Burns in Long-Tail Warehouses
Break down the cost structure and the evaporation becomes obvious:
- Depreciation is fixed; labor savings are not. Depreciation hits every year, all RMB 2.2 million of it. Labor savings are capped by the SKU profile. Fixed cost versus capped savings — payback has no solution.
- Integration spend sinks. Scattered SKUs mean scattered slots and long travel paths, which doubles AMR mapping, racking retrofit, and WMS integration complexity. That money is gone the moment utilization stalls.
- The hidden tax: changeovers and waiting. Long-tail orders are varied and small-batch; the equipment constantly switches tasks, and empty travel plus idle waiting eat productive hours. Case B's robots spend nearly six hours a day "at work with nothing to do."
The counterintuitive call: the more scattered the SKUs, the more you should invest in ABC analysis and slotting before automation, not in automation itself. One serious re-slotting pass — pulling A-class SKUs into the zone nearest the pack stations — can lift manual picking efficiency 15%–30% (illustrative; depends on your travel profile) for the cost of a few slot moves. That ROI beats buying robots outright.
Before You Spend: Compute These Three Numbers
No slogans at the end — formulas.
Payback (years) = Total equipment investment ÷ (Annual labor savings − Annual depreciation − Annual maintenance)
- Numerator: equipment + integration + retrofit + WMS work. All of it, not the bare equipment quote.
- Denominator: annual labor savings = automatable order lines × labor cost per line × operating days; depreciation per your company policy.
- Decision line: payback > 4 years (illustrative, on 5-year depreciation) — freeze the project and go fix the SKU structure. ≤ 3 years — proceed. 3–4 years — shrink the scope and re-run the numbers.
Remember this: automation does not create efficiency; it amplifies your SKU structure. Good structure, and it is a money printer. Scattered structure, and it is the most expensive decoration in the building. ABC analysis first, slotting second, robots last — get the order wrong and no budget will be big enough.
By Lao Zhou, Logistics Cost Analyst