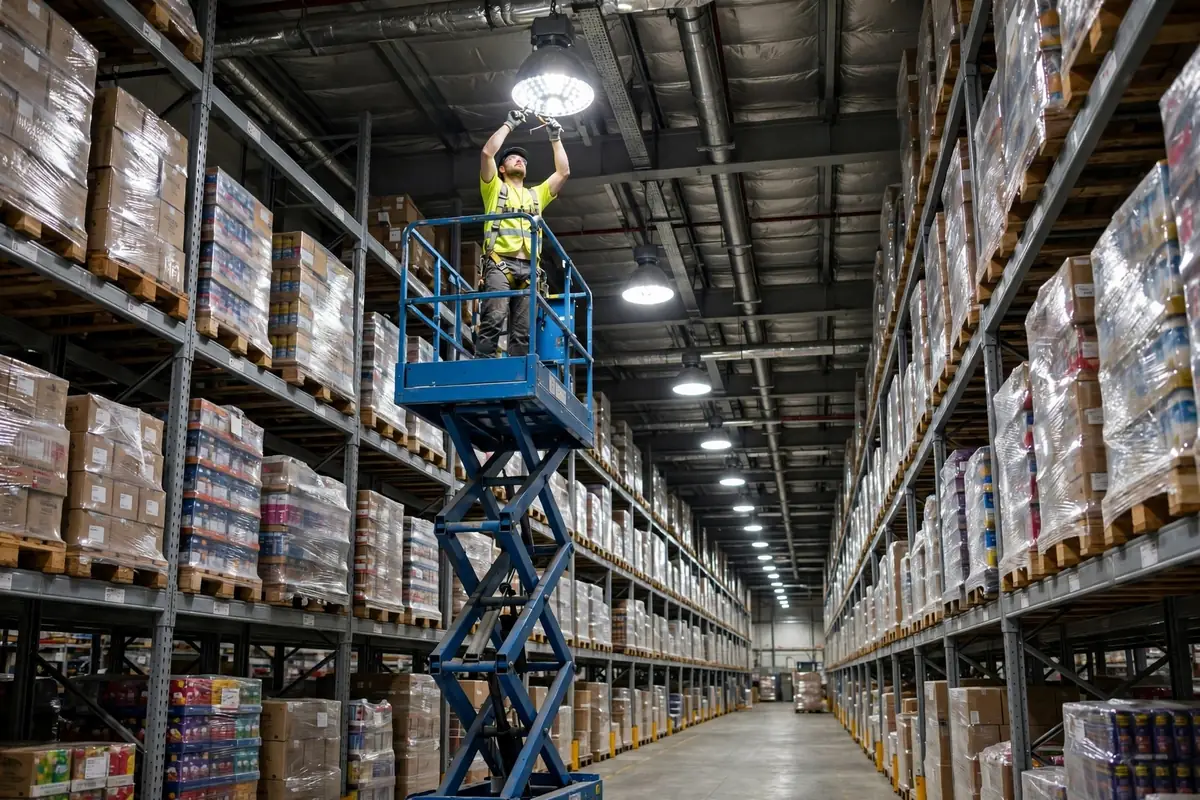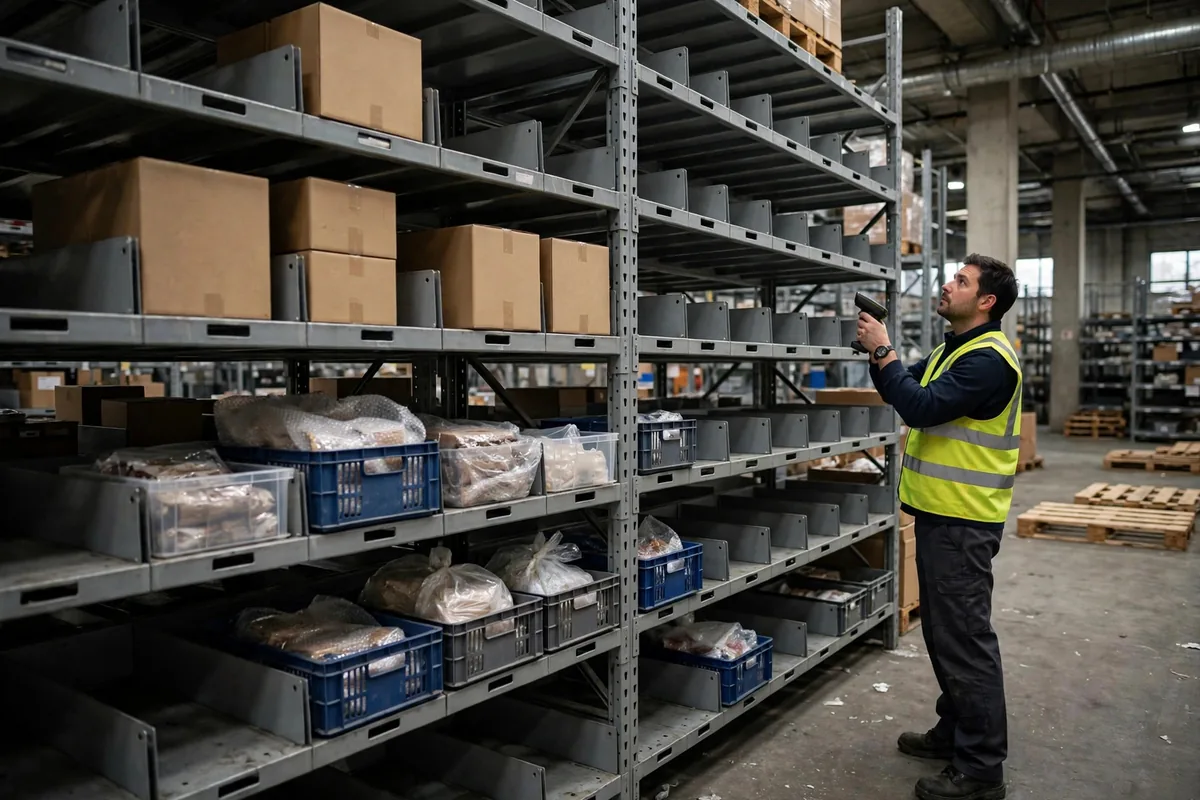
Let me start with a bill. Two years ago I helped an e-commerce warehouse close its year-end books — a textbook case of buffer-stock math gone wrong: slow-moving stock had tied up over four million yuan, cash was so tight they couldn't pay bonuses. At the same time, three best-sellers had been out of stock for two weeks, and customer service was getting hammered with complaints. One warehouse, overstocked and stocked out at the same time. The owner asked me: are we holding too much or too little? I said, neither — we're calculating it wrong. This is the classic picture of warehouse safety stock calculation mistakes: too much stock ties up cash, too little loses orders, and the error isn't in the will to stock — it's in the math.
Buffer stock protects against variability, not against the average. Demand bounces up and down every day, replenishment lead time runs fast one week and slow the next, and the buffer is what absorbs that wobble. The formula itself is simple: safety stock = safety factor × demand standard deviation × the square root of lead time. The four mistakes below — I've seen a warehouse make every one of them.
The Safety Factor Gets Guessed, and the Guess Is Expensive
The most common mistake is setting the safety factor by feel. Here's how it usually goes: the boss says "service level has to be high," so someone bumps the factor up. Or the other way — afraid of tying up cash, someone bumps it down. Nobody checks what service level the factor actually corresponds to. The result is predictable: the items that needed protection didn't get it, and the ones that didn't need it are sitting on a pile of cash.
This table shows what a factor is worth (hypothetical example: average daily demand 100 units, demand standard deviation 30 units, lead time 7 days):
| Target service level | Safety factor Z | Buffer stock |
|---|---|---|
| 90% | 1.28 | about 102 units |
| 95% | 1.65 | about 131 units |
| 98% | 2.05 | about 163 units |
| 99% | 2.33 | about 185 units |
Moving from 95% to 99% service level means holding 40% more buffer stock, while the stockout probability only falls by four percentage points. That is the trade-off at the heart of safety stock: the higher you push service level, the more each extra point costs. My rule is simple — set the service level first, then the factor, and set it by category. A-items, your best sellers, get 98%. C-items, the long tail, get 90% and that's enough. One factor for everything is just using A-item money to buy peace of mind for C-items.
Using the Average Instead of the Standard Deviation Breaks Safety Stock Math
The second mistake is sneakier: getting demand variability wrong. Plenty of warehouses still calculate buffer stock from average daily demand, ignoring variability entirely — or they take the peak day minus the average and call that the swing. That's like measuring your height to buy shoes. Wrong dimension.
Two years ago I looked at a 3PL warehouse whose method was average daily demand times lead time in days, plus twenty percent "for insurance." Peak season hit, orders tripled in a day, and the buffer didn't stand a chance — two straight weeks of stockouts. The problem wasn't the factor. It was the variability: they had never calculated a demand standard deviation in their lives. The standard deviation is the real shape of variability; the average is just a decoration. The right way is to take three months of daily demand, day by day, and compute the standard deviation — peak season and off-season separately. The data is already in the system. Somebody just has to sit down and run it once.
And there's a quantity people almost always leave out: lead time variability. Most buffer-stock math assumes lead time is fixed. Suppliers are never that punctual. Look at these numbers (hypothetical example):
| Method | Buffer stock (95% service level) |
|---|---|
| Demand variability only | about 131 units |
| Demand variability + lead time variability (lead time std. dev. 2 days) | about 355 units |
One missing variable, and the buffer is off by nearly three times. That's not scaremongering — the formula says so. Items with unstable lead times need a bigger buffer; items whose suppliers run like clockwork can run leaner. The root of the error is usually on the supply side, not the demand side.
One Set of Safety Stock Parameters for Peak and Off-Season
The third mistake: parameters set once a year and never touched again. Plenty of warehouses fix their buffer numbers in January and run the same ones all year. Off-season variability gets applied to peak season, peak-season stock levels get carried into the off-season. Wrong in both directions.
Last year a warehouse selling seasonal goods did exactly this. Summer was their slow season, winter was peak. They stocked winter with summer's parameters, and the first promotional wave of the season wiped out three hero products. When we did the review, operations said "we followed the formula." True — the formula was fine, but the numbers were summer's numbers. My practice: recalculate parameters every quarter, run a separate adjustment a month before peak season, and set temporary parameters during promotions that get switched back the day the promotion ends. Parameters aren't set-and-forget. They follow the business.
The Fix: A Four-Step Rework
Four mistakes, now the fix. The framework below is built to correct warehouse safety stock calculation mistakes, step by step, in order:
| Step | What to do | Output |
|---|---|---|
| Step 1: Set service level by category | A-items 98%, B-items 95%, C-items 90%, split by sales and cost of stockout | One target service level per category |
| Step 2: Measure real variability | Daily demand standard deviation plus lead time standard deviation, peak and off-season separately | Two standard deviations per item group |
| Step 3: Re-run the formula | Safety stock = Z × demand std. dev. × square root of lead time; use the full formula when lead time varies | New buffer per item group |
| Step 4: Review on schedule | Recalculate quarterly, log every stockout and every slow-mover with its cause, so the next adjustment has evidence | A parameter change log |
And one counterintuitive conclusion to finish: more safety stock can mean more stockouts. Cash is finite. Every dollar locked into slow-moving C-items is a dollar stolen from the A-items that actually sell. Buffer stock in the wrong category hurts the business more than no buffer stock at all — and that is the most expensive of all warehouse safety stock calculation mistakes. So stop asking "do we hold enough safety stock?" and start asking "is it sitting in the right place?" Get that question right, and the strange sight of a warehouse that is overstocked and stocked out at the same time starts to disappear.
By Lao Zhou, Logistics Cost Analyst