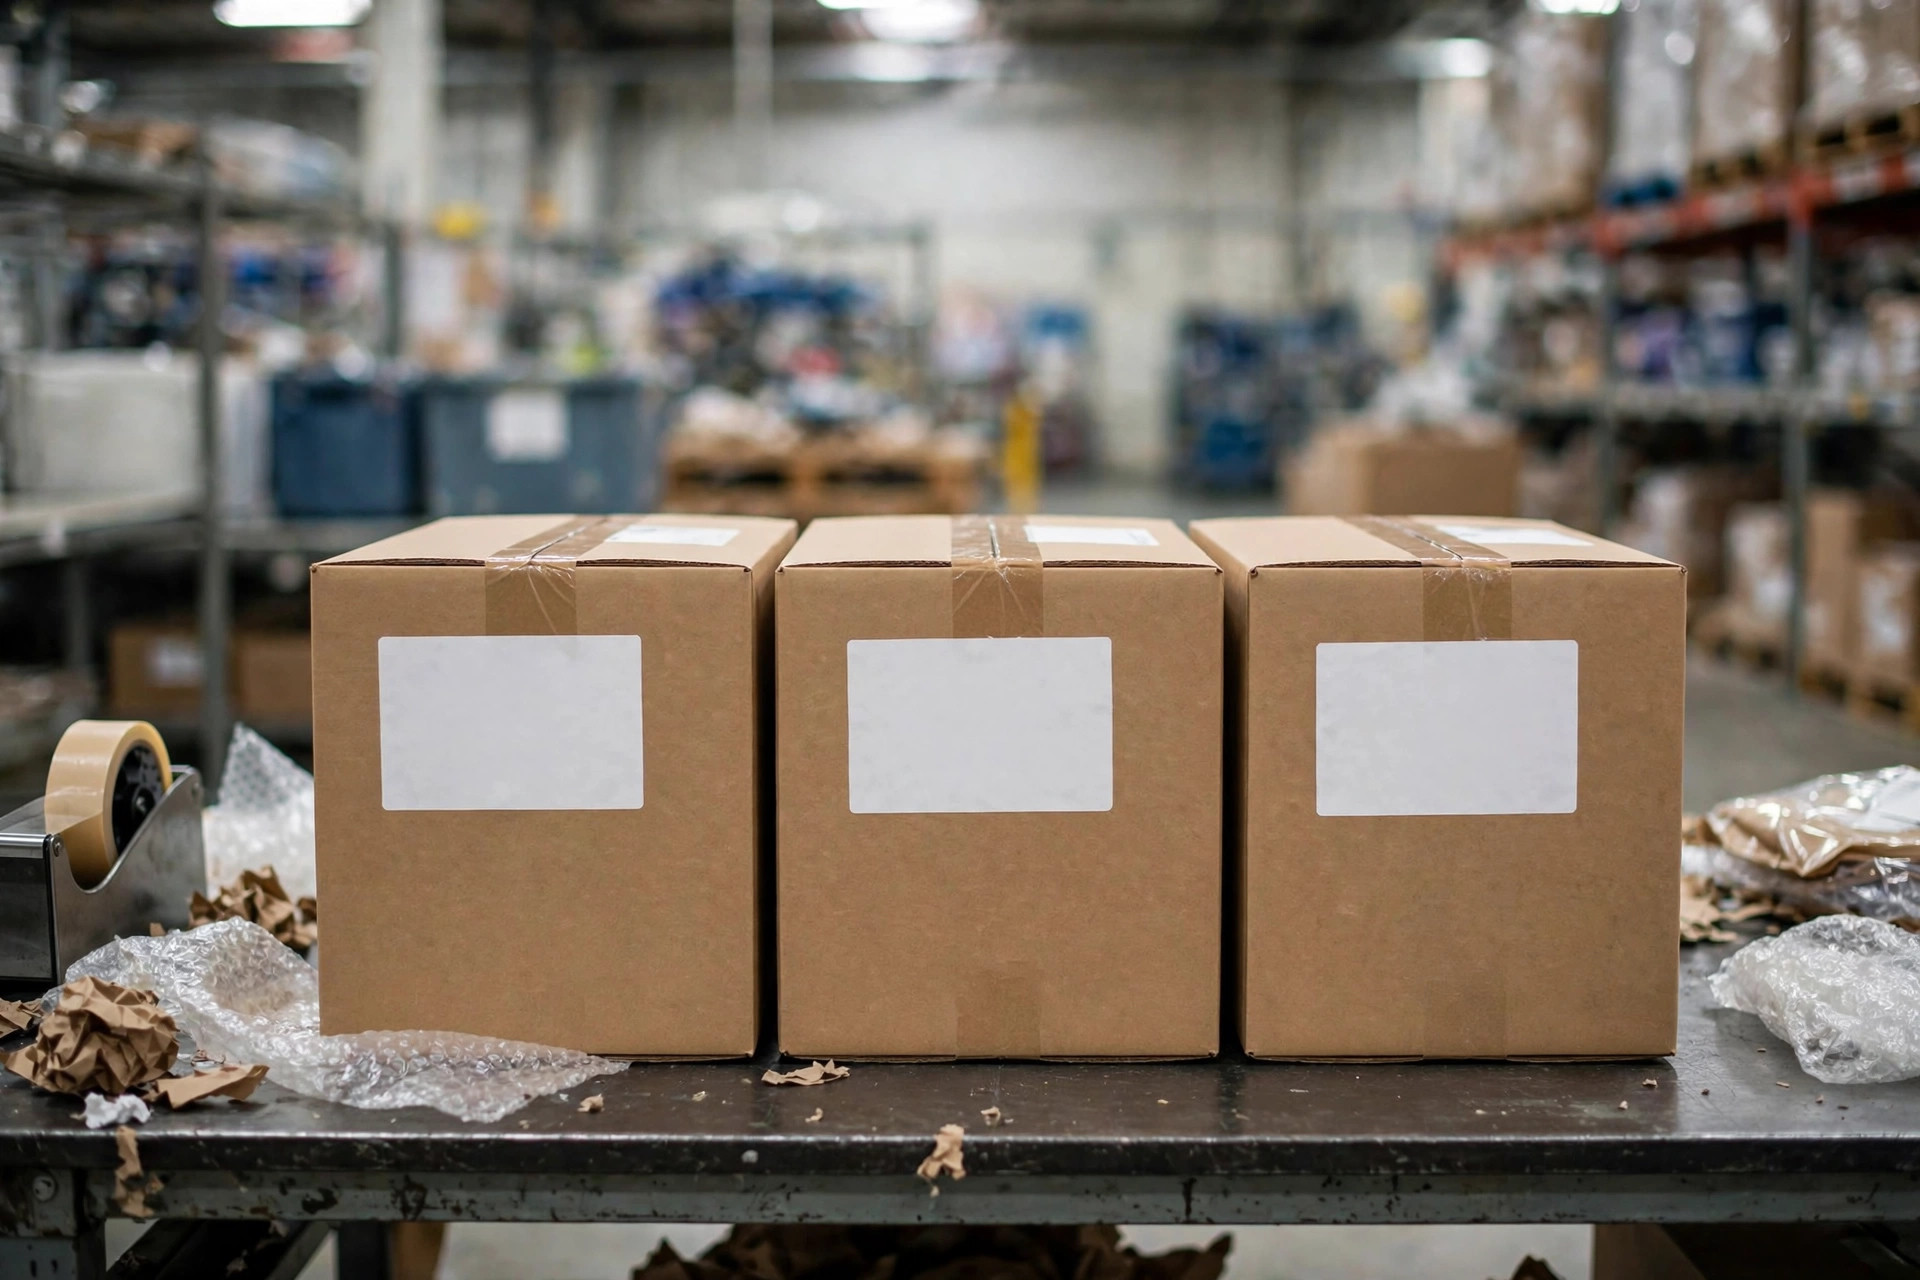
When an OMS splits a single order into three parcels shipping from two warehouses, split-order freight allocation stops being an accounting technicality and becomes the reason finance and operations stop trusting each other's numbers.
According to the Pitney Bowes Parcel Shipping Index, published annually, US e-commerce parcel volumes have kept growing for years, and multi-warehouse fulfillment — shipping from whichever warehouse has the inventory and sits closest to the customer — has gone from exception to routine. The OMS logic is straightforward: route each line to where the stock is and where the cheapest compliant shipment originates, which is why a single order routinely becomes two or three parcels. But the carrier invoice arrives at parcel level — three parcels, three freight lines — while finance needs SKU-level profitability, which means the freight has to land on individual SKUs. The allocation step in between looks like a mere choice of method. In practice, it determines every SKU margin on the P&L.
In February 2026, a home-apparel seller in Los Angeles — Shopify-first, also selling on Amazon — ran into a textbook split. One customer placed a single order for four items: two T-shirts, one cap, three pairs of athletic socks. Inventory told the story: the T-shirts and socks were in the California warehouse; the cap was only available in New Jersey. The order went out as three parcels. The actual carrier charges came to $8.95, $11.20, and $6.75 — $26.90 in total. At month-end, finance took the path of least resistance and divided the freight evenly by parcel count: $8.97 per SKU. Operations looked at the report and balked. The cap sells for $24.99; after $8.97 of freight and $9.00 of product cost, barely $7 of margin remained. "Should we even keep this SKU?" Finance was equally frustrated: the books balanced to the cent, all $26.90 allocated, using the same method the company had relied on for two years. Neither side made an arithmetic error. The method itself was wrong for this order structure.
Running the Numbers: Three Split-Order Freight Allocation Methods on the Same Order
To make the differences concrete, here is a worked example built on that order. (Figures are simplified for illustration — they demonstrate the methods, not actual carrier rates.)
| SKU (origin warehouse) | Weight | Price | Actual parcel freight | By weight | By value | By parcel count |
|---|---|---|---|---|---|---|
| Two T-shirts (California) | 1.2 lb | $39.98 | $8.95 | $12.91 | $11.33 | $8.97 |
| Cap (New Jersey) | 0.5 lb | $24.99 | $11.20 | $5.38 | $7.08 | $8.97 |
| Three pairs of socks (California) | 0.8 lb | $29.99 | $6.75 | $8.61 | $8.50 | $8.97 |
| Total | 2.5 lb | $94.96 | $26.90 | $26.90 | $26.90 | $26.90 |
All three methods divide the same $26.90, yet produce three entirely different allocations. One step further: assuming product costs of $18.00 for the T-shirts, $9.00 for the cap, and $12.00 for the socks, the SKU margins come out like this:
| SKU | By weight | By value | By parcel count |
|---|---|---|---|
| Two T-shirts | 22.7% | 26.6% | 32.5% |
| Cap | 42.5% | 35.7% | 28.1% |
| Three pairs of socks | 31.3% | 31.6% | 26.7% |
Look at the cap's row. Its parcel carried the highest actual freight of the three — $11.20, shipped from New Jersey most of the way across the country to a California customer. Yet under weight-based allocation it absorbs only $5.38, and its margin is computed at 42.5%, the highest in the table — for the SKU that is, in reality, the most freight-intensive of the three. The T-shirts tell the mirror story: actual freight $8.95, allocated $12.91 by weight, margin compressed to 22.7%. Same cap, different method, and the reported margin swings from 42.5% to 28.1% — a 14.4-point gap. Whether a merchandising meeting votes to kill the SKU can come down entirely to which version of the spreadsheet finance brings to the table.
In November 2025, during the Black Friday–Cyber Monday stretch, a beauty seller in New Jersey ran a "full-size plus sample" bundle promotion. Order volume surged, and so did splits: the full-size product shipped from the main warehouse while the sample shipped from another, so nearly every order became two parcels. Finance stuck with the company's long-standing value-based allocation. The full-size item sold for $68 against the sample's $12, so the lion's share of freight landed on the full-size product. At the quarterly review, its freight ratio had climbed past 30% of revenue, and the founder made the call on the spot: scale back purchasing on a line where freight eats a third of sales. It took a rework of the numbers at actual parcel cost to reveal the truth: the full-size product's fulfillment economics were perfectly healthy. The sample parcel's freight had simply been loaded onto it by the value-based method. One choice of allocation method nearly killed the most profitable line in the catalog.
Why the Answers Diverge: The Assumption Buried in Each Method
The divergence is not arithmetic; it is about assumptions. According to the zone-based pricing tables the major carriers publish, US domestic parcel pricing is parcel-level logic built on zone plus weight plus dimensions: the same parcel can cost twice as much from New Jersey to California as from California to California. Each allocation method smuggles in a different assumption:
- Weight-based allocation assumes freight is proportional to weight. That holds only when the per-pound freight cost is similar across parcels — single-warehouse shipping, a single carrier.
- Value-based allocation assumes freight is proportional to item value. That assumption is almost never true in the physical world — freight does not care what the goods are worth. Its real virtue is alignment: it speaks the same "percentage of revenue" language as channel commissions and ad spend, which makes cross-SKU comparison easy.
- Parcel-count allocation assumes every parcel costs the same to ship. That is the most convenient assumption and the most cleanly wrong — $8.95, $11.20, and $6.75 are not the same number.
The conclusion follows directly: when an order is both multi-warehouse and carries SKUs with widely different weight-to-value ratios, at least two of the three assumptions fail, and the allocation necessarily distorts. And that order profile — multiple warehouses, mixed SKUs, light and heavy, cheap and expensive in one cart — is exactly the typical US seller's order.

Where Each Method Earns Its Keep
No method works everywhere, but each has conditions under which it goes wrong the least.
Weight-based allocation fits situations where freight genuinely tracks weight: an owned fleet settled by the pound, single-warehouse shipping, SKUs with similar weight-to-value ratios. Its blind spot is cross-warehouse, multi-carrier shipping — once per-pound freight diverges across parcels, the weight method quietly transfers the cost of "light goods from a far warehouse" onto "heavy goods from a near warehouse," and light, bulky SKUs get their margins systematically overstated.
Value-based allocation fits situations where the numbers must reconcile with everything else: channel commissions and ad spend are all stated as percentages of revenue, and finance wants one coherent P&L. The price is a systematic penalty on high-value, lightweight SKUs — the smaller and more expensive the item, the more grotesque its allocated freight ratio looks. The beauty brand's full-size product was convicted by exactly this mechanism.
Parcel-count allocation fits uniform parcel structures, SKUs of similar price and weight, and teams with no dedicated cost accountant. It has one virtue: speed. Its drawback is equally candid: it is too crude for any assortment decision.
A Split-Order Freight Allocation Decision Framework: Four Questions First
Before choosing, answer four questions; the answers point to the method.
First, how much does actual freight vary across parcels? If orders routinely ship cross-warehouse and cross-zone, with parcel freight differing twofold or more, rule out parcel-count allocation immediately.
Second, how much do SKUs differ in weight-to-value ratio? If "light and expensive" and "heavy and cheap" SKUs sell side by side, the weight and value methods each carry their own systematic bias — decide first which bias you can less afford.
Third, who reads this report? A report that drives assortment and pricing decisions should use the method closest to real causality, even if it is more work. A report for the books and the auditors should use the method that is consistent, explainable, and reproducible. It is entirely reasonable for one company to use different methods for the two.
Fourth, how much is the team willing to pay for precision? Manual spreadsheet allocation and automated parcel-level costing inside the OMS differ by an order of magnitude in accuracy — and in cost. Small teams should start with the right method done by hand, and move to system automation when split volume outgrows the spreadsheet.
One counterintuitive judgment deserves to stand on its own: there is no standard answer to freight allocation, but that does not mean the choice hardly matters. The opposite is true. The wrong method does not introduce a little noise — it systematically misstates the true profit of certain SKUs, and the direction of the error is predictable. The weight method persistently overstates the margin of light, bulky goods; the value method persistently understates the margin of high-value SKUs; the parcel-count method persistently lets cheap items in small parcels ride subsidized. Worse, the distortion never exposes itself: the books always balance, all $26.90 accounted for, the report always internally consistent. If management does not know which bias its method carries, so-called data-driven assortment is decision-making on top of bias.
The Trend: Allocation Itself May Be on Its Way Out
According to the Pitney Bowes Parcel Shipping Index, US parcel volumes keep growing, splits will only increase, and the allocation problem is not going away on its own. But here is the interesting part: the act of allocating may itself be getting replaced.
In the last couple of years, leading OMS and TMS vendors have started supporting parcel-level actuals: the true freight charge from each carrier invoice line attaches directly to its parcel, and only the small remainder — the within-parcel split across SKU lines — still needs a rule. One layer of judgment is removed, and allocation degrades from a method-selection problem into a data-attribution problem. My read: parcel-level costing will move downmarket from leading sellers to mid-market sellers over the next two to three years — the basis being vendors' release cadence and the typical two-to-three-year system refresh cycle among smaller sellers. Until then, most small and mid-size sellers will keep answering this question in a spreadsheet — and getting the method right is what makes the report meaningful.
One open question to close on: if freight could one day be attributed precisely to every parcel and every unit, would "allocation" disappear entirely? And a level deeper: is this argument really about accounting technique, or is it a management question about who should pay for the split? When the OMS breaks one order into three parcels to honor a delivery promise, where should the extra freight go — onto the SKU, onto the channel, or onto the delivery promise itself as its own cost? There is no standard answer. But every seller's answer shapes their P&L — and the angle from which they see their own business.
By Dr. Chen, Supply Chain Researcher