Conclusion first: conveyor OEE is three numbers multiplied — availability × performance × quality. The formula is trivial; the hard part is which WCS fields feed each number, how you slice the time window, and who owns each minute of downtime. I've seen this exact failure three times: three warehouses, same conveyor configuration, same month — OEE came out at 91%, 74%, and 63%. The equipment wasn't different. The definitions were.
Nail down the definitions before pulling a single tag.
Availability = actual run time / planned production time. Planned production time = shift length − planned stops. Conveyors don't have die changes, but they do have wave-change line clears, routine inspections, meal breaks — those are planned stops, out of the denominator, no penalty.
Performance = actual units / (actual run time × theoretical takt capacity). Take theoretical takt from the manufacturer's latest spec; if you're not sure, use 90% of the measured peak from seven consecutive on-target shifts, document it, and make everyone use the same number.
Quality = first-pass units / actual units. On a conveyor, "defective" means exactly three things: scan failures, weight anomalies, diverted rejects. Units that pass on re-scan after a retry don't count as first-pass — that's rework.
Why the WCS has to be the source of truth: the WMS knows how many orders a wave shipped and whether it shipped on time. It has no idea why the line sat still for 47 minutes. The WCS holds motor start/stop events, photo-eye counts, scan-head reads, alarm codes — every raw ingredient of downtime attribution lives in the WCS. The WMS's job is to set the definitions: how shifts are cut, when a wave counts as started, which stops are planned. I'm a WMS consultant and I say this at every site: when OEE doesn't add up, nine times out of ten it's a definitions problem, not an equipment problem.
The playbook, in four steps.
Step 1: the WCS data pull list. Get these six data classes aligned first; miss one and everything downstream is an estimate.
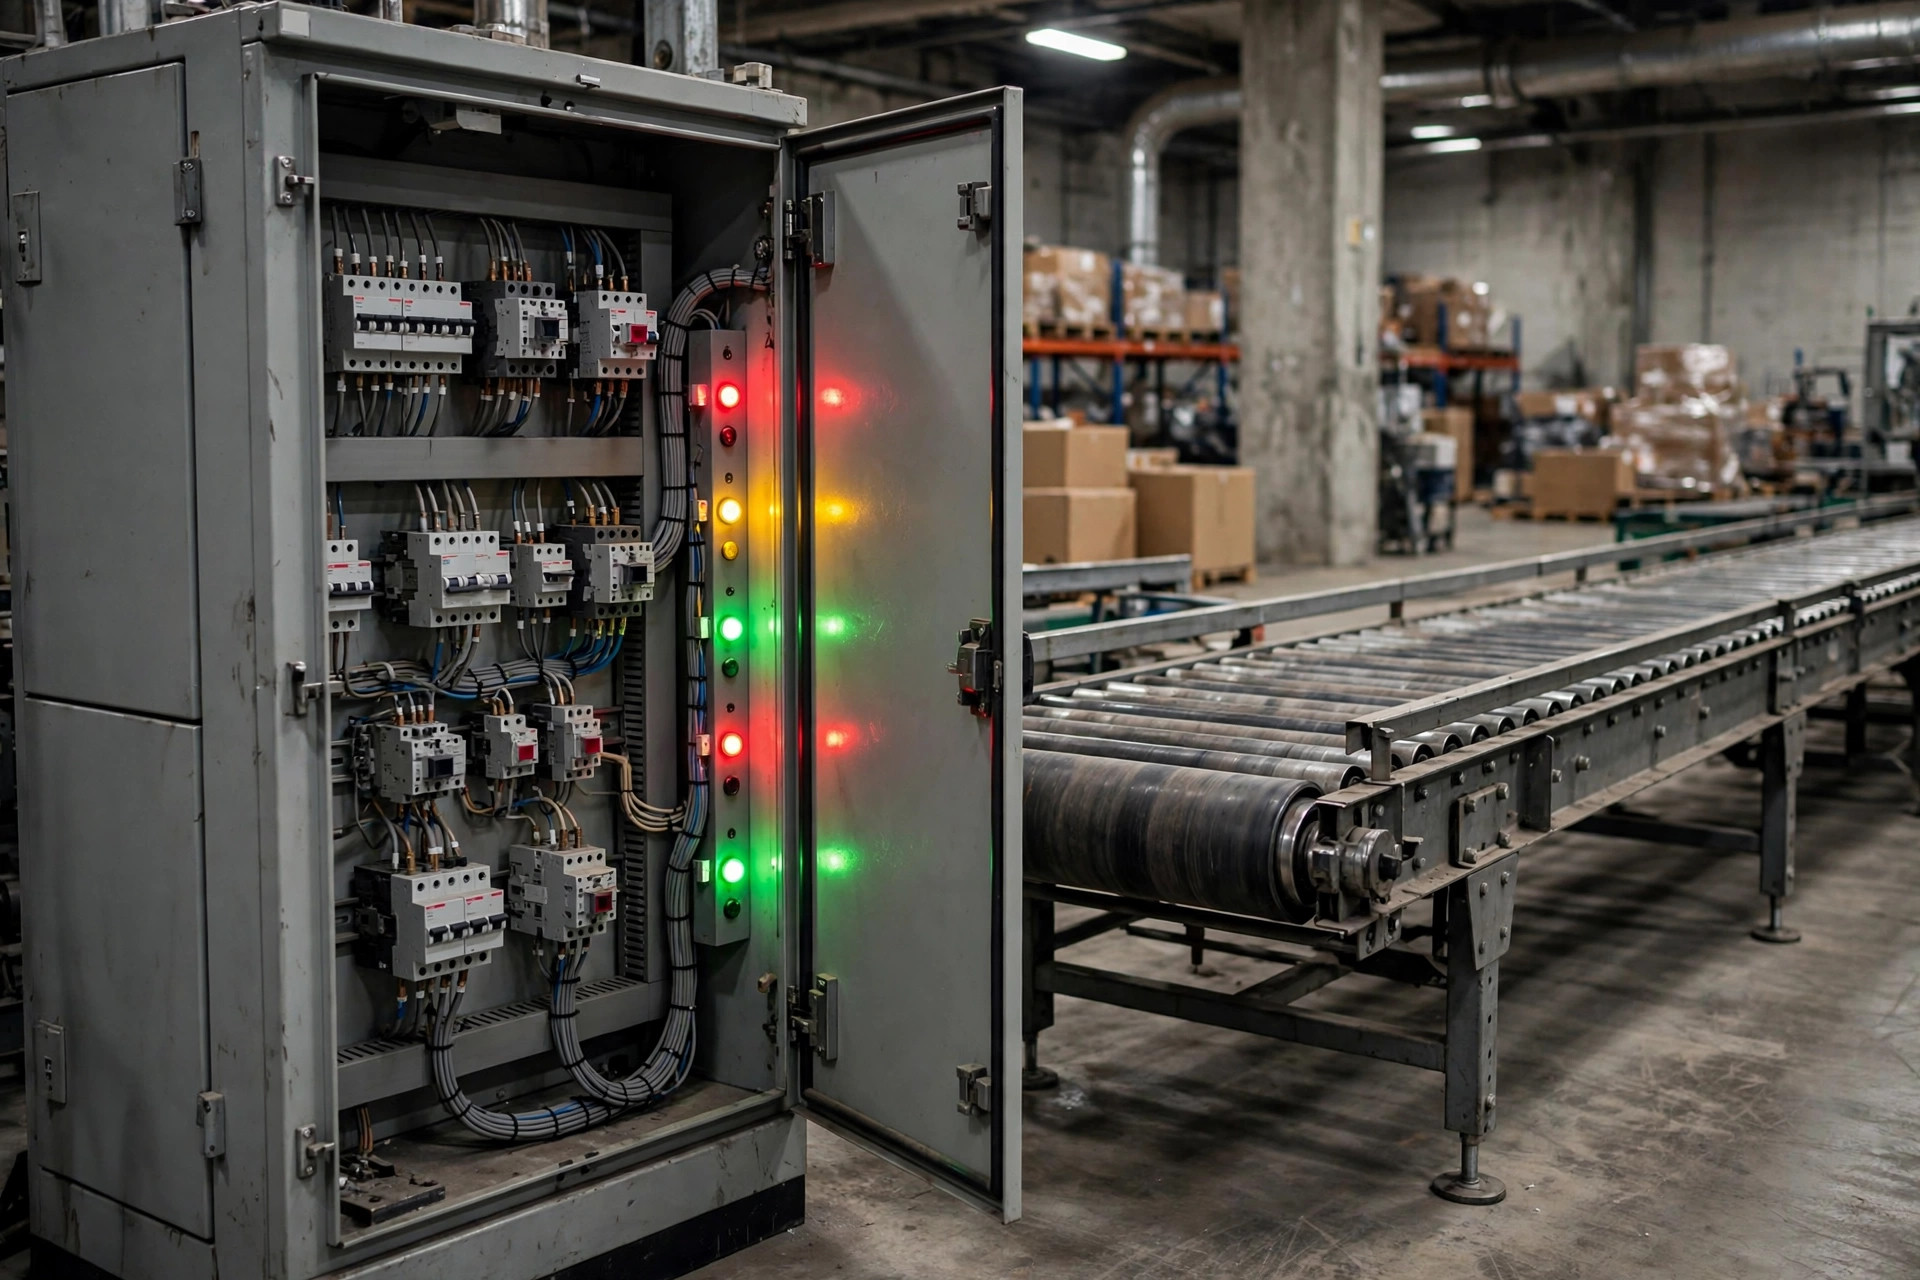
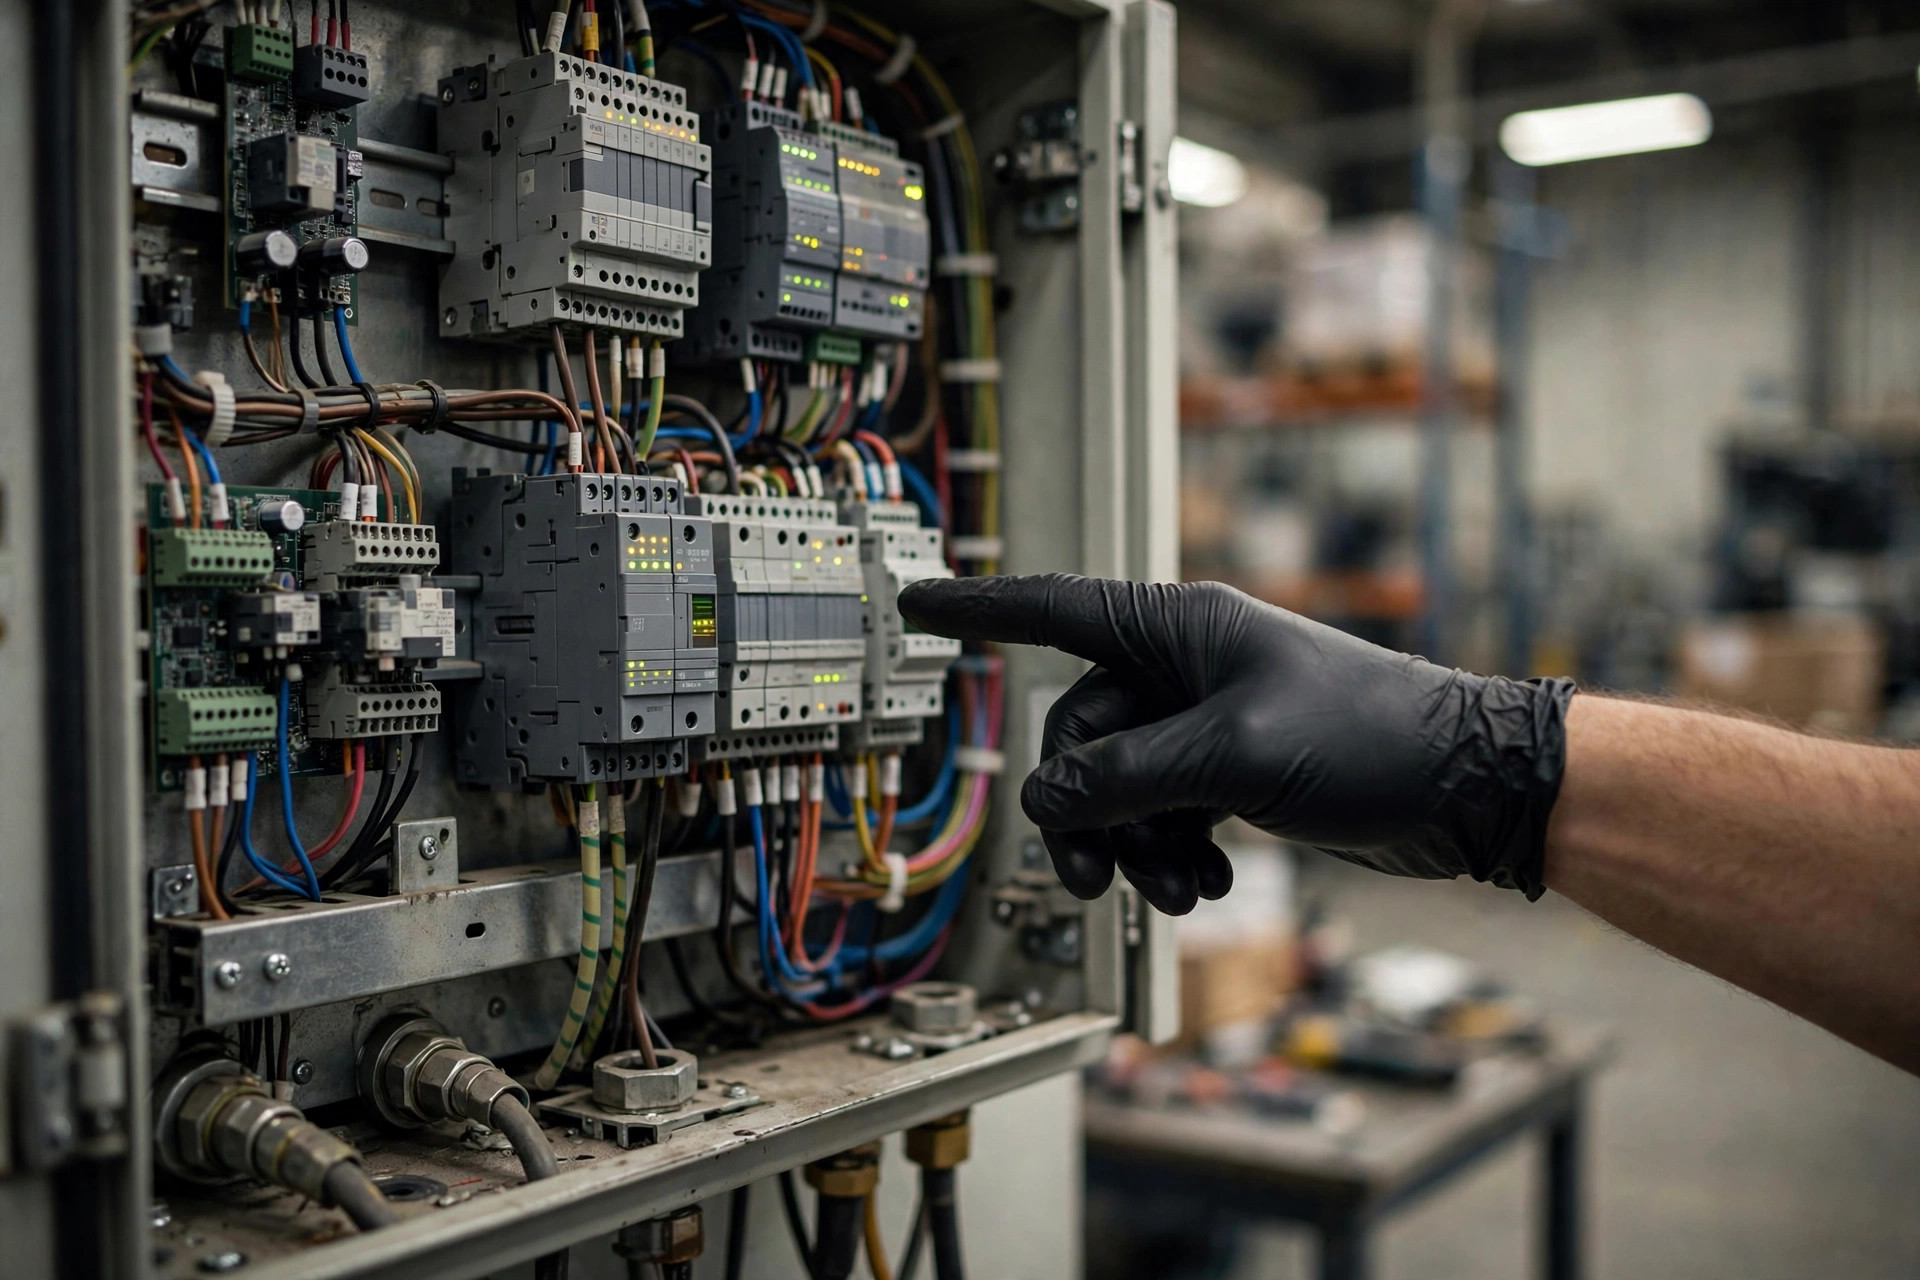
- Equipment state events: motor starts/stops, drive alarms, timestamped to the second. Sub-second is overkill; minute-level is too coarse.
- Photo-eye and counter data: unit counts at key points — at minimum infeed, discharge, and every divert. Without segmented counts you can't locate which section stopped.
- Scan data: barcode read success/failure records with failure reason codes. This is the numerator and denominator of your quality rate.
- Alarm code map: WCS alarm code → plain-language meaning → attribution category. This table is a capital asset — build it once, use it for three years, change it through a process.
- Shift calendar: shift start/end, planned stops (meals, maintenance, wave-change clears). Maintained in the WMS, read-only in the WCS.
- Speed and takt settings: current line speed, theoretical takt. The denominator of performance comes from here.
Step 2: the downtime attribution taxonomy. Every stop first passes a planned-vs-unplanned gate; unplanned stops go into six buckets.
| Category | Definition | Typical WCS signal |
|---|---|---|
| Equipment failure | Hardware stoppage — motor, drive, scan head | Drive alarm codes, motor overload |
| Starved | Upstream can't feed the line; belt idles or stops waiting | Infeed photo-eye dark for an extended period |
| Upstream jam | Units present but stuck in an upstream section | Mid-line photo-eye continuously blocked, motor stall alarm |
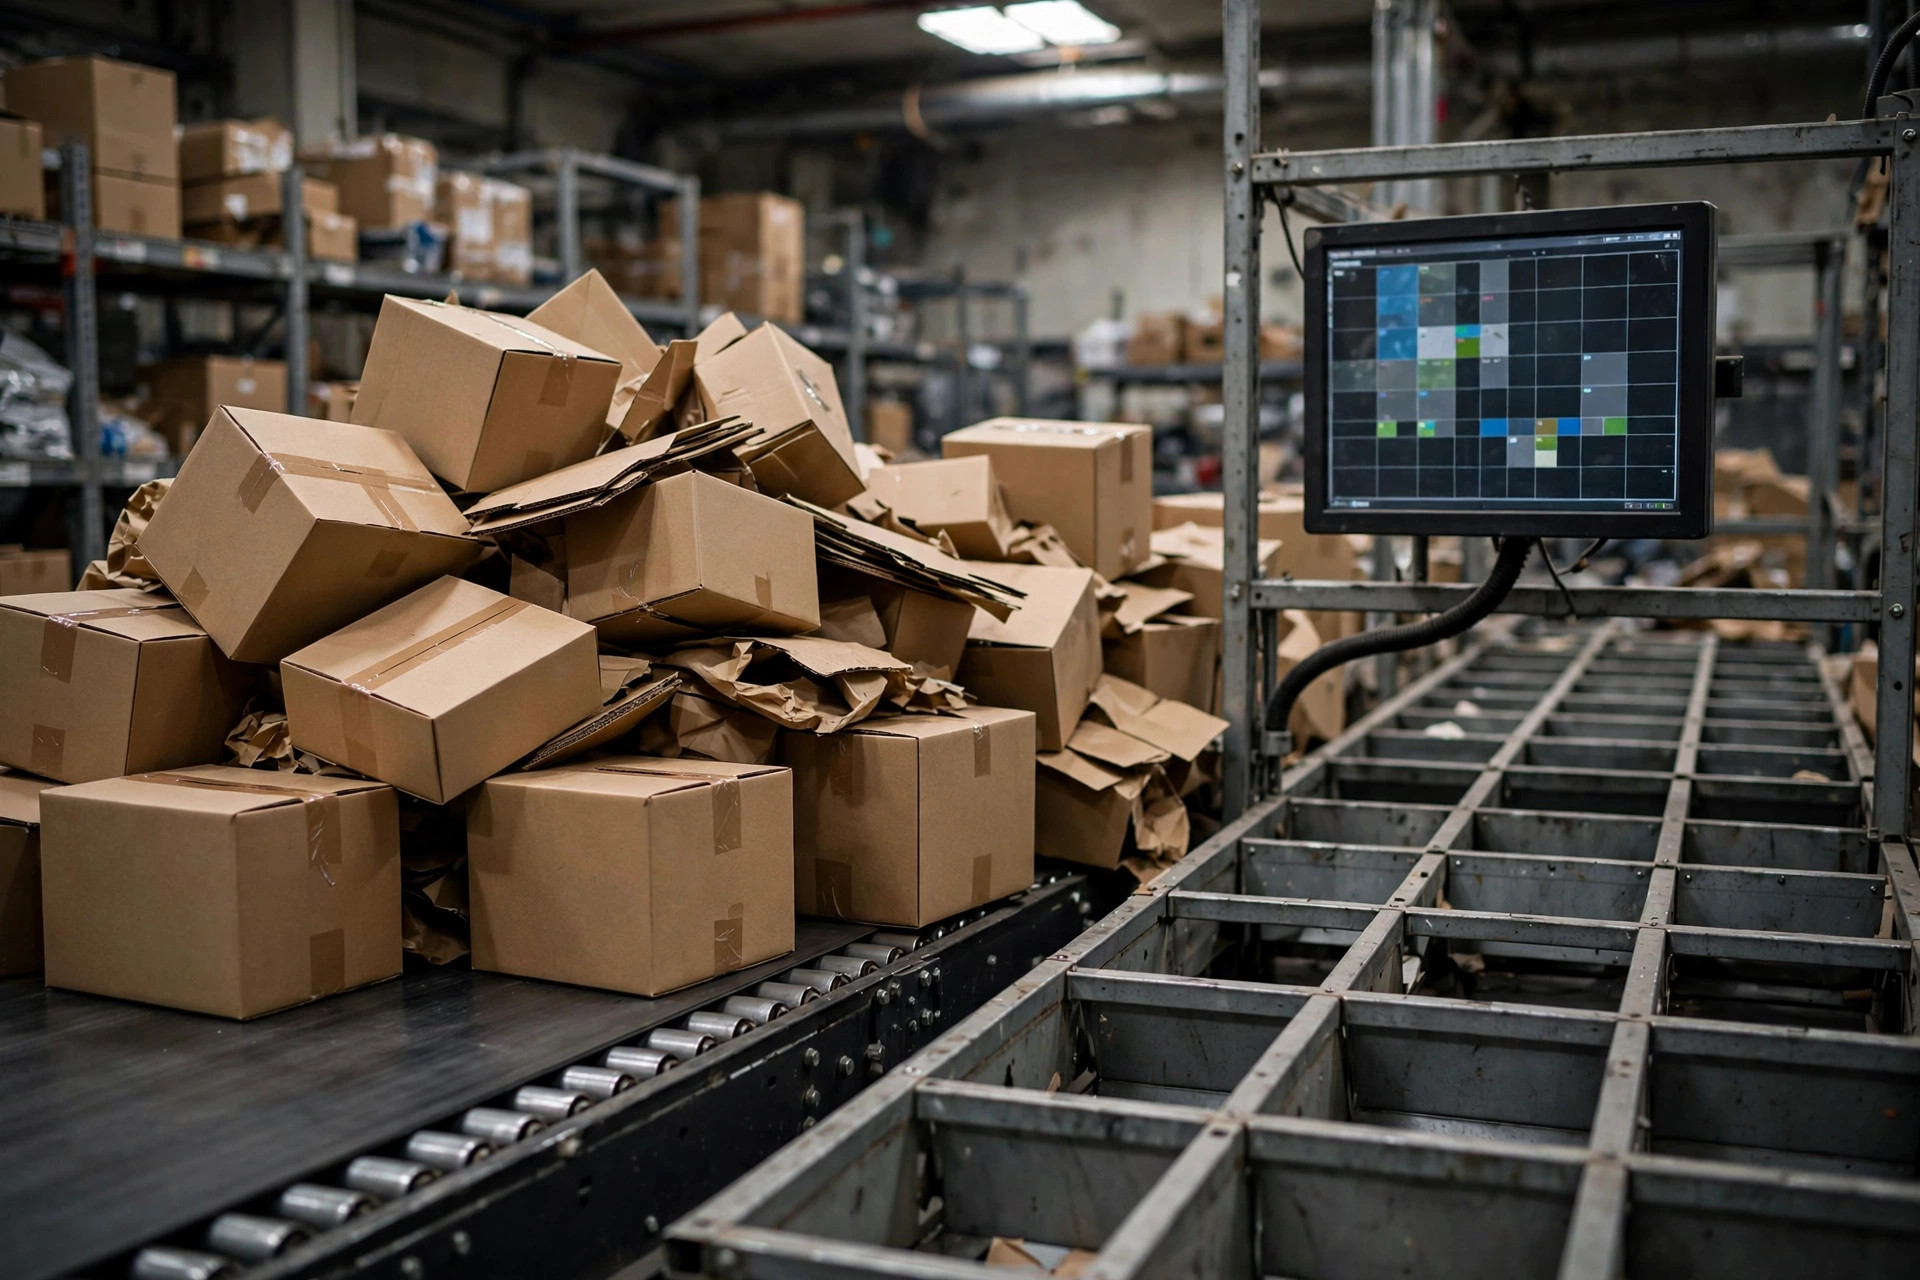
| Downstream full | Sort chutes or pack stations full; line forced to stop | Chute-full signal, discharge photo-eye continuously blocked |
| Changeover | Line clear, sort-rule switch, label-template change | WCS task-change event |
| Micro-stop | Under 5 minutes, no alarm code | Frequent motor start/stop events with no code |
Gray areas need written rules. Mine are three: first, any stop under 5 minutes with no alarm code goes to micro-stops, tracked as its own category, never forced into equipment failure. I've seen this exact failure three times — micro-stops get smeared across "equipment failure," maintenance spends a month fixing machines, and OEE doesn't move a point. Second, infeed empty plus WMS shows the wave released means starved; infeed empty with no wave released is a WMS wave-planning problem — tracked separately, not charged against equipment OEE. Third, the same alarm code three or more times in 24 hours escalates to a repeat failure, tracked on its own.
Step 3: align WMS and WCS definitions. Four items; OEE isn't trustworthy until they're done.
- One time base: WCS event timestamps and WMS wave times on the same timezone and the same NTP source. I've seen a WCS running 7 minutes fast — every cross-shift stop got attributed to the wrong shift.
- One shift definition: the WMS shift start/end equals the WCS planned-production window. Night shifts crossing midnight get a hard rule — attribute by start time — enforced by everyone.
- One planned-stop list, maintained in one place: WMS owns it, WCS reads it. Two lists will diverge; it's only a matter of time.
- One documented definition of first-pass: units that fail a scan and pass on retry close out as exception handling in the WMS and don't count as first-pass in the WCS.
Step 4: compute OEE and find the bottleneck. Three outputs: an OEE trend table (per-shift granularity), a downtime Pareto (category × minutes), and a micro-stop list (every sub-5-minute event). Read them in order: find the biggest slice of availability first, then look at performance. Rule of thumb: when conveyor OEE won't budge, 70% of the problem hides in availability — and 70% of availability problems are micro-stops and waiting.
Case one: the 47 minutes nobody saw. November 2024, a large e-commerce DC in eastern China running around 80,000 orders a day. The main sorter's OEE sat at 71–73% for three straight weeks. Maintenance swore nothing had broken, and the data agreed — no single stop exceeded 3 minutes. Then we counted WCS events: 120+ micro-stops per day, 47 minutes total, every one of them "chute full → downstream crew can't clear in time → line stops → cleared → restart." Not one counted as a failure, but it ate nearly an hour of planned production time daily. The fix spent nothing on equipment: full-chute warning photo-eyes plus one dedicated chute-clearing operator. OEE hit 83% two weeks later.
Case two: the month-long definitions fight. March 2025, a 3PL warehouse in southern China. The WMS reported 98% wave on-time completion; the WCS reported 62% conveyor OEE. The two teams argued for a month. Root cause: the WMS shift ran 8:00–20:00 while the WCS planned-production window excluded a 1-hour lunch and two 15-minute wave-change clears; the WMS also counted wave-release delays as production time. After alignment, OEE recalculated to 79%, and the real bottleneck was starved infeed at the 11:30 and 16:00 wave transitions — a WMS wave-planning problem, not a conveyor problem.
The money math. Take a line rated at 6,000 units/hour with a fully loaded sort cost around $0.11 per unit (labor plus equipment depreciation, order of magnitude):
| Downtime type | Daily total | Lost units | Daily cost, order of magnitude |
|---|---|---|---|
| Micro-stops (under 5 min each) | 47 min | ~4,700 | ~$520 |
| Starved | 30 min | ~3,000 | ~$330 |
| Equipment failure | 20 min | ~2,000 | ~$220 |
Micro-stops look the most harmless per event and cost the most in aggregate. That's why step 2 keeps them in their own bucket: unlisted, they hide inside averages forever.
Three counterintuitive calls. First, OEE above 85% isn't automatically good news. A conveyor is one link in a system; a single line at 95% may mean upstream is holding freight to protect your number — units only release when the batch is complete, the line looks great, and order cycle time suffers. Always read OEE alongside wave on-time completion; alone, it's self-deception. Second, performance pinned at 100% for weeks means the theoretical takt is set too low, not that the line runs well. Healthy performance wobbles between 90% and 95%; a permanent full score means there's no target. Third, quality is the least valuable rate to optimize on a conveyor. Cutting scan failures from 2% to 1% buys less than cutting 10 minutes of micro-stops. Operate on the bottleneck, not on the prettiest number.
Common failure points, before you wrap up. First, manually logged downtime reasons contradict WCS events: the shift lead writes "equipment failure," the WCS shows a full chute. Fix: the WCS event decides the primary cause; manual notes are supplements only. Second, measuring the main line but not the system: sorter OEE at 88% while the infeed line starves daily. Compute OEE at the system level — main line plus infeed plus pack-out together. Third, the alarm code map goes stale: a new scan head comes online, its codes never enter the map, and three months later the attribution table fills with "unknown" and the OEE trend breaks. Map changes go through a change process. Fourth, grading crews on monthly average OEE: averages eat micro-stops. Grade on micro-stop counts plus attribution closure rate; use OEE as a trend reference only.
OEE isn't a number for the wall — it's how you decide where the next cut lands. The WCS gives you the raw data, the WMS gives you the definitions, and once the two are joined, downtime has nowhere to hide.
By Lin Xiao, WMS Implementation Consultant