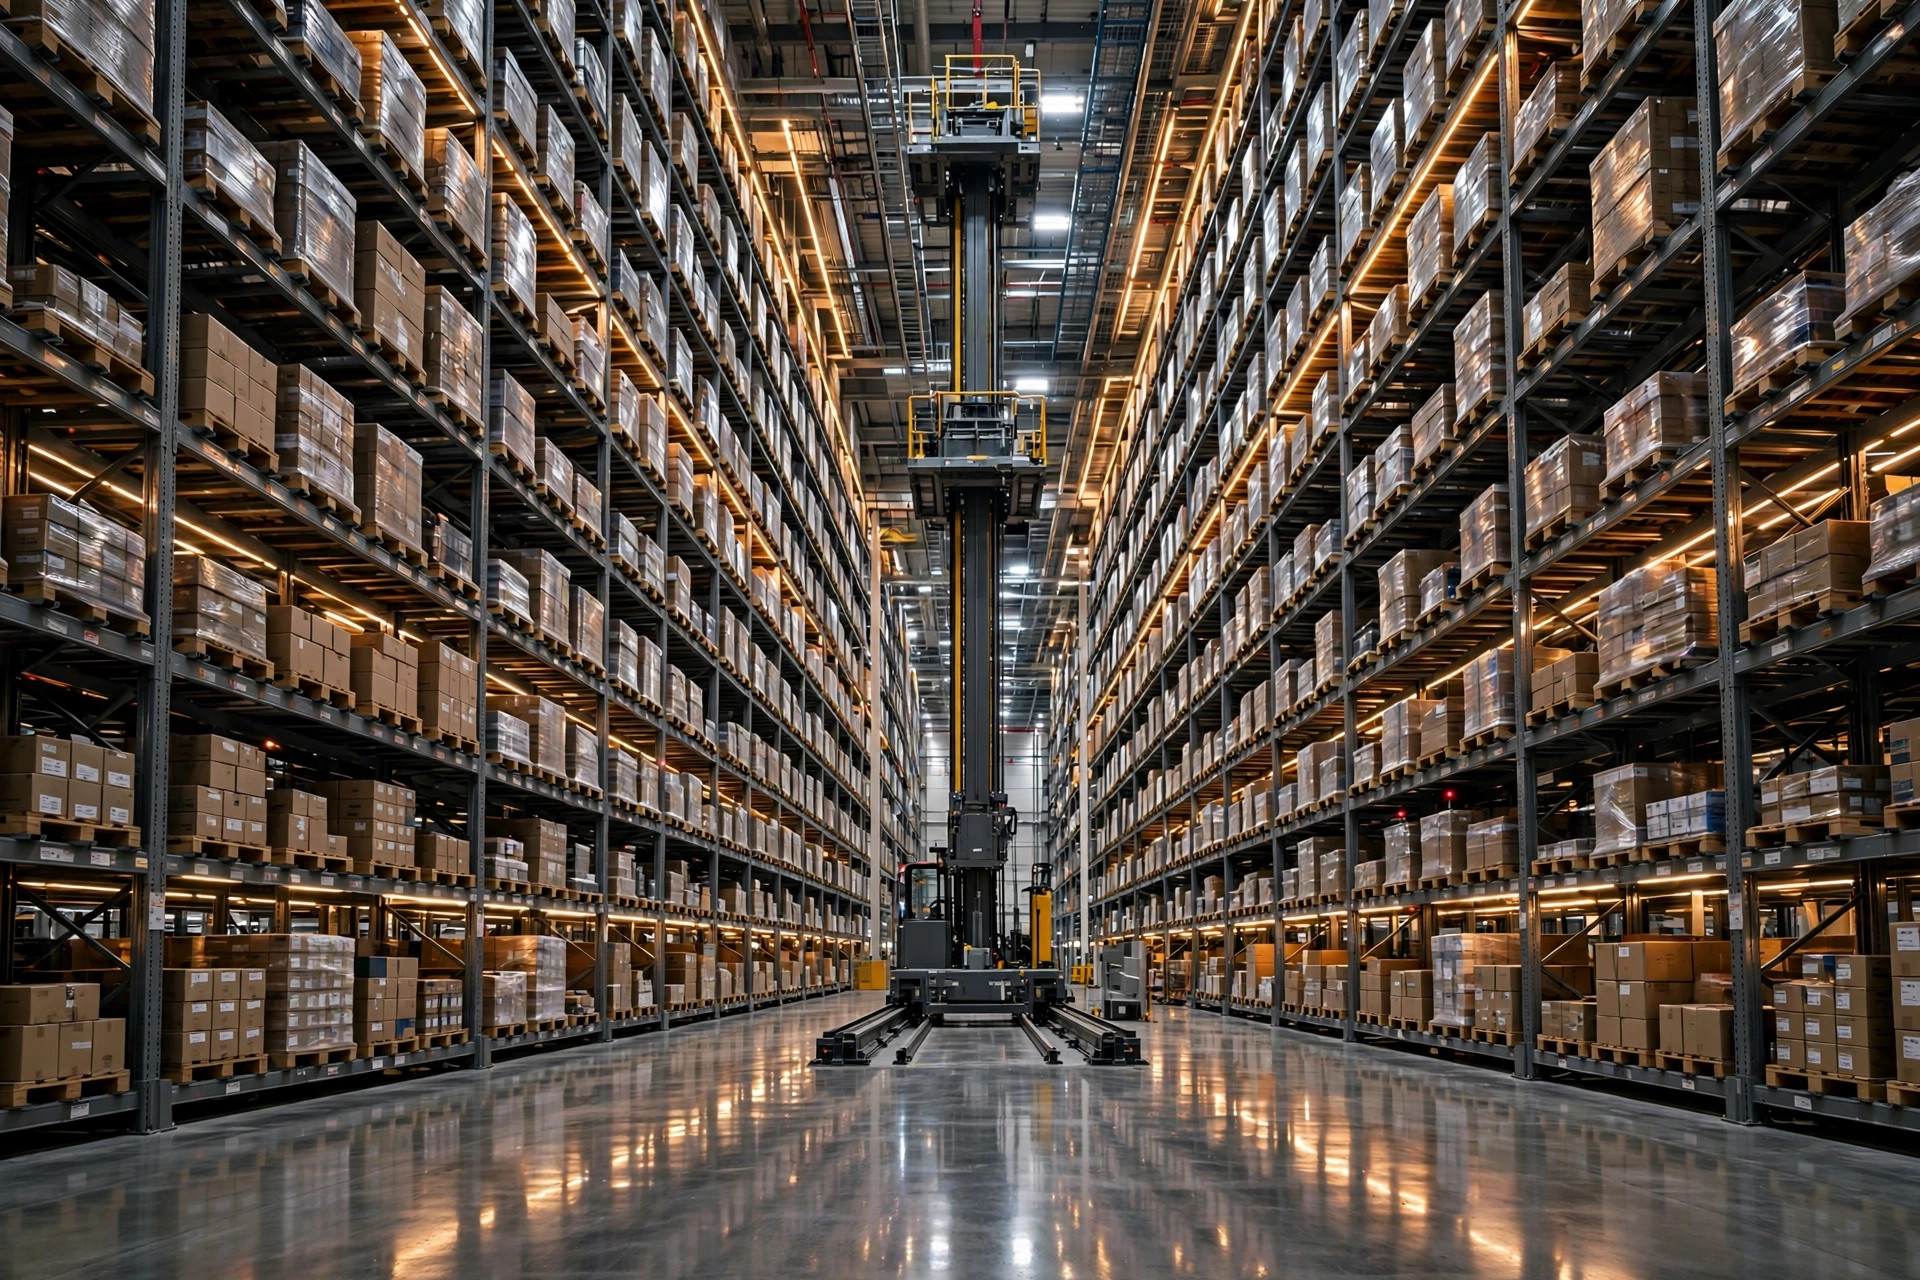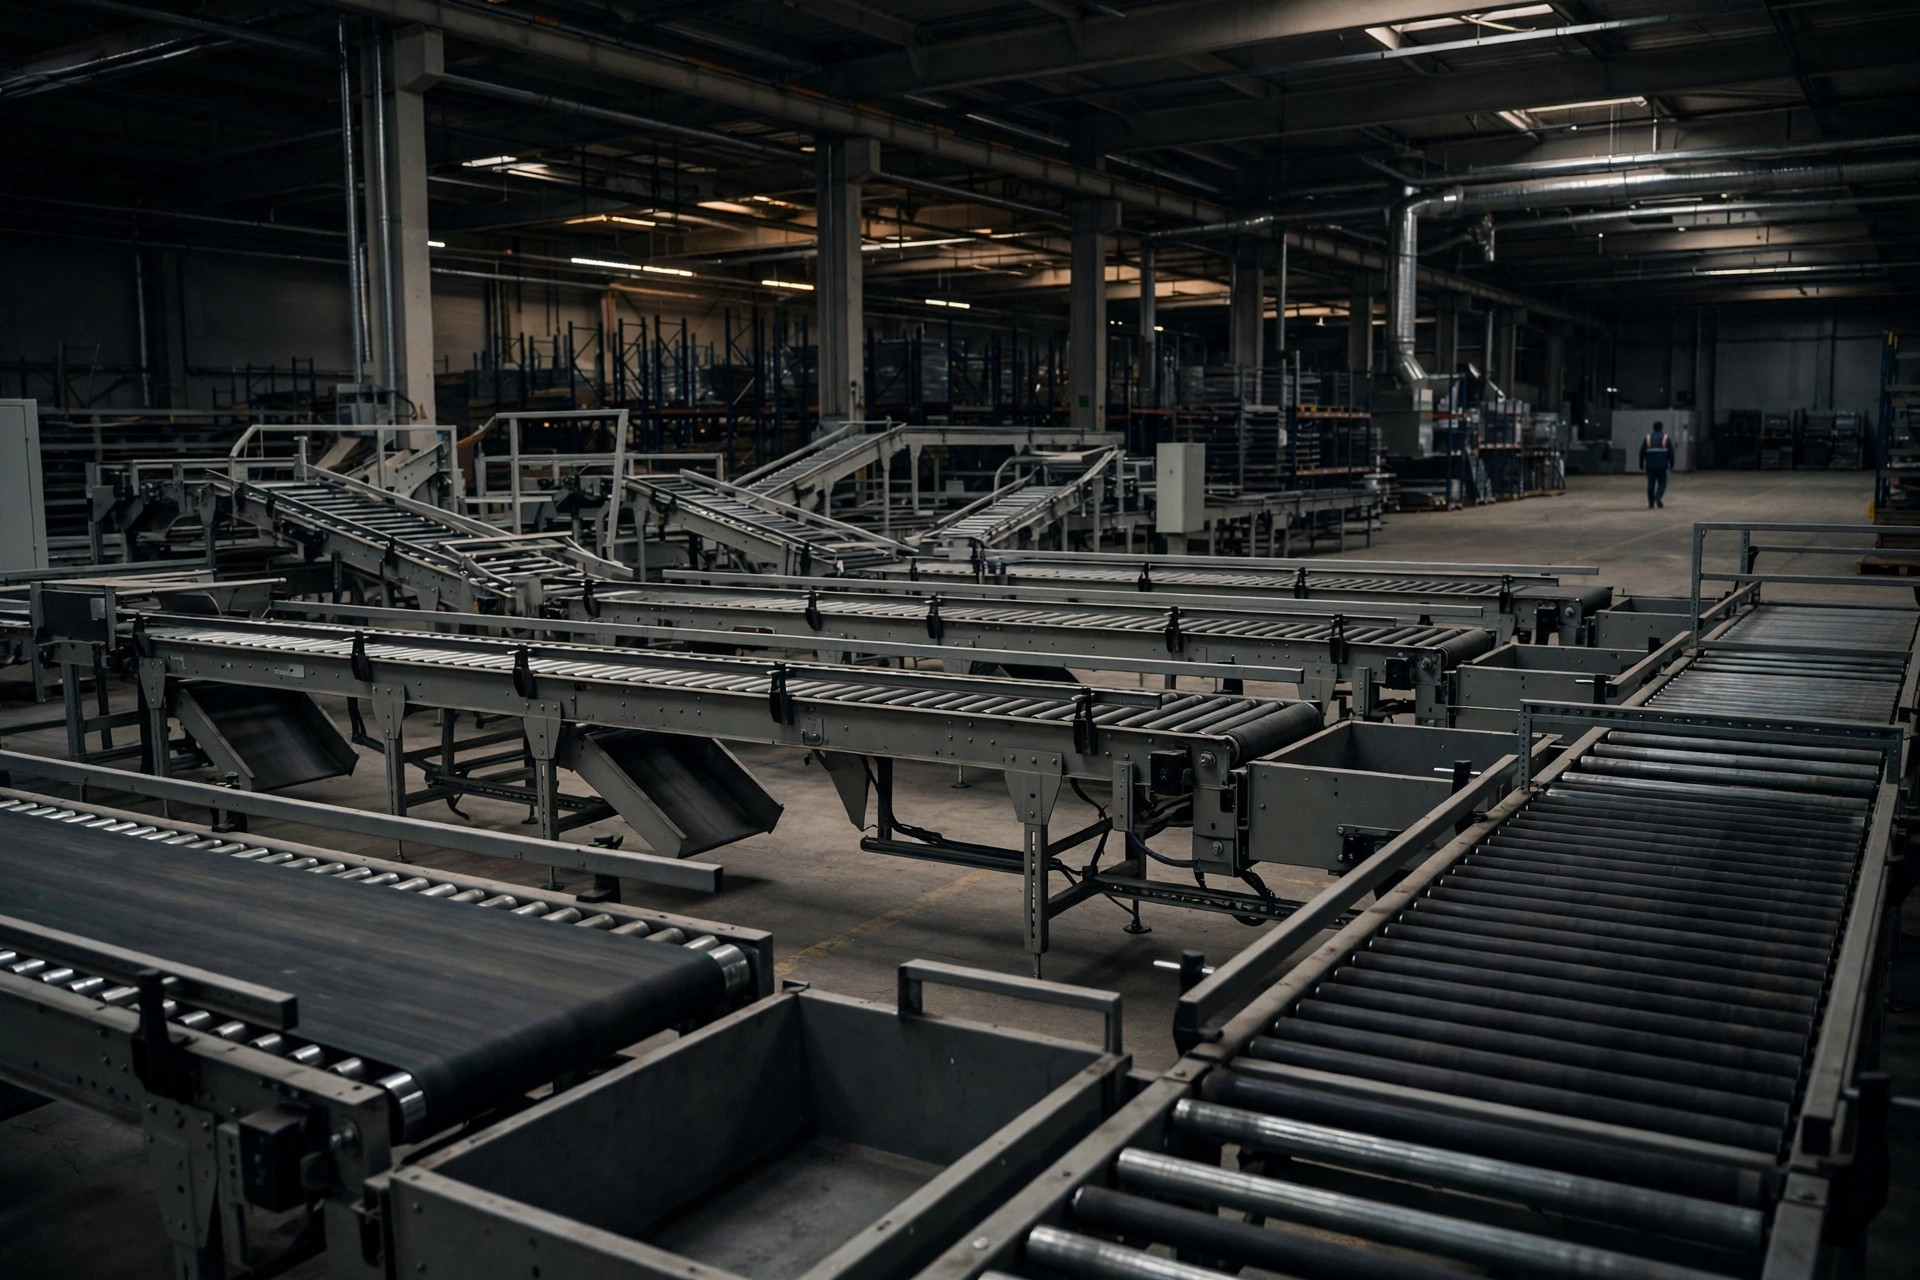
Last year I visited an e-commerce warehouse in eastern China to look at their cross-belt sorter. The nameplate said 30,000 units per hour rated capacity. I stood there with a stopwatch for an afternoon: barely 9,000 units per hour on average, a 30% utilization rate. The remaining 70% of the time, millions of dollars of equipment sat there spinning empty air — the electricity bill kept coming, depreciation kept accruing. This is not an isolated case: across the projects I have worked on, I can count on one hand the automated installations that sustain true utilization above 70% over the long term.
A five-star kitchen for one New Year's dinner
The number-one root cause of idle equipment is buying for the peak and paying for the trough. In 2021, a large e-commerce warehouse in eastern China installed a cross-belt sorter sized for the Singles' Day peak of 80,000 orders per day, at a cost of roughly 9 million yuan. The catch? Singles' Day happens once a year. The other 364 days averaged 22,000 orders a day, and outside the promotion season the sorter ran only 6 to 7 hours daily. It is like keeping a five-star commercial kitchen running year-round for one New Year's dinner — the chef (the equipment) is fine; you just only throw one banquet a year.
Think of it as buying a car: you size it for one annual road trip and end up with a 7-seat SUV, then commute solo the other 364 days while fuel and parking cost just as much. Capacity designed for the peak locks in low utilization by construction — no amount of operational tuning can recover it. The engineering fix is unglamorous: stop designing for the historical peak and design for the 95th percentile instead. Rank a full year of daily order volumes, take the value at the 95th percentile — it covers 347 days, and the 18 most extreme days get handled with surge labor. Equipment investment drops 20 to 30 percent while utilization goes up. Buy pants for your waistline, not for Thanksgiving dinner.
The SKUs moved on; the equipment didn't
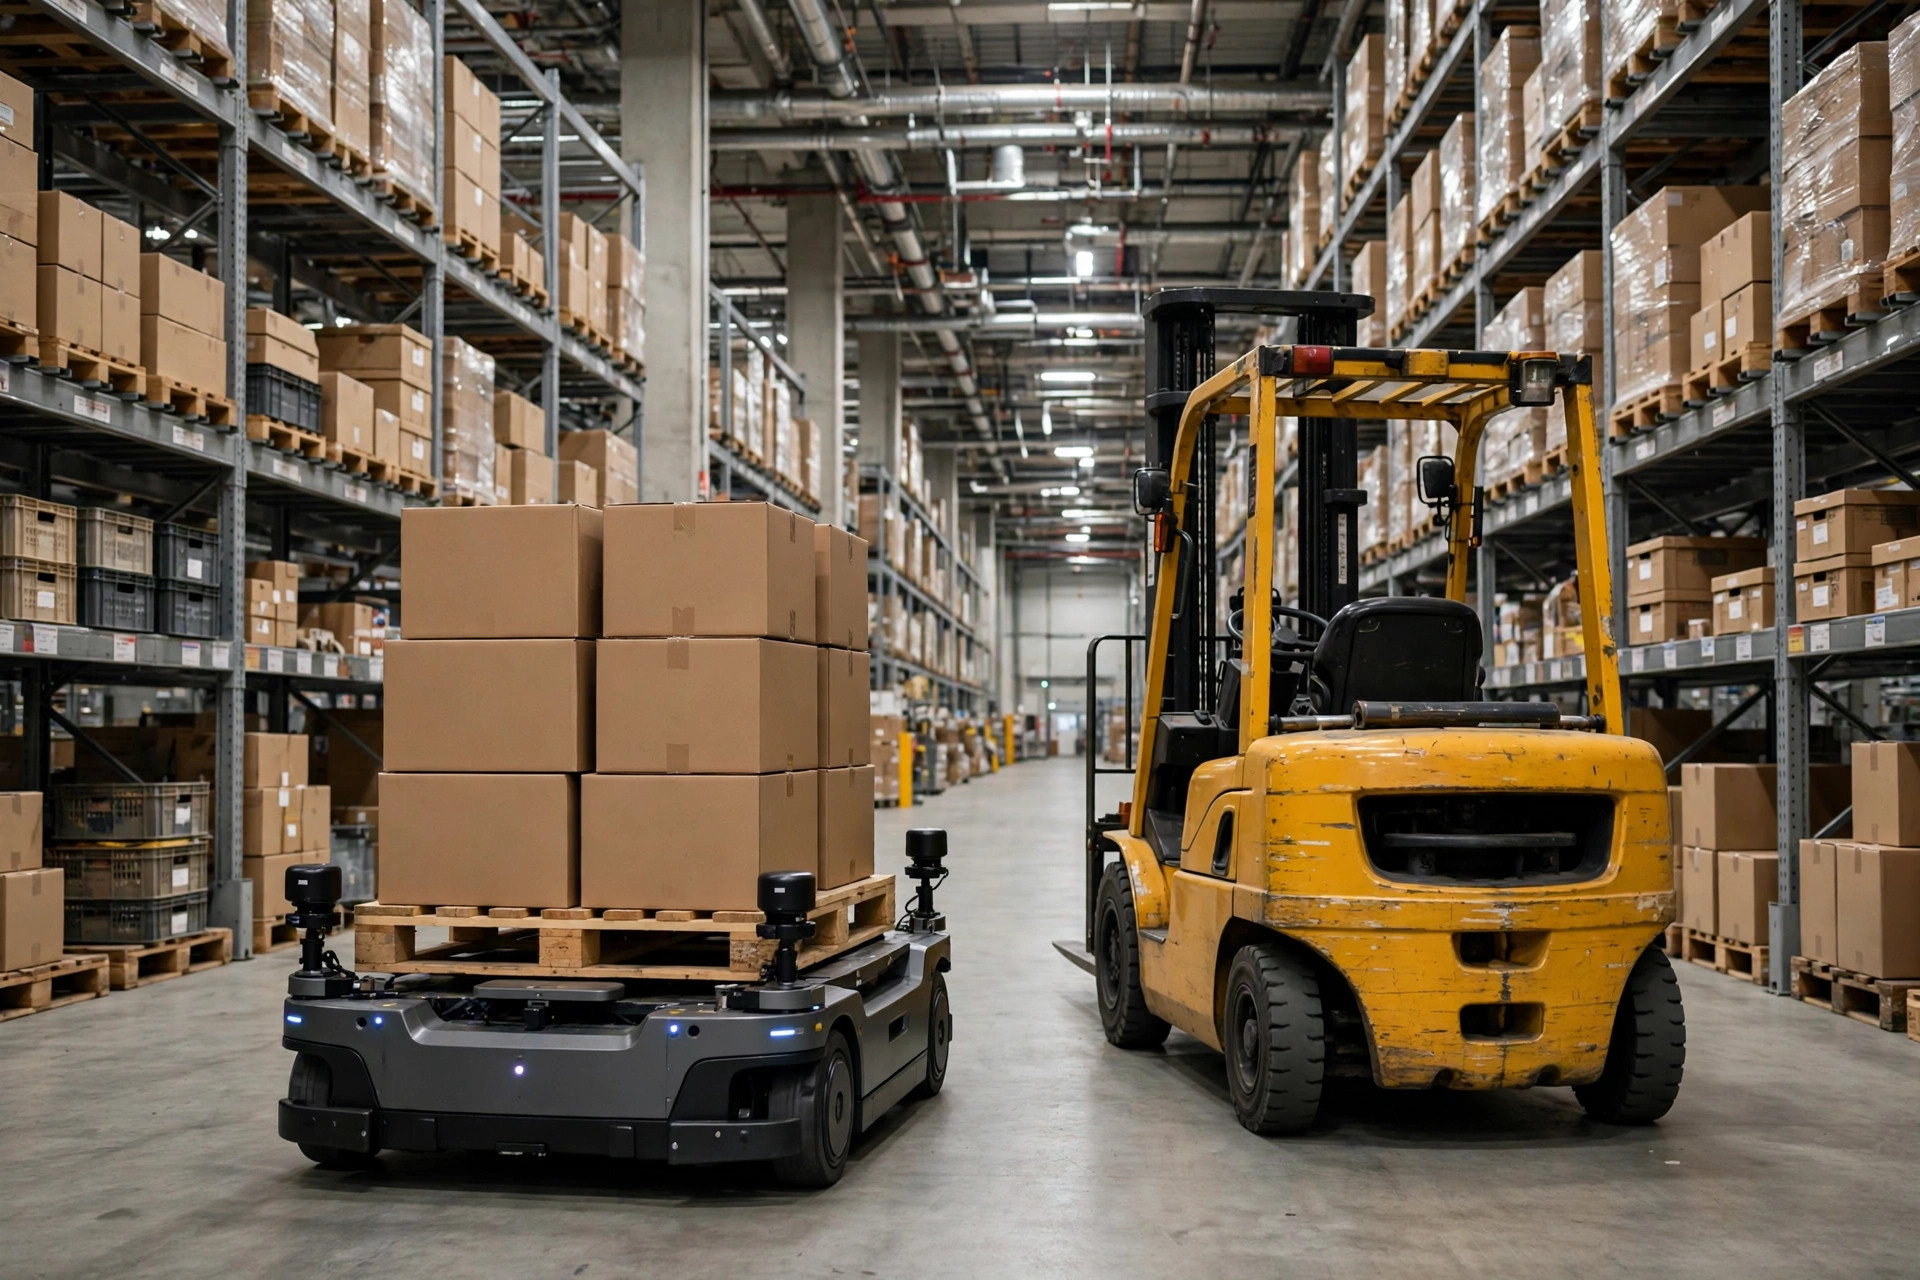
The second root cause is SKU drift that the equipment never caught up with. In 2022, a California 3PL deployed 60 AMRs for goods-to-person. At project approval the catalog held 8,000 SKUs, mostly standard products; two years later it had grown to 24,000 SKUs, more than half long-tail. Upstream manual replenishment simply could not feed the robots fast enough — robots queued up waiting for racks, and the system logged more task-waiting time than task-execution time. Not a single equipment parameter had changed. The world had.
I have seen this movie too many times: the SKU assumption sits on page 3 of the feasibility study, and three years later nobody has opened that page again. The equipment was bought for yesterday's business and is now expected to serve tomorrow's. Do the dilution math: SKUs triple from 8,000 to 24,000 with replenishment headcount flat, and per-SKU replenishment frequency drops to a third. That is exactly where the robots' waiting time comes from. Nobody wrote the SKU growth rate into the contract at signing; three years later, there is nothing to enforce. So ask one more question before you sign: what is this system's SKU ceiling, and does the takt-time guarantee still hold past it?
The machine isn't hungry — upstream just isn't feeding it
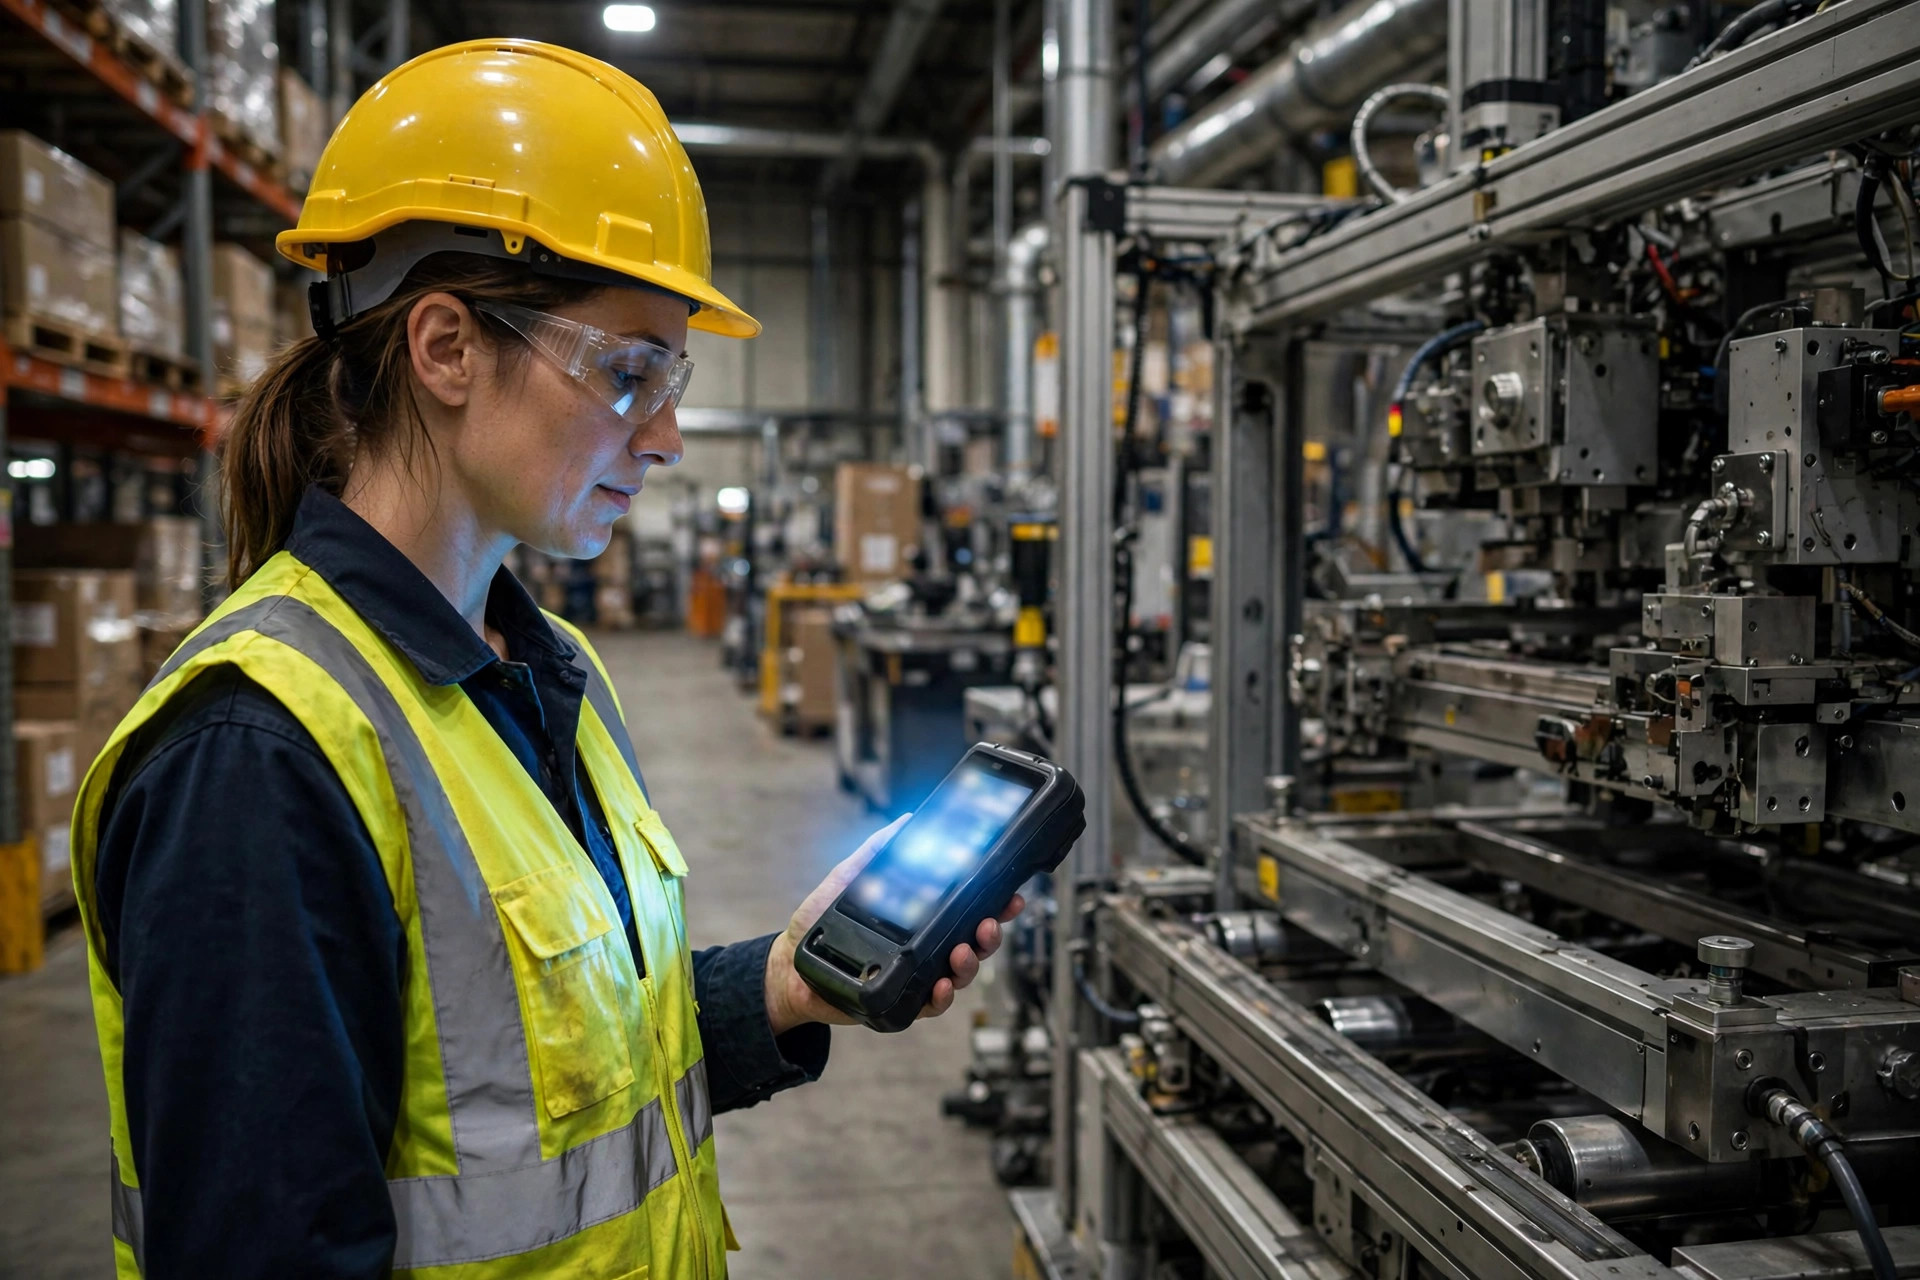
The third root cause is the most unfair: nothing is wrong with the equipment; the upstream and downstream takt times don't match. Inbound feeding arrives in bursts, downstream quality-check and packing are short-staffed, and no matter how fast a single machine runs, system throughput is capped by the shortest board. It is like building a road for a Formula 1 car and then posting a 40 km/h limit — do you blame the car?
And then there is a category I can't help firing at: vanity demand. Management wants the high-tech look. The warehouse next door installed it, so we must too. Automation equals progress. Automation cannot fix management problems: chaotic production scheduling, no ABC classification of SKUs, broken processes — automating on top of that just ties the mess into a knot and gold-plates it. Equipment will not manage for you; it automates your chaos, with leverage.
Idle already? Measure, diagnose, then treat
Step one, measure: pull 30 consecutive days of effective utilization — productive hours over planned operating hours, not the vendor dashboard's beautified online rate. Step two, diagnose: where exactly is the time going — waiting for material, waiting for orders, waiting for people? Read the logs machine by machine and write the causes down. Step three, treat: waiting for material means fixing the replenishment takt, waiting for orders means merging waves, waiting for people means rescheduling shifts. Ninety percent of idle capacity is cured outside the equipment. Idle machines are rarely a machine problem.
How much does each 10 points of idle rate cost in payback time?
Run the numbers and the price of idleness becomes concrete. Assume a $2 million total equipment investment with $600,000 annualized net benefit at full output (simplified linear model, illustrative only; real math must deduct maintenance, energy, and spares):
| Idle rate | Effective utilization | Annualized net benefit | Payback period |
|---|---|---|---|
| 10% | 90% | $540k | 3.7 years |
| 20% | 80% | $480k | 4.2 years |
| 30% | 70% | $420k | 4.8 years |
| 40% | 60% | $360k | 5.6 years |
| 50% | 50% | $300k | 6.7 years |
| 60% | 40% | $240k | 8.3 years |
Every 10 points of idle rate shaved off shortens payback by roughly half a year to a year and a half. A machine idling at 50% means you paid $2 million for a 6.7-year payback; the same money at 20% idle pays back in 4.2 years. The 2.5-year gap was invoiced back at the planning stage. There is also a hidden bill: idle equipment is not free on standby. An idling conveyor still draws power, motors running long hours at low load fail sooner rather than later, and the maintenance contract does not discount itself because you use the machine less. At 50% idle, you pay 100% of the ownership cost for 50% of the output — that is the real loss.
Here is the contrarian read: 70% of idle capacity is baked in during planning. The capacity assumption, the SKU-mix assumption, the takt-time assumption — get those three numbers wrong in the feasibility study and no amount of parameter tuning or shift rescheduling by the operations team can save the project. Most of the blame operations carries actually belongs to planning; the blame chain is just too long for anyone to look backward.
So is the money worth it? Watch this one number: effective utilization, defined as actual productive hours divided by planned operating hours. Estimate it before approval, review it monthly after go-live. If it sits below 60% long-term, forget ROI and fix the idleness first. Hold it steadily above 65%, and only then does the payback conversation mean anything. Remember: equipment is bought to be used, not to be toured.
By Da Liu, Automation Engineer