A vendor's AMR ROI calculator takes your headcount and hourly wage and spits out a green number: 14-month payback. I re-ran the math for a Midwestern 3PL running 12 bots — same fleet, same building — and payback moved from 14 months to 32. The missing 18 months hide in three costs the calculator never asks you about.
To be clear, the calculator isn't miscalculating. It's answering a narrower question than the one you're asking. It compares the sticker price against the hourly wage. Three costs never make it into the formula — true labor cost, five-year total cost of ownership, and the FTE displacement rate. Each one stretches payback on its own. Stacked together, doubling it is normal.
The first cost every AMR ROI calculator gets wrong: labor
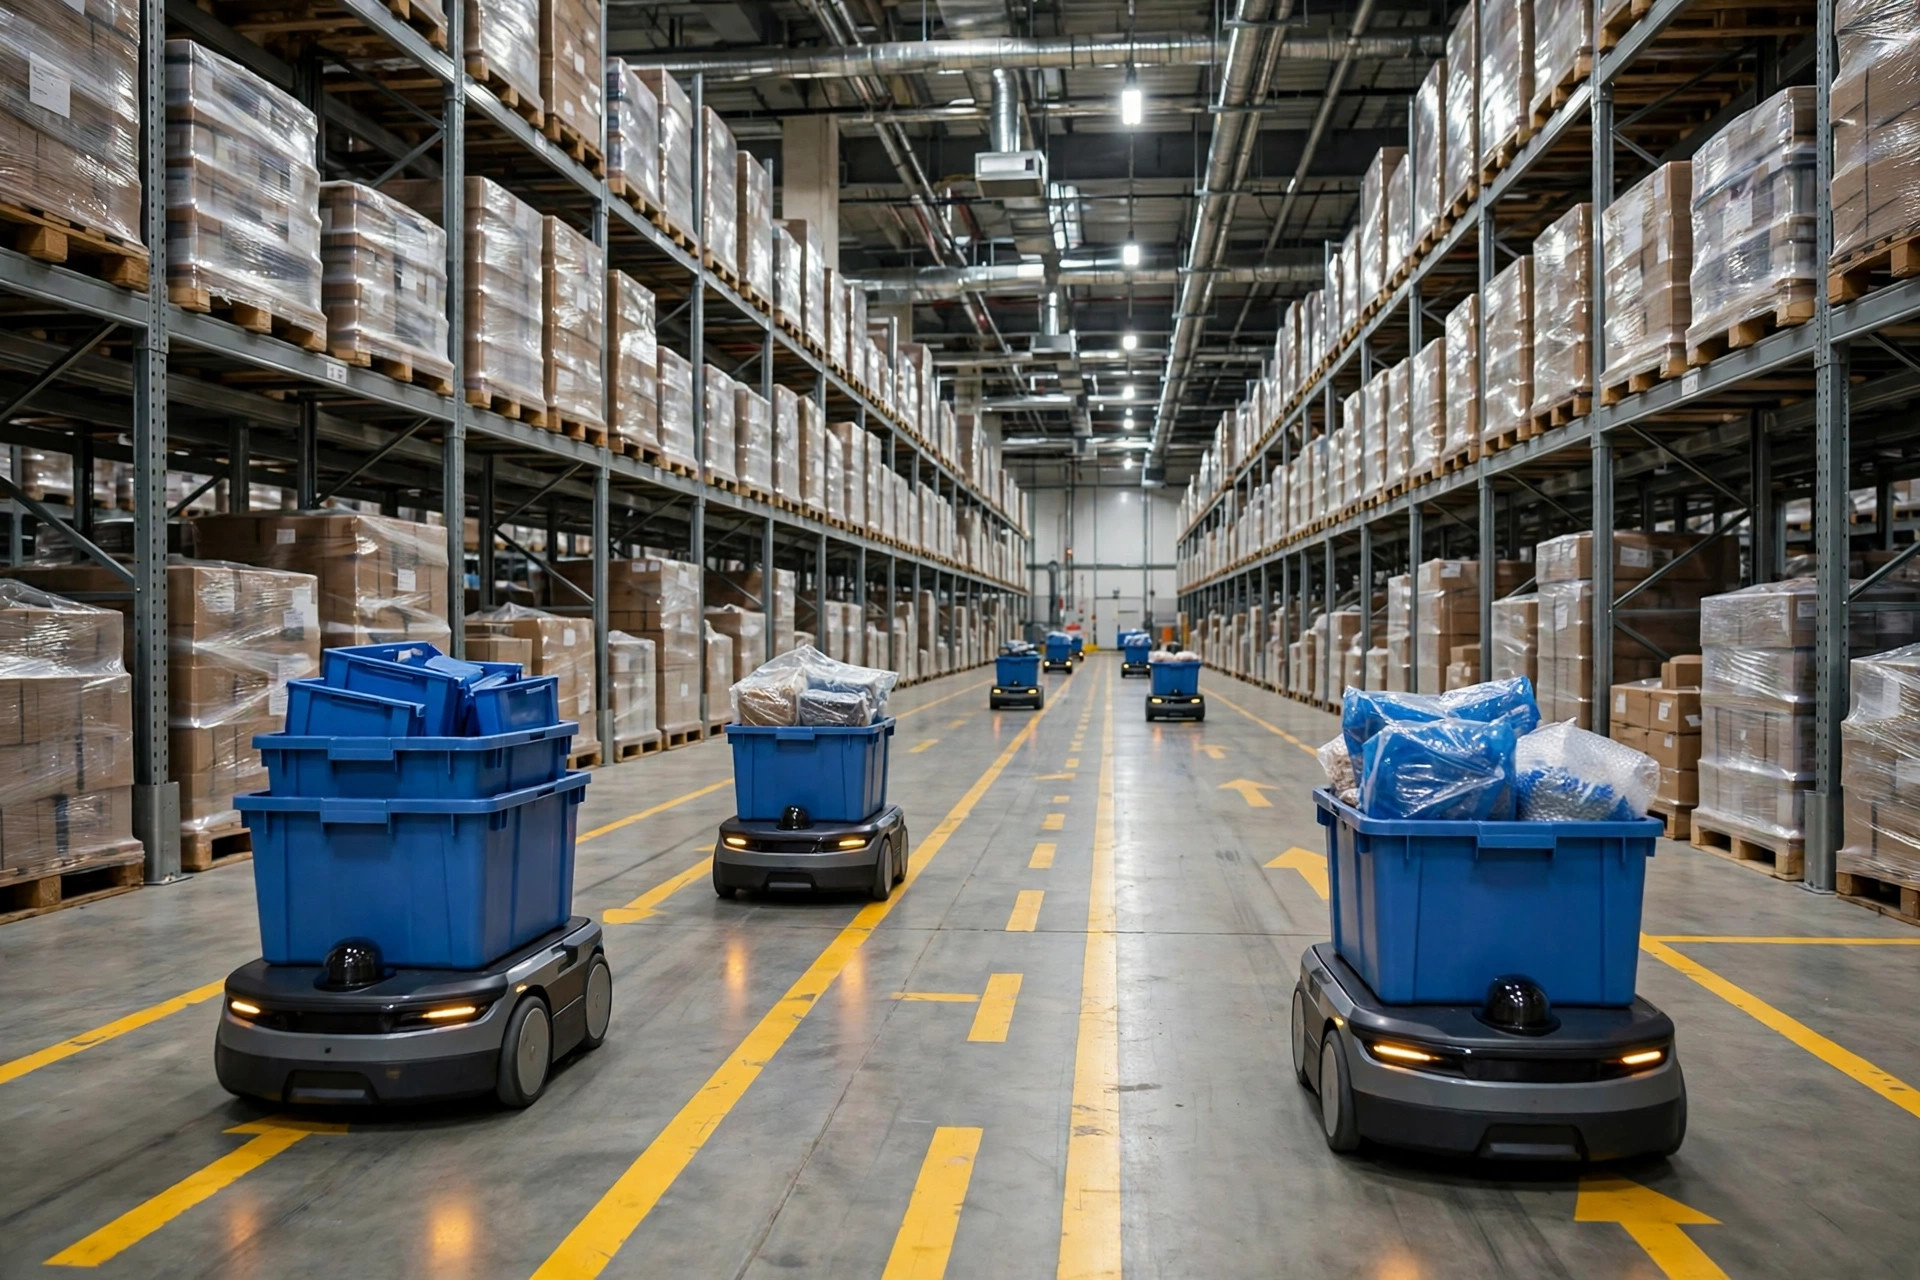
In 2023, a Midwestern 3PL deployed 12 AMRs for tote transport. The vendor's calculator said: 12 bots replace 14.4 FTE at $22 an hour, $659k saved a year. Beautiful number.
I asked their ops director three questions. Did it include benefits and payroll taxes? The cost of recruiting and training replacements? Shift differentials and overtime premiums? Three no's.
The hourly wage is the tip of the labor-cost iceberg. A $22-an-hour worker is $45,760 a year over 2,080 hours. Add Social Security, Medicare, workers' comp, health insurance — multiply by 1.3 to 1.4 — and the fully loaded cost lands around $61k. Then there's churn. Frontline warehouse turnover means every replacement costs $3k–5k in recruiting, training, and ramp-up damage. At 30–50% annual turnover, that's roughly another $1.5k a year amortized into every FTE slot.
| Cost line | Vendor calculator | My math ($22/hr example) |
|---|---|---|
| Wage × 2,080 hrs | $45,760 | $45,760 |
| Benefits & taxes (×1.3–1.4) | Ignored | ×1.35 → $61,776 |
| Turnover recruiting/training, amortized | Ignored | $3k–5k per hire × turnover rate → ~$1.5k/yr |
| Fully loaded annual cost per head | $45,760 | ~$63k |
Wait — if true labor cost is higher, shouldn't payback be faster? On this line alone, yes. The vendor is undercounting your savings. But don't relax. The vendor makes it all back, with interest, on costs two and three.
Why no AMR ROI calculator shows you TCO
The number on the quote is a down payment. Integration runs 12–25% of equipment cost: WMS integration, site mapping and commissioning, chargers, network drops, safety rework. For that Midwestern 3PL it was 22% — the integration bill alone cost more than a bot and a half.
Then annual maintenance: 8–12% of equipment cost per year. Read the "per year" twice. Over five years, that's another 40–60% of the purchase price walking out the door. Add software licenses, map maintenance, spare parts, and internal project labor — line items no calculator has a field for — and here's the five-year bill:
| Line item | Share of equipment cost | 5-yr total (E = unit equipment cost) |
|---|---|---|
| Equipment | 100% | 1.00E |
| Integration | 12–25% | 0.12–0.25E |
| Maintenance × 5 yrs | 8–12%/yr | 0.40–0.60E |
| Hidden: software licenses, map upkeep, charging infra, spares, internal labor | — | 0.10–0.30E |
| 5-year TCO | — | 1.62–2.15E |
Read it again: over five years, one AMR really costs 1.6 to 2.1 times its quote. The equipment is barely half the total. The calculator understates your labor savings by about 38% and understates the machine cost by nearly 2x. Numerator and denominator wrong in opposite directions — no wonder the payback looks green.
Here's the contrarian read: the most expensive part of an AMR project isn't the robots. It's everything that lets humans and robots work in the same building. Any proposal that talks unit price but not integration and maintenance will change its number on the last page.
1.2 vs 0.3: the same FTE number, 4x apart
This is the deadliest of the three. Where does "1.2 FTE per bot" come from? Peak season. During the holiday rush, a bot running around the clock genuinely covers 1.2 people's work.
But payroll runs 52 weeks a year. The slow season? In a single-shift warehouse the bot works 8 hours a day and utilization never climbs. Annualized, one AMR displaces more like 0.3–0.5 FTE. 1.2 versus 0.3 — the same metric, 4x apart.
| Vendor math | Conservative math | |
|---|---|---|
| FTE displaced per bot | 1.2 (peak, fully utilized) | 0.3 (annualized utilization) |
| 12 bots displace | 14.4 FTE | 3.6 FTE |
| Annual labor savings (at ~$63k/head) | $907k | $227k |
The numerator doubled, the denominator quartered. Stacked, that's the entire gap between 14 months and 32. That Midwestern 3PL was sold 14 months; my math says 32. The bots went live in 2023 and still haven't paid back. Their CFO flinches at the letters A-M-R.
Running the AMR ROI calculator three ways: 7 months vs 32 months
Put all three costs in one formula and run that 12-bot fleet three ways. Full disclosure: every payback figure below is model arithmetic from the input ranges above, not anyone's promise. E = unit equipment cost, shown at a tens-of-thousands-of-dollars scale for illustration — substitute your vendor's actual quote.
Payback (years) = unit investment ÷ unit annual savings = E×(1+integration rate) ÷ (FTE per bot × fully loaded annual cost)
| Scenario | FTE/bot | Integration | Annual maintenance | 12-bot investment | Annual savings | Payback (E ≈ $40k illustrative) |
|---|---|---|---|---|---|---|
| Optimistic | 1.2 | 12% | 8% | 13.4E | $907k | ~7 months |
| Neutral | 0.75 | 18% | 10% | 14.2E | $567k | ~12 months |
| Conservative | 0.3 | 25% | 12% | 15.0E | $227k | ~32 months |
Same fleet, different assumptions: 7 months to 32. A vendor calculator always shows you the optimistic column, because its input form has no field for utilization or integration rate.
A counter-case, because I'm not anti-robot. In 2024, an e-commerce DC in Ontario, California asked me to evaluate 20 AMRs: $24-an-hour labor, three shifts, no slow season. Neutral-to-optimistic math said 8-month payback and seven figures of five-year net savings. My verdict: buy, don't hesitate. Automation pays for expensive people — the higher the wage and the fuller the shifts, the better the math. Flip it: the warehouse with the cheapest labor is precisely the one that should not buy AMRs.
So here's a decision rule you can compute:
Payback (years) = E×(1+integration rate) ÷ (FTE per bot × fully loaded cost per head)
Fully loaded cost = hourly wage × 2,080 × 1.35 + turnover amortization. FTE per bot by shift pattern: single shift 0.3–0.5, two shifts 0.6–0.9, three full shifts 1.0–1.2. Integration at 12–25%; if the quote doesn't break out integration, use 25%.
The red line: 3 years. Over 3 years, walk away. Example: single-shift warehouse, $18/hr, fully loaded ~$52k a year, 0.3 FTE per bot — one bot saves $15.6k a year. At a $50k unit price with 25% integration, that's $62.5k invested per bot: 4-year payback, and the five-year TCO runs underwater. That money is wasted.
By Lao Zhou, Logistics Cost Analyst