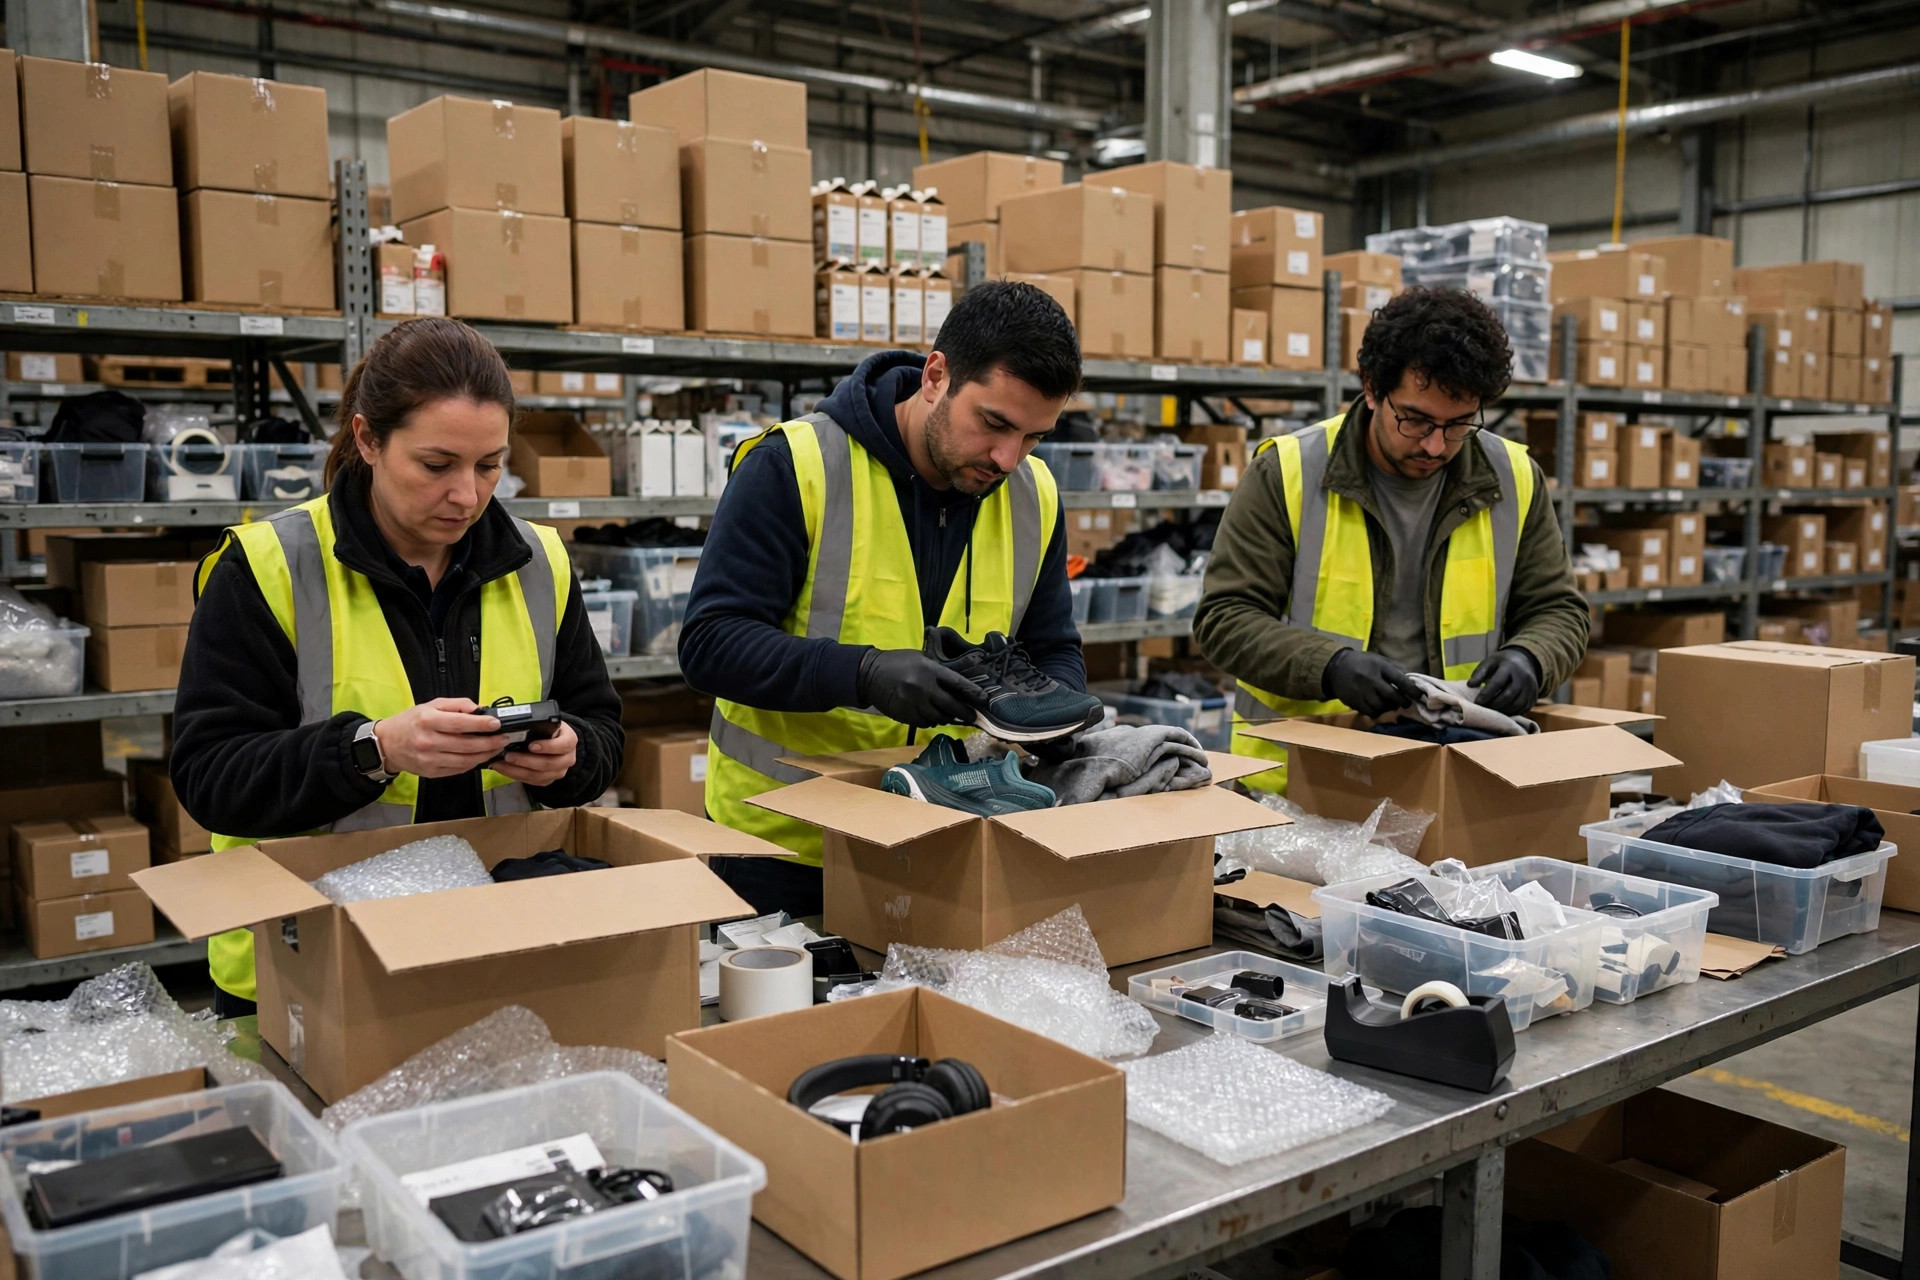
Last month, a product research tool's "8,000 units a month" estimate cost one of my warehouse clients a small fortune. He's a home-storage seller out of Shenzhen. He stocked 12,000 units based on that number — 45 days of ocean freight plus a safety buffer — and asked me, almost in tears, whether I could help him liquidate the 4,000 units of dead stock left over. Real sales? Under 900 units a month. The goods sat in my warehouse for seven months, storage fees ticking, his cash frozen inside cardboard boxes. He finally took the loss and cleared them out.
Full disclosure: I'm not an Amazon seller. I'm the guy with the 3,000-square-meter warehouse. I don't even buy seller tools myself — our little warehouse can't afford to burn cash like that. But from where I stand, behind the shelves, I've watched too many sellers walk in waving tool screenshots and walk out buried under their own inventory. So here's the warehouse owner's take on why sales estimates always run high, and how small-budget sellers can check the real numbers for free.
How seller tools actually build their sales estimates
Here's the uncomfortable truth: neither Helium 10 nor SellerSprite has ever seen Amazon's real sales ledger. Every sales estimate is modeled, not counted.
The whole industry runs on BSR reverse-engineering. BSR — Best Sellers Rank — is Amazon's hourly-updated sales ranking. Tool providers take a batch of products where they know both the rank and the real sales (from sellers who share data with them), fit a "rank-to-sales" curve, and then read every new rank off that curve. Helium 10's own help docs say it plainly: Xray shows a rolling 30-day estimate derived from the main-category BSR, and for variations, the estimate is calculated from the parent ASIN's BSR and then distributed across the children. SellerSprite's own blog is even blunter: estimates are modeled ranges, good for go/no-go decisions, not for precise forecasting.
Once you know that, the four traps that inflate the numbers get obvious:
Trap 1: the variation lump. That listing showing "3,000 units a month" might be twelve colors added together. The tool computes the total from the parent BSR and then "distributes" it — and the distribution logic often dumps most of it onto whichever child variation you're looking at. Last June, a pet-supplies seller in my warehouse fell for exactly this: Helium 10 showed 3,000+ a month on a black variant, so he stocked 6,000 units of black. Turns out twelve colors shared those 3,000 sales, and black did maybe four or five hundred a month. Half of those 6,000 black units are still sitting on my shelves.
Trap 2: the 30-day rolling window. The estimate is an average of the last 30 days — Lightning Deal spikes and off-Amazon traffic pushes included. The number you see in November was earned during somebody's Black Friday blitz. Your freight takes 45 days; by the time your goods land, it's January. Stocking the slow season with peak-season numbers is how inventory goes to die.
Trap 3: ad-fueled rankings. BSR counts units sold. It doesn't care how they were sold. A ranking bought with thousands of dollars in daily ad spend gets modeled as "natural demand." You copy the stocking plan without the ad budget, and your sales come in at half the estimate if you're lucky.
Trap 4: head-of-curve bias. The rank-to-sales curve is fitted on head products, where data is dense. It's most accurate at the top and fuzziest in the long tail — which is exactly where small sellers like us have to play. In your segment, the model is structurally guessing high.
The counterintuitive part: the optimism might be the business model
Here's a take that might sting: systematically inflated estimates may not be a technical failure. They may be the business model.
Think about it — product research tools sell hope. If the dashboard kept telling you "200 units a month, don't bother" and "300 units, no chance," would you renew? Slightly optimistic data keeps users feeling that opportunity is everywhere. I'm not saying anyone cooks the books on purpose; it's just the gravity of any business that sells "opportunity." Job boards do the same thing — the posted salary always looks a touch better than the real one.
So my position: don't fight the tool over accuracy. Fight over how you use it. A tool's real value was never finding you a winner — winners aren't that easy to find. Its real value is falsification: quickly ruling out the obvious losers. If it says 200 units a month, believe it — that product is dead. If it says 8,000, don't you dare believe it can really do 8,000.
Our cheap tricks: three free ways to check real sales
The big-company playbook — subscribe to three data providers and cross-validate — is not for us. We can't afford to burn cash like that. Here are three zero-cost tricks passed around in our warehouse. You can start tomorrow:
Trick 1: the add-to-cart 999. Add the competitor's product to your cart, change the quantity to 999, and the page shows the real remaining stock ("only 37 left"). Screenshot it at the same time every day for seven days. The daily drop is true daily sales — more honest than any tool. Works beautifully on FBA listings, where inventory movement basically equals real orders.
Trick 2: review math for returns. Read the competitor's negative reviews, focusing on "poor quality," "not as described," "broke after two uses." If those make up more than roughly a third of the bad reviews, slash the paper profit hard — return rates and support costs can eat half your margin. No tool will tell you that.
Trick 3: ask your warehouse for outbound velocity. This one's my home turf. Nobody knows how fast goods move off the shelf like a 3PL does. If you already have stock in an overseas warehouse, just ask: "How many orders a day did this SKU ship in the last 30 days?" That's real outbound data, free of charge. The truth is on the shelves, not on the screen.

The math: stocking by the tool vs. stocking by the cheap tricks
Take my client's product as an example (figures rounded, but the scale is real). Look at what the two approaches cost:
| Stocking by the tool estimate | Stocking by cheap verification | |
|---|---|---|
| First order | 12,000 units | 2,500 units |
| Cash locked in goods + freight | Deep six figures | Low six figures |
| Time sitting in the warehouse | 7 months and counting | Sold through in 45 days, reordered |
| Storage fees | Monthly, compounding the pain | Negligible — it moved |
| Worst case | Forced liquidation, five-figure loss | A small, survivable test-batch loss |
The math is simple: one wrong tool-based bet loses big money; one slow cheap-trick bet loses small money. For a small business, staying alive beats running fast.
What happened to that seller
After clearing the dead stock, the Shenzhen seller wised up on his second product. Same category. This time he ran the 999 trick on competitors for two weeks, calculated true daily sales of roughly 60–80 units, and stocked only 2,500 units first. Sold through in 45 days, reordered immediately. Now he tells everyone: "Whatever the tool says, I mentally take 30% off first."
We even turned this into a free service: new clients get a "stocking health check" — we hold their tool screenshots up against our outbound experience. Plenty of them halve their first order on the spot. The service makes us nothing directly, but clients die less often, and our storage fees get paid on time. Small warehouses have their own way of surviving.
Product research for small sellers: three honest tips
- Take 30% off every tool number before you believe it. The street wisdom in seller circles goes further: run two tools and trust the lower one. Better to understock than overstock.
- Use tools to rule out, not to confirm. If it says no good, it's probably no good. If it says great, you still have to verify yourself. A product research tool is a sieve, not a fortune teller.
- First-order formula: 30-day estimate × 0.5. Send 200–300 units, test for two weeks, and let the data speak. Reordering is the cheapest "data fee" there is.
Something you can do tomorrow: tonight, add your three target competitors to cart at quantity 999 and screenshot the stock. Do it for seven days. Come back and thank me in a week.
Small warehouses have their own way of surviving — the big players can afford to burn money on trial and error; we can't, so we only believe what the shelves tell us.
By Xiao Ma, Small Warehouse Owner