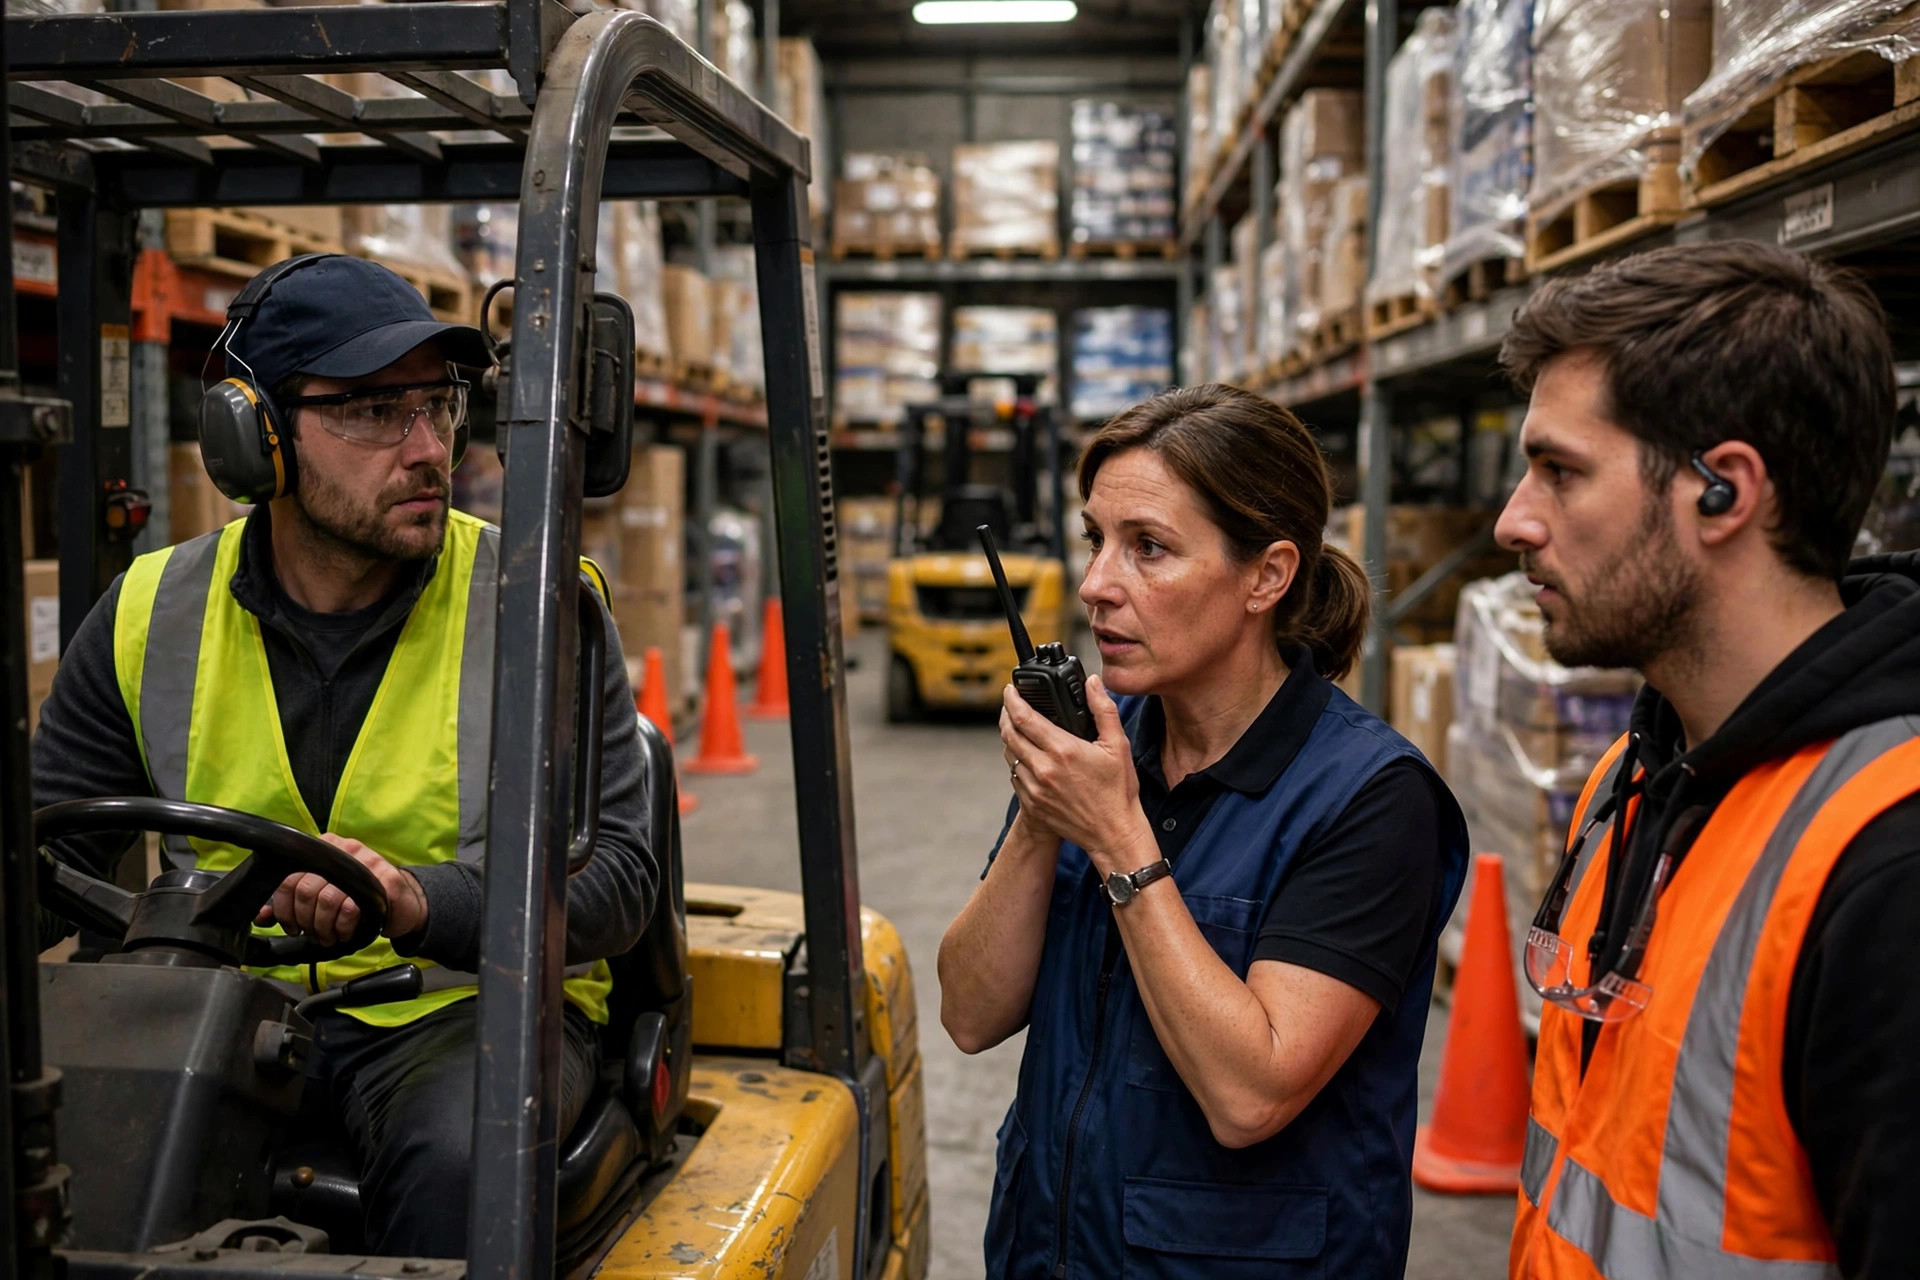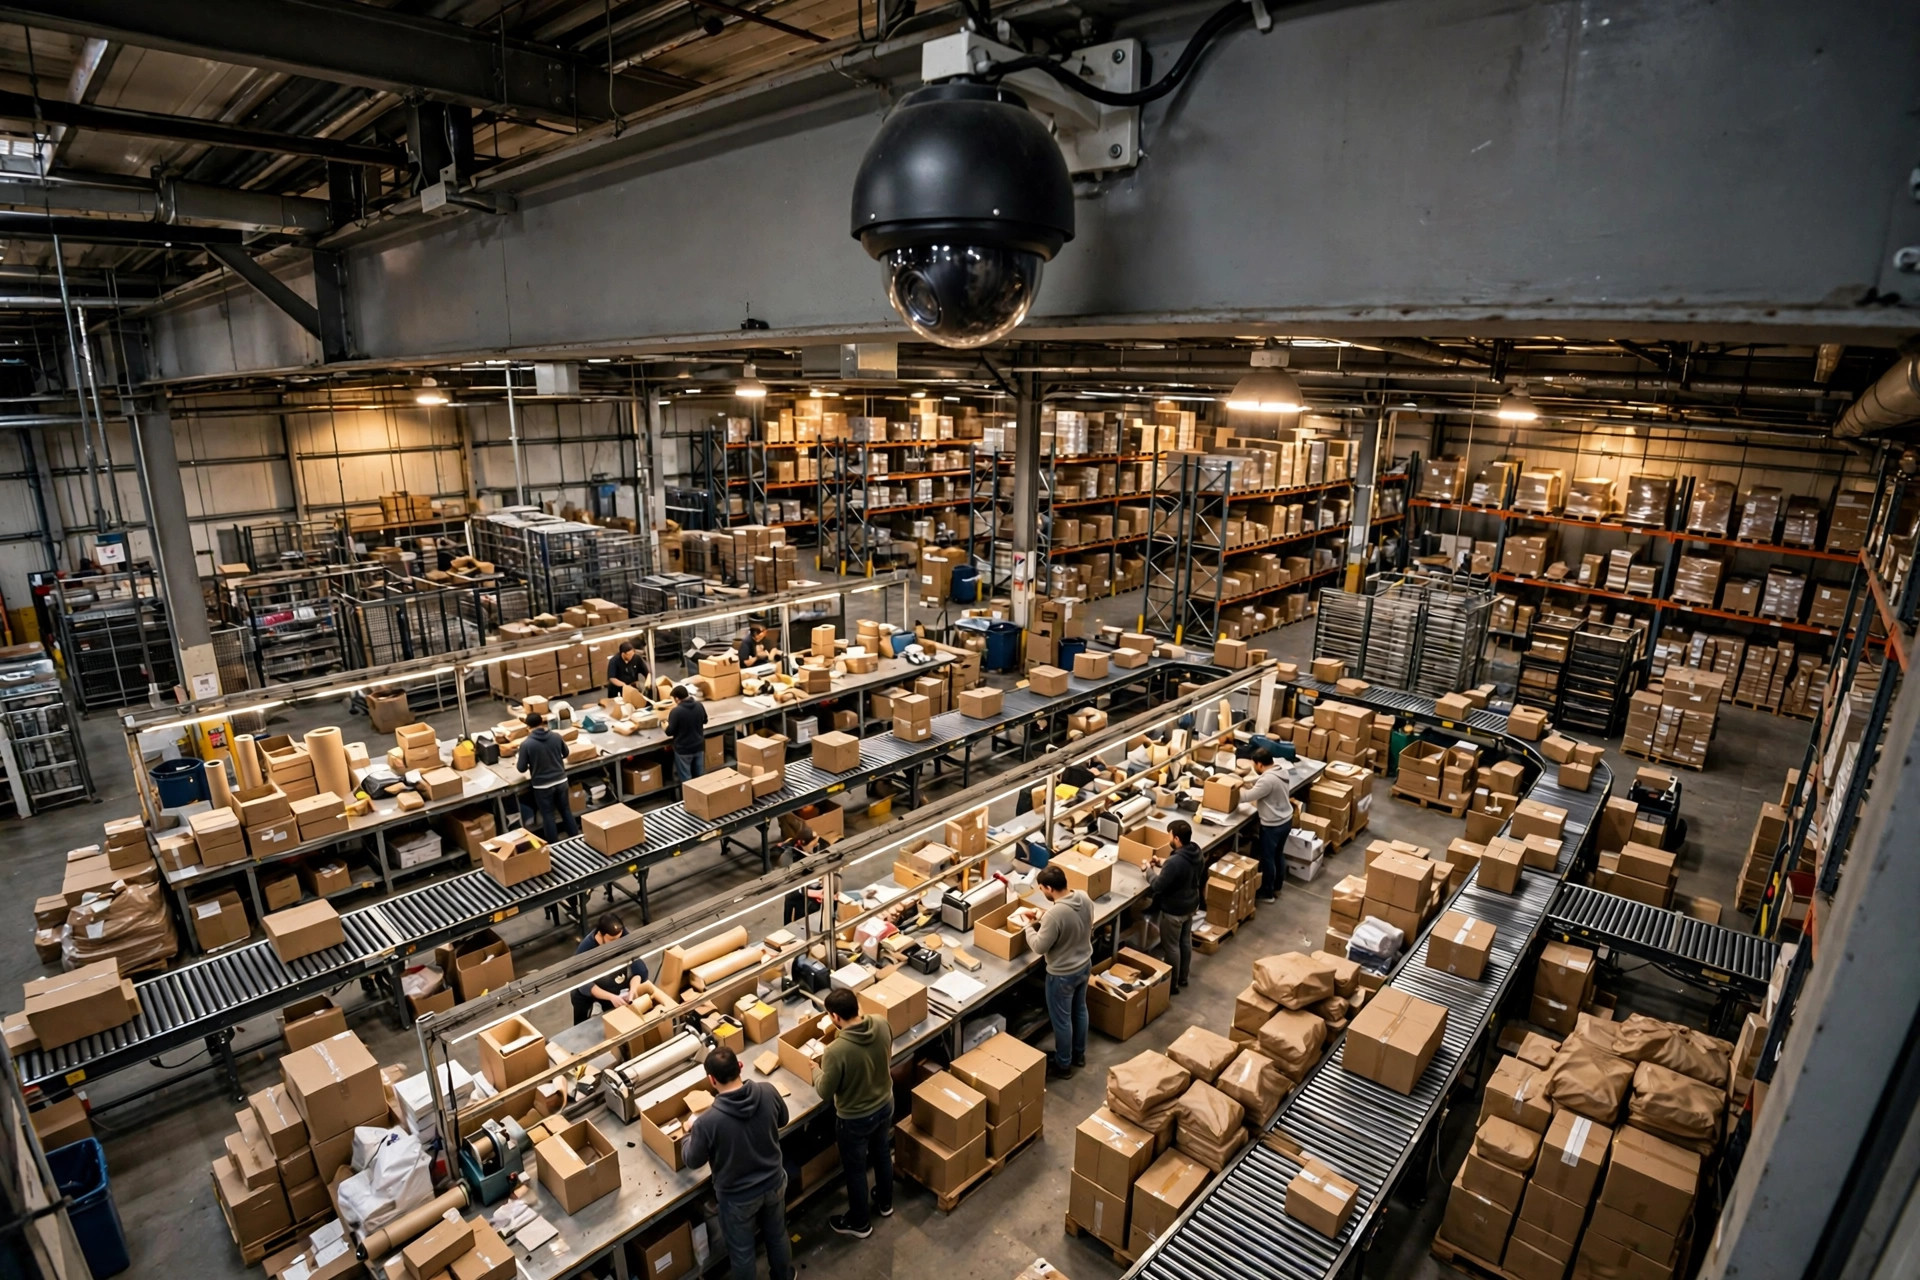
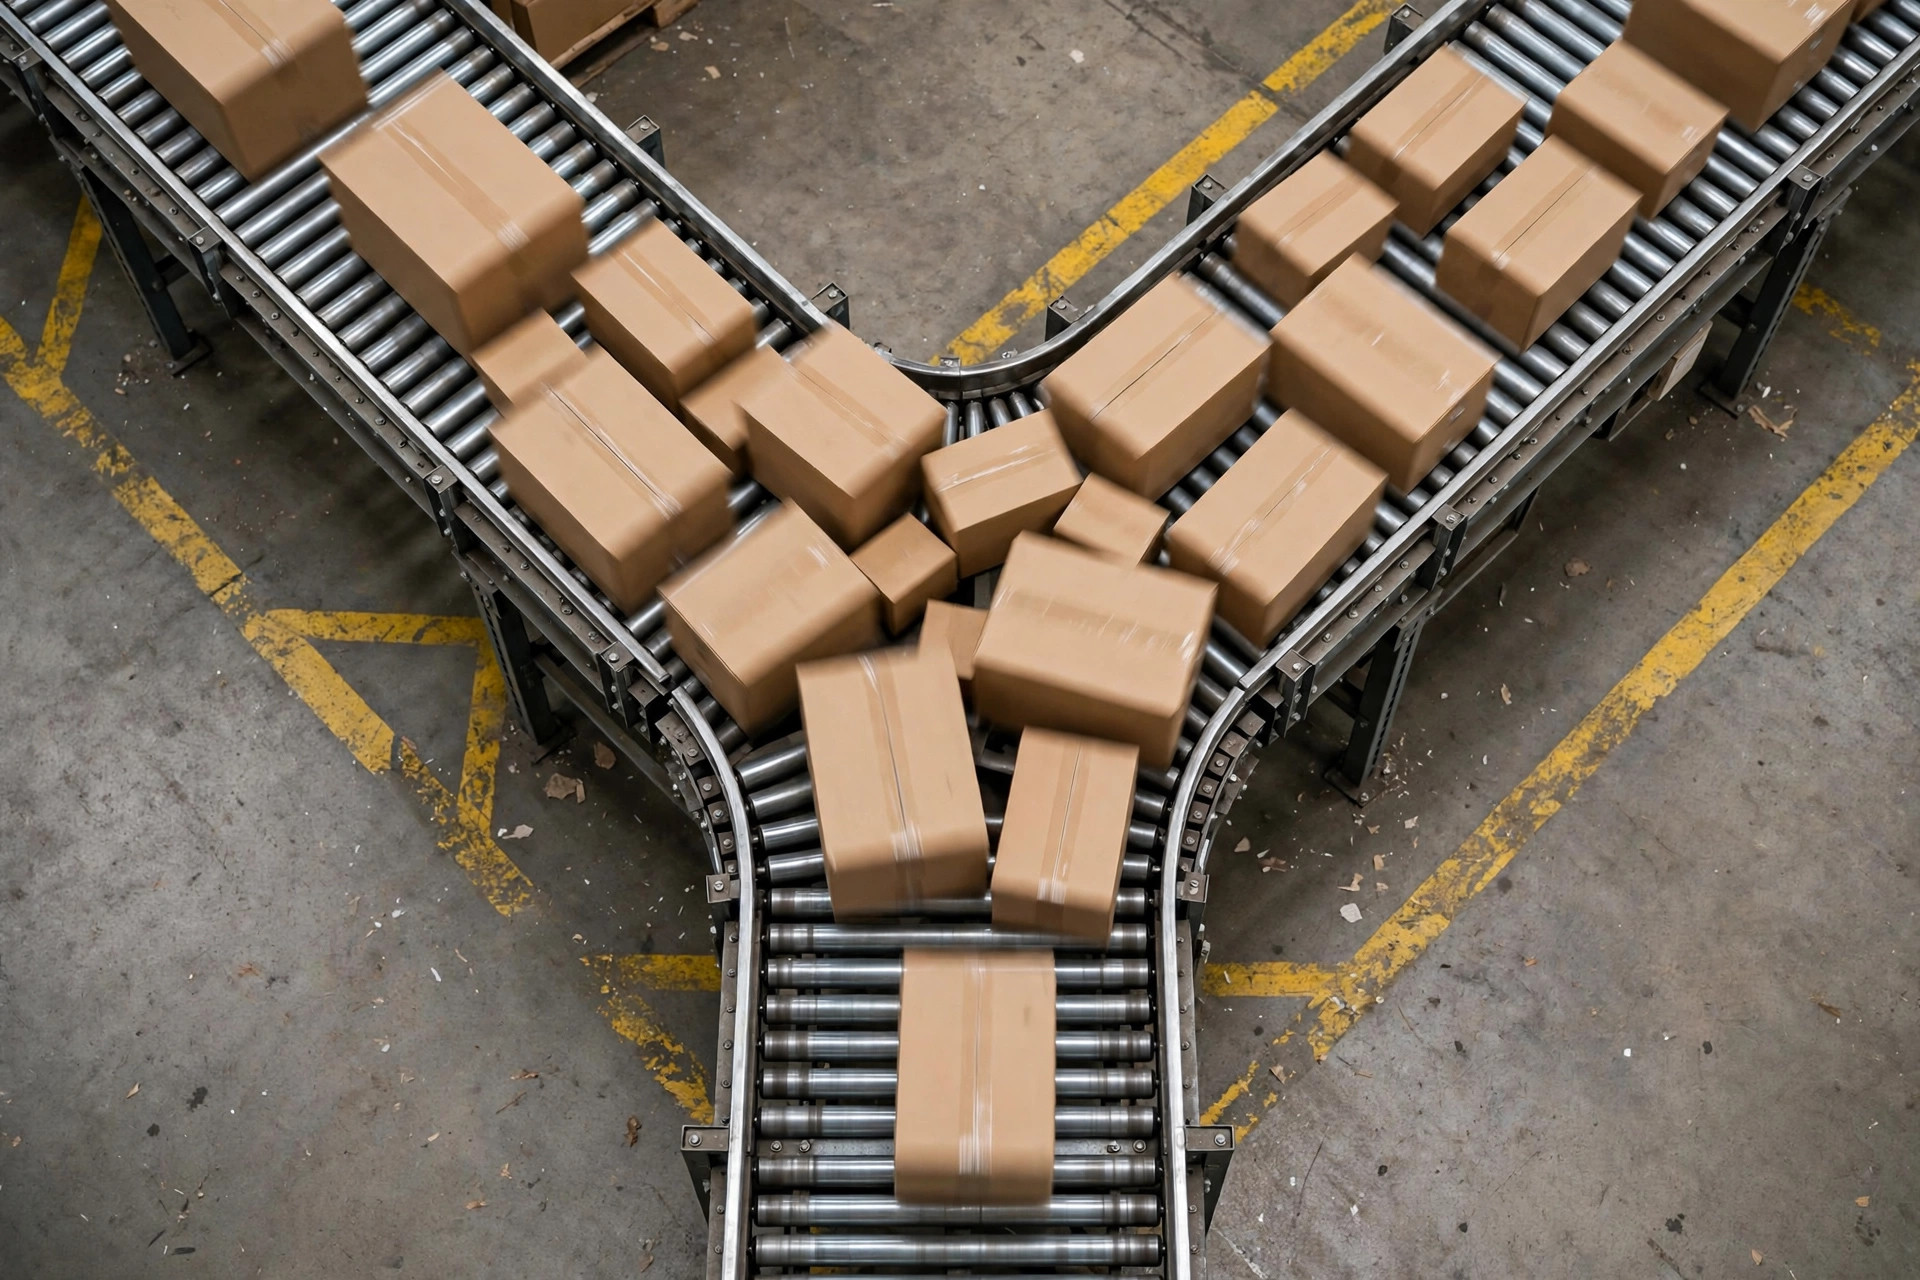
Last fall I spent two full days standing behind the pack stations at a 120,000-square-foot e-commerce fulfillment center in the Inland Empire. I wasn't watching the people. I was watching the ceiling monitors. Every day, just after 2 p.m., the conveyor in front of pack-out turned into a parking lot — cartons queued at the merge point, frozen for ten or fifteen minutes at a stretch. The warehouse manager put a hand on my shoulder. "See that, Lao Mi? Pack-out is the bottleneck. We're short-handed."
I didn't answer. Because the packers didn't look short-handed. Nobody's hands were idle.
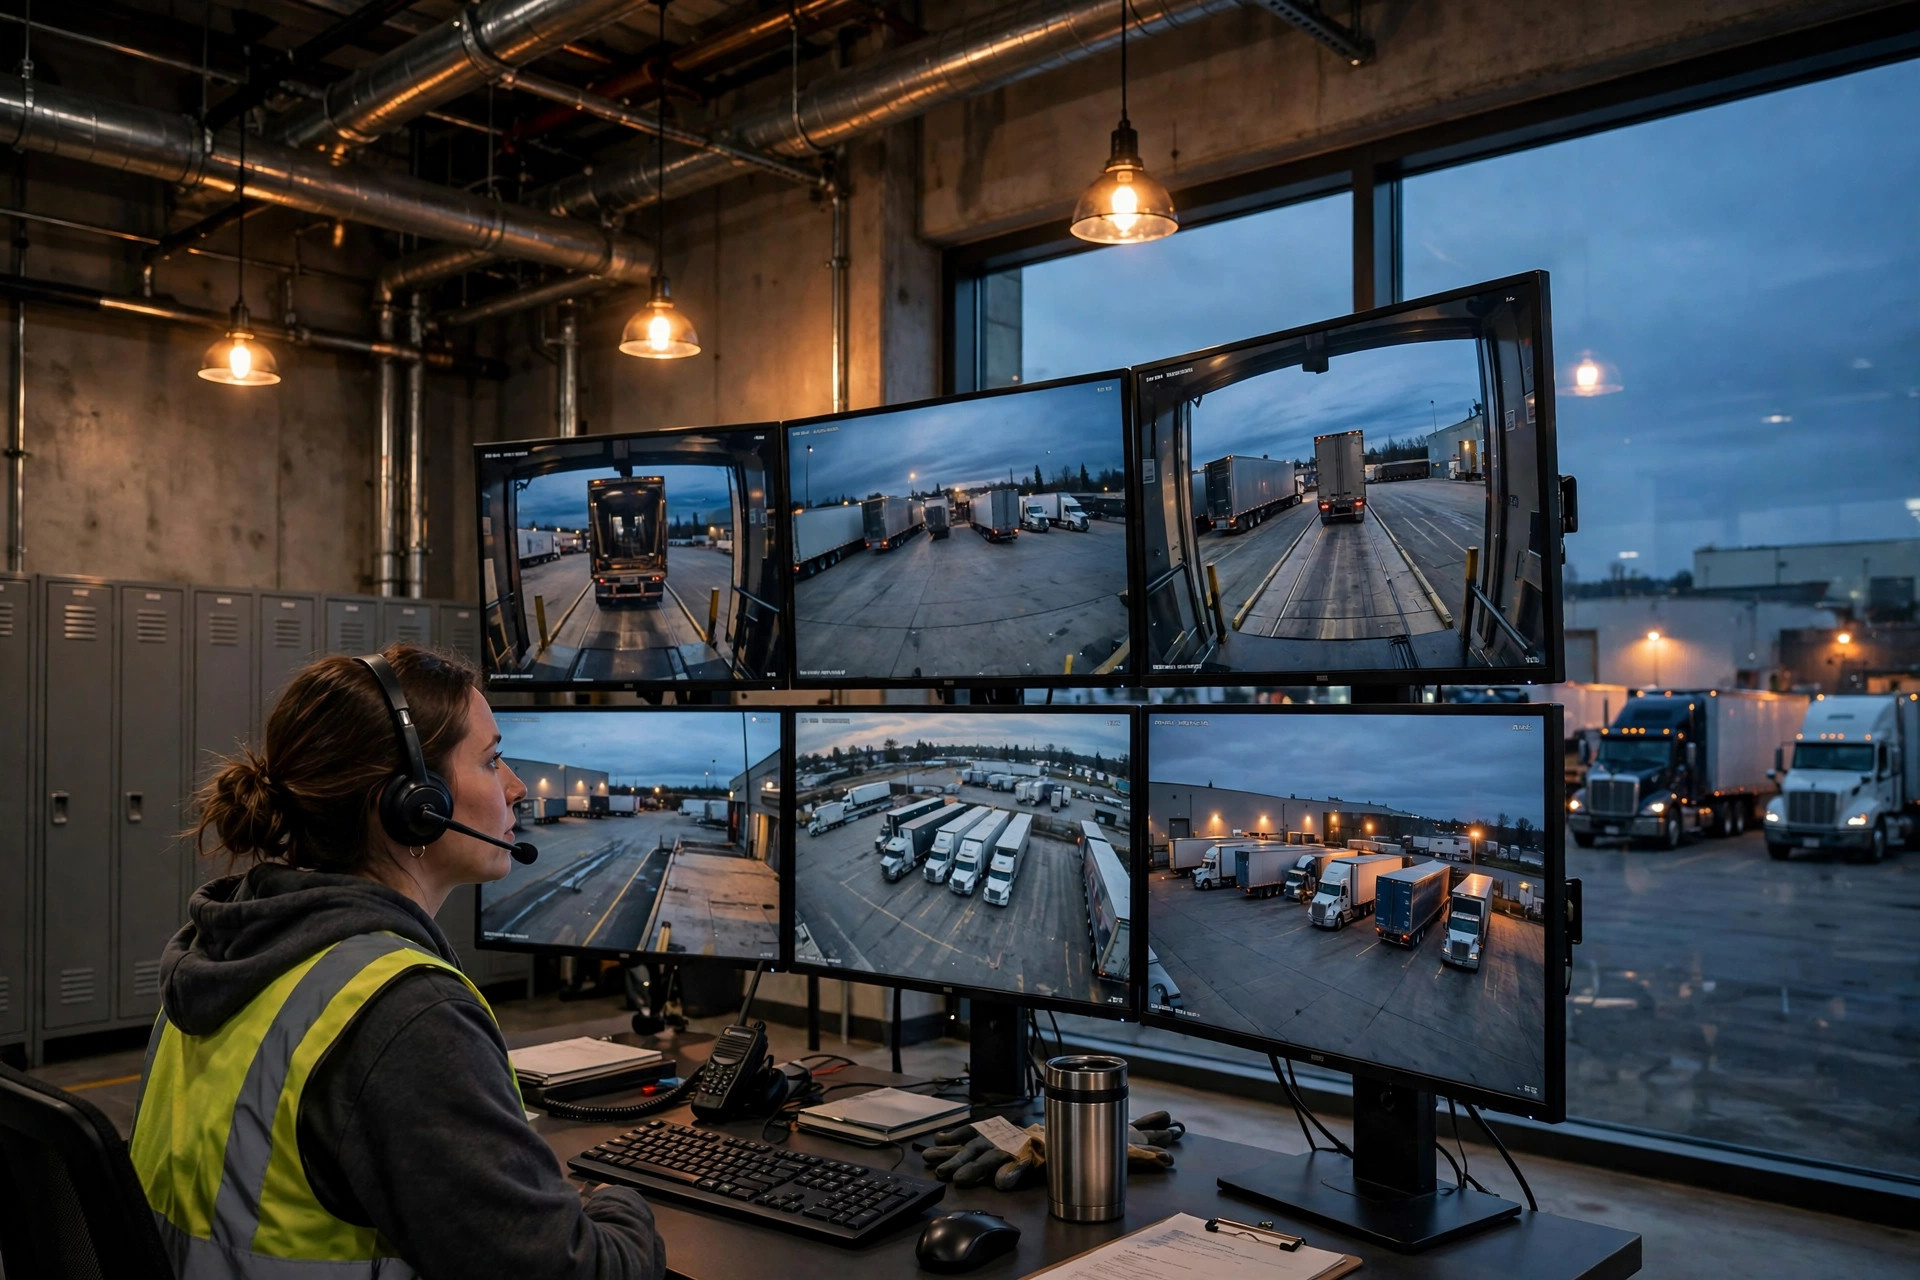
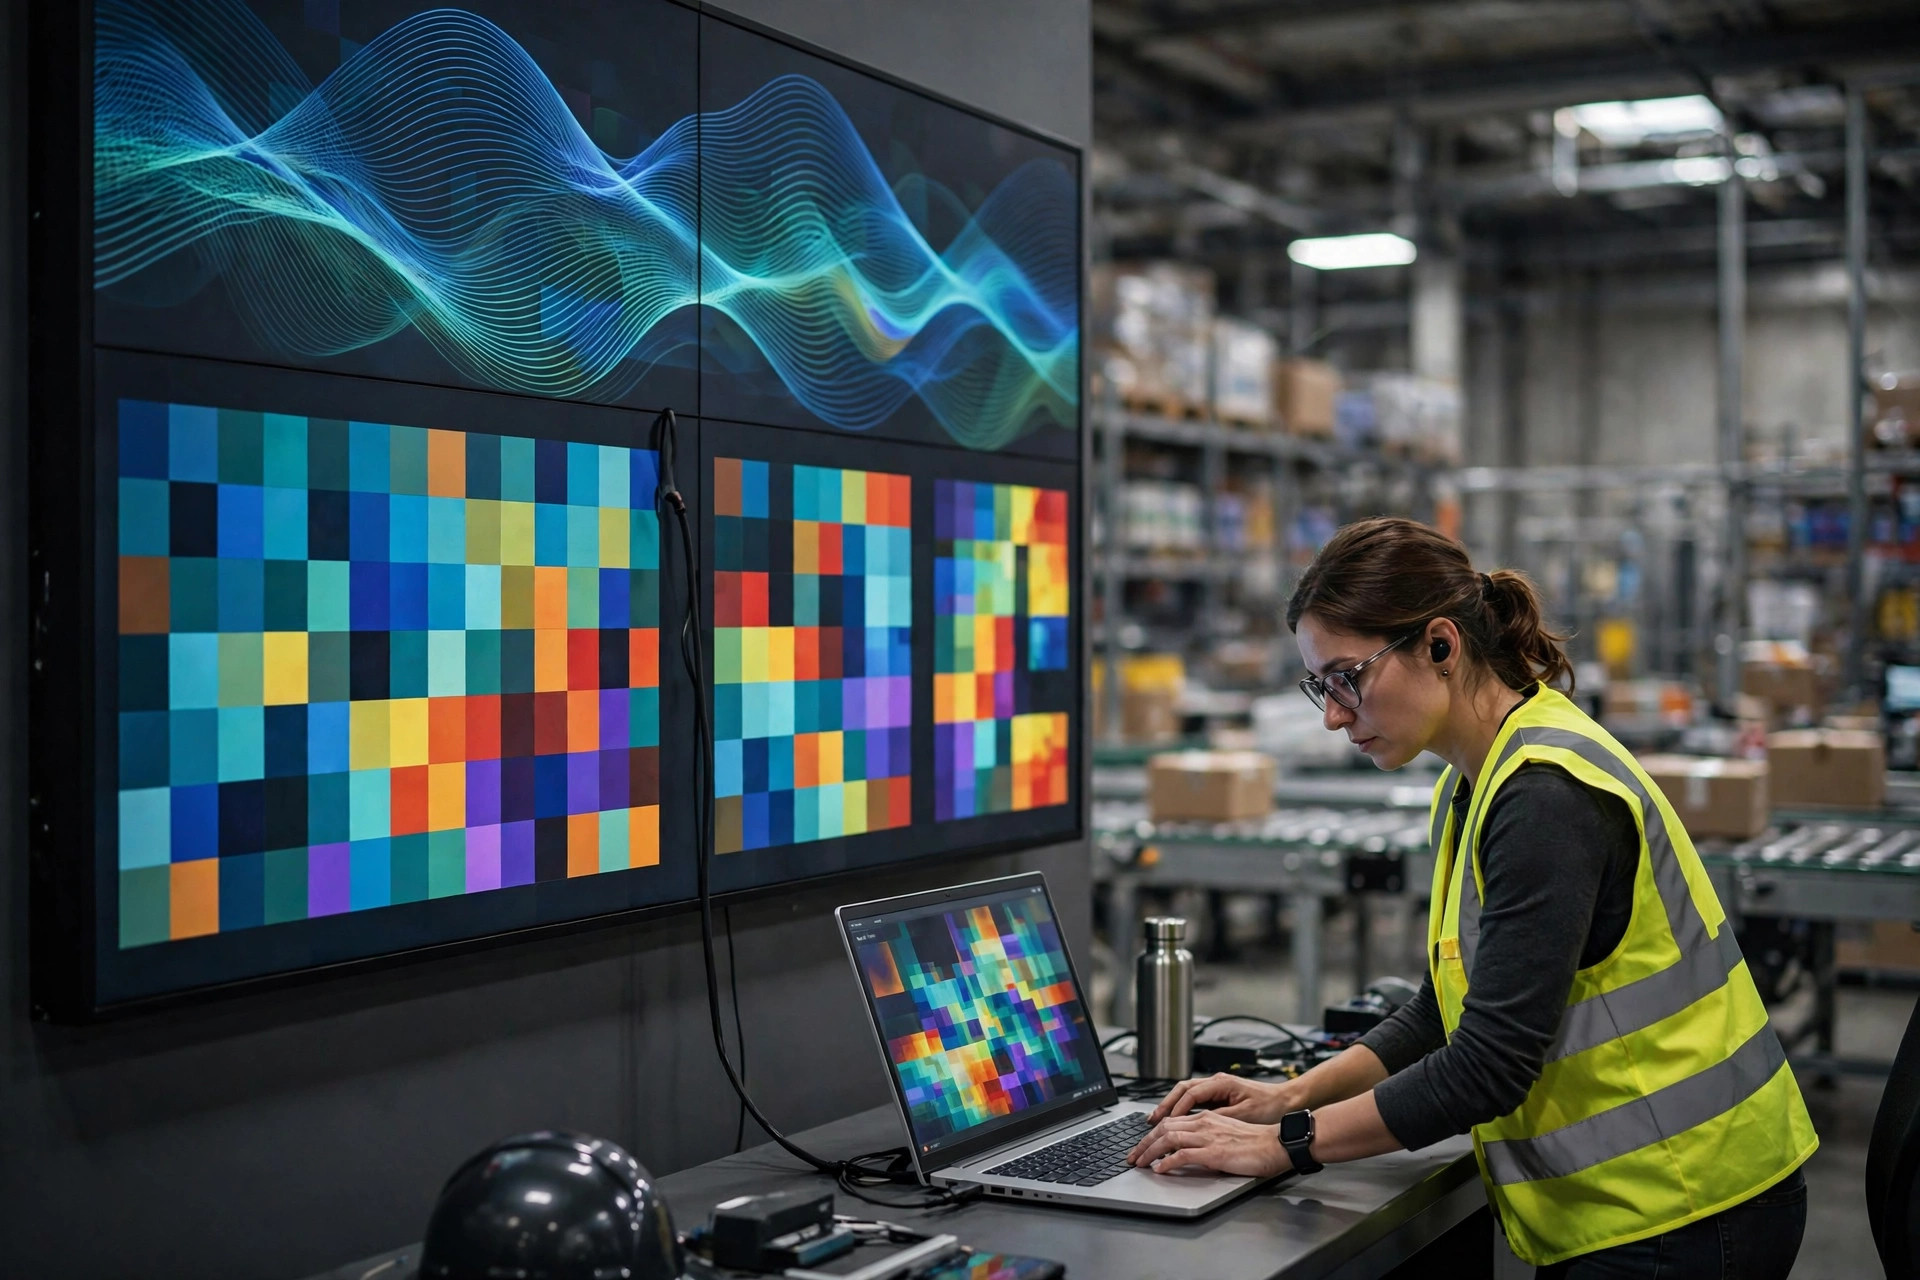
Then the site ran a small pilot. No new hardware — they plugged the existing Axis P3225-VE domes on the wall into an AI video analytics platform and aimed it at exactly two spots: the pack stations and the conveyor merge. Three weeks of baseline data. The verdict almost made me laugh out loud: pack-out wasn't the bottleneck at all. The real choke point was the scan station upstream of the merge. Two operators rotated through that post — one fast, one slow. Whenever the slow one took over, inbound flow went choppy, and the queue at pack-out piled up downstream. The jam wasn't caused by a slow downstream. It was starvation from upstream.
Since then I've had one line for anyone who asks: stop guessing where the bottleneck is. Let the cameras watch for three weeks.
Start small: one or two suspects, not the whole building
The fastest way to burn money on video analytics is to roll it out site-wide on day one. My advice never changes: pick the one or two spots you already suspect, and run a small pilot. Pack stations, conveyor merge points, sort inducts — anywhere material is visible and the motions repeat. That's where AI actually sees well.
The method is straightforward. Feed your existing camera streams into the analytics platform, run a two- to four-week baseline, and change nothing. Just watch. Watch three things: whether each station's cycle time is stable (the same motion taking 40 seconds today and 70 tomorrow means something is off); queue length (how many units are permanently stacked in front of a station); and abnormal dwell — a station going quiet for longer than a few minutes gets flagged once. That "few minutes" has no industry standard. Every building calibrates its own threshold from baseline data. A threshold picked out of thin air only buys you false alarms.
And that's where the traps are. Lighting first: at that Inland Empire site, a skylight faced the conveyor dead-on, and at midday the backlight made the image shimmer — the AI flagged dozens of "abnormal dwell" events a day, every one of them fake. They only got it under control by adding a lighting-calibration time window. Then occlusion: a forklift drives past the lens, the frame goes black for fifteen seconds, and the data stream has a hole in it. And then there's the angle problem — warehouse cameras are installed for theft prevention, tucked in corners, looking down at the tops of people's heads. If you want to see the process, the lens should face the conveyor and the material stacked in front of each station. You're watching how freight flows, not how people move. That sentence matters. I'll come back to it.
The math is easy. The people are hard.
Money first. The biggest selling point of this technology is that it needs no new hardware — the cameras are already on the wall. Pricing is per camera point, subscription-based. The quotes I've seen run a few hundred dollars per point per month — check with vendors for current pricing, since it moves. That site wired up four points; the annual subscription came in under twenty thousand dollars.
How did the payback work? Once the real bottleneck was identified, they didn't spend much fixing it at all — they just re-staggered the shifts at the upstream scan station so the slow-paced rotation stopped starving the line. Pack-out throughput rose about ten percent. Based on what I've measured in the field, this kind of "find the real bottleneck, then act" fix typically lifts efficiency somewhere in the 8 to 15 percent range. If someone promises you more than that, start questioning their data.
Rough math: twelve packers at twenty dollars an hour — roughly the Inland Empire market rate in 2025 — and a ten percent gain works out to a little over forty thousand dollars a year in labor saved. The subscription cost under twenty. Payback in well under a year. That's a rough estimate, obviously — every building's order mix and labor cost is different, so run the formula with your own numbers.
Now the people part — the most sensitive piece of the whole thing, and the easiest to get wrong. Before the pilot starts, hold an all-hands meeting and lock in a few commitments. Faces get blurred; the algorithm counts cartons, not people, and the lens is aimed at the process, not the person. Data is reported at the station level — no individual rankings, ever, and never tied to performance reviews. That one has to be in writing. In a union building, skipping this step means the union rep is at your door within days. I've watched a site roll this out without the conversation; two weeks in, a complaint landed, the pilot was shut down, and the money was gone.
The funny thing is, when the communication is done right, your veteran operators become the best annotators you have. The AI flags an abnormal dwell event; an old-timer glances at it and says, "That's a pallet swap, not slacking." That kind of floor judgment is something no algorithm learns in three years.
So don't ask me whether AI video analytics is worth buying. Ask yourself this instead: which part of your operation feels slow — and can you prove it with data? Start there. Two weeks of camera footage is enough to begin. Data won't make the decision for you, but it gives you something solid to stand on when the arguing starts.