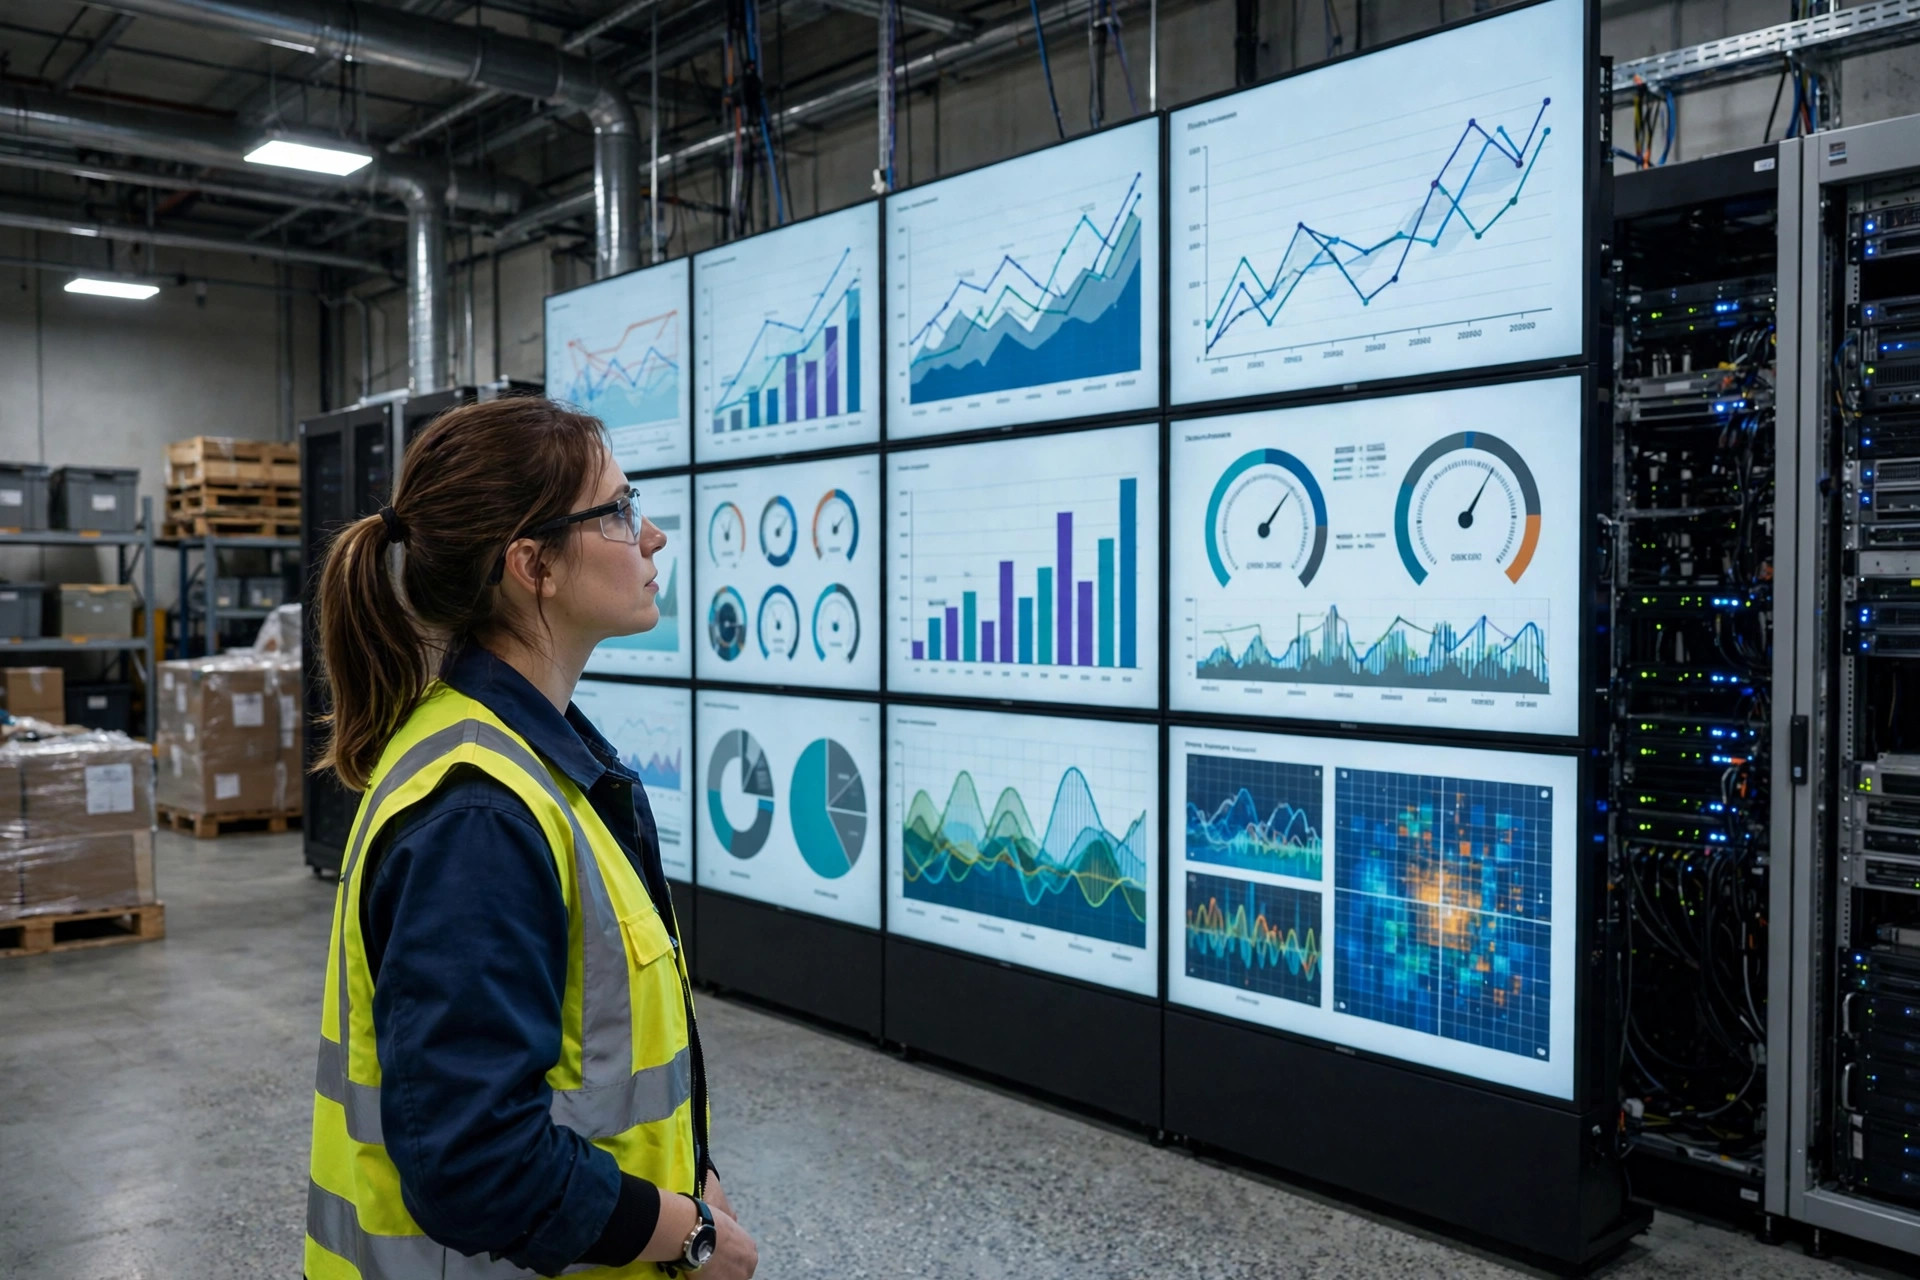
Here's the thing about integration failures: equipment breaks loudly. A motor burns out, a belt snaps, everyone sees it. Interfaces die quietly. Your sorters are running, the conveyor is humming, and meanwhile not a single order has reached the other system for six hours. By the time someone notices, the warehouse floor is buried. Good WMS integration monitoring and alerting comes down to one principle: when the interface dies, the system should know first — not a human.
Interfaces Die Three Ways, and Each One Needs Different Monitoring
Let me break down the mechanics. Think of a WMS integration like a conveyor belt between two warehouses, orders riding on it. You'd assume the belt is either running or stopped. It actually fails three ways.
Death one: timeout. The other system stops responding and connections hang. But here's the trap: some systems don't die, they just get slow. I worked a project at a 3PL in Fontana in 2023 where the ERP interface averaged 2-second responses, then one day stretched to 45 seconds. No timeout, no error, orders still flowing — just slower and slower. By 2 PM, over 1,800 outbound orders had piled up and the pick line ground to a halt. Lesson: monitoring "is it up" isn't enough. You have to monitor "is it fast."
Death two: dropped orders. You sent it, they never got it — or they got it and never acknowledged it, and both sides blame each other. The nastiest version is partial loss: 1,000 orders go out, 997 arrive, 3 vanish. Nothing triggers, because the interface itself is healthy. Last Black Friday, an e-commerce warehouse in the Inland Empire was losing about 0.5% of orders per hour through their order interface — three days before anyone noticed, and it was customer service that noticed, from shipping complaints. Nearly 400 orders. Refunds and expedited re-ships put it near a hundred grand.
Death three: dirty data. The interface is up, the orders arrived, but the content is wrong. A quantity field with a stray decimal point, a SKU mapped to the wrong location. This is the hardest to monitor because it lives at the business layer, not the technical layer. You have to validate after the data lands: quantities sane, required fields present, enum values in the dictionary.
Three deaths, three monitoring layers: connectivity (is it up) → performance (is it fast) → data quality (is it right). Plenty of companies only build layer one, leave the other two naked, and still tell themselves "we have monitoring." That's a fake requirement if I've seen one.
Four Metrics. That's It.
I've seen teams start with thirty metrics and end up watching none of them. Same instinct I have with equipment: pile on too many sensors and the operator doesn't know which one to look at. Four metrics cover it:
1. Success rate. Successful requests over total, per minute. I set the alert line at 99.5%, sustained for 5 minutes. Don't set it at 100% unless you enjoy being woken up — a network blip or a garbage-collection pause on the other side will cost you a point or two. Alert thresholds are like smoke detectors: crank the sensitivity too high and it screams every time you cook. Scream too often and someone pulls the battery.
2. Latency P99. P99, not the average. Averages lie beautifully. Ninety-nine requests at 1 second, one at 100 seconds — average reads 2 seconds, fine. But that 100-second request might be your biggest customer's order. P99 means 99% of requests were faster than this. Alert when P99 exceeds 10 seconds for 3 minutes straight.
3. Queue backlog. Watch your retry and dead-letter queue depth. Normal is zero or near it. A sudden jump to a few hundred means something upstream or downstream broke. The beauty here is lead time: the interface hasn't died yet, but the queue is already climbing.
4. Retry rate. Anything over 5% deserves suspicion. Retries are a safety mechanism, but a climbing retry rate means the other side is already sick. Worse is the retry storm: the other side slows down, your client retries aggressively with no backoff, and within five minutes the connection pool is saturated and both sides go down together. Retries need a hard cap plus exponential backoff. Non-negotiable.

Four metrics, each with a normal value and an alert line, on one sheet taped to the wall. Skip the fancy dashboards — they're for leadership tours. Alerts are for the on-call.
Alert Tiers: What Deserves a Phone Call vs. an Email
The biggest failure mode in alerting isn't silence — it's noise. I inherited a project with 200+ alert rules firing 300+ emails a day. Three months later, ops had auto-archived the alert inbox. Monitoring effectively zero.
My tiering is dead simple. Three tiers:
| Tier | Trigger | Notification | Response |
|---|---|---|---|
| P1 Critical | Success rate below 95% for 3 min, or a core interface fully down | Phone call + SMS to the on-call engineer | Acknowledge within 15 min; restore or degrade within 1 hour |
| P2 Major | Success rate 95–99.5%, P99 latency breach, or queue backlog over 500 | SMS / team chat ping to on-call | Acknowledge within 30 min; resolve within 4 hours |
| P3 Warning | Retry rate over 5%, or minor single-metric jitter | Email to the team | Handle during business hours |
Two rules matter most: P1 must be able to wake a person up — a phone call, not an email, not a chat message. And P3 must never interrupt anyone — the inbox is fine. Before any alert rule goes live, ask yourself: "when this fires, do I know what to do?" If not, don't configure it.
And every P1 needs escalation: no acknowledgment in 15 minutes, auto-call the backup. Another 15 silent minutes, call the tech lead. Dead phone batteries and meetings on silent are facts of life.
The War Room Playbook
The alert fired. Now what? Too many teams answer "pull everyone into a group chat." Then twenty people each post "looks fine on my end" and half an hour evaporates. That's not a war room.
My process is fixed, four steps:
Step one: claim it. Within 15 minutes of a P1, the on-call engineer posts "acknowledged, investigating." Silence triggers automatic escalation. Exactly one commander in a war room.
Step two: stop the bleeding before diagnosing. Interface down? Get the business moving first — backup channel, manual entry, pause upstream pushes — then hunt the root cause. The dumbest war room I saw spent two hours tracing a failure to an expired vendor certificate. Ten minutes would have switched operations to manual mode. Restore the business first, find the cause second. That order is sacred.
Dirty data gets its own playbook. Freeze first, don't rush to re-send — re-sending bad data multiplies the damage. Quarantine the affected orders, manually verify a sample, confirm your cleansing logic, then re-run in bulk. A warehouse I know got a bad SKU mapping in early 2024, re-sent three times, and each re-send scrambled inventory further. Two days of manual cycle counts to untangle it.
Step three: the postmortem. Within 48 hours, one page: how was it detected (monitoring or a human?), how long did mitigation take, what was the root cause, and what new monitor would catch it earlier next time. No blame. Blame them once and nobody reports failures again.
Do the Math: What Is Monitoring Actually Worth?
Old habit — let's run the numbers. Many treat monitoring as a cost center. Here's the other side of the ledger.
Say your warehouse ships 8,000 orders a day at $3 margin per order. The interface dies for 4 hours — roughly a sixth of the day — so about 1,300 orders don't move. That's around $4,000 in margin gone, before counting complaint refunds, expedited re-shipping, and a full ops team standing around. Two incidents like that a year and you're out the better part of ten grand.
A decent monitoring setup? Cloud monitoring services charge by metric volume — tens to maybe a couple hundred dollars a month for a mid-size integration. Alerts cost a few hundred a year; on-call is your existing team. Total annual spend: two, three thousand dollars tops.
The math is not close: spend two or three thousand to protect against ten thousand in losses — never mind the brand damage and customer trust. Whether it's well spent comes down to one number: what did your last outage actually cost you?
Get the monitoring in place, tier the alerts, tape the war room process to the wall. Next time the interface dies, the system knows first, the on-call engineer knows second — not you, at 6 AM, getting yelled at by a customer.
By Da Liu, Automation Engineer