Here is the bill that changed how I think about seasonal inventory planning warehouse decisions. A women's apparel seller in Xiaoshan, Hangzhou, came to me after last year's Double 11 festival to review the numbers. On the surface it looked like a win: more than 90,000 units sold in seven days, barely a stockout. Then I spread the full-year accounts on the table. To cover those seven days, the seller had tied up over 4.2 million yuan in inventory ordered three months early, and the 23,000 units left over after the peak sat in the warehouse for five more months before being cleared at 40% of list price. The money lost on the leftover stock was larger than the extra profit the festival brought in. That is the real question behind seasonal inventory planning warehouse work: not whether you stocked enough, but whether every unit you bought was worth the money it tied up. This article is only about inventory quantities and cash. Staffing and shift plans are a different subject, and this site already covers them elsewhere.
Seasonal Inventory Planning Warehouse: Split the Curve Into Four Tiers
The most common mistake in seasonal stocking is treating the season as one event: stock up before the peak. That single move is where the money leaks. A seasonal curve should be split into four tiers, each with different logic: off-season, regular season, pre-season ramp, and peak. The off-season job is not "stock less" but "stock only enough to avoid stockouts" and keep cash in hand. The regular season runs on normal turnover. The ramp climbs week by week. Only the peak justifies pushing safety stock to its highest level.
Here is the tier table I use with clients (multiples are relative to average monthly sales; illustrative figures to be fitted to your own sales history):
| Tier | Stock level (vs. avg monthly sales) | Safety stock days | Cash posture |
|---|---|---|---|
| Off-season | 0.6–0.8x | 7–10 days | As low as possible, cash is king |
| Regular season | 1.0x | 10–14 days | Normal turnover |
| Pre-season ramp (4–6 weeks out) | 1.3–1.8x, rising weekly | 14–21 days | Staggered deliveries, never all at once |
| Peak | 1.8–2.5x | 21–30 days | High cover only for proven best sellers |
The ramp row is the one that saves real money. Bringing the entire peak quantity in at once means financing costs start ticking from the day the goods arrive, while the goods do not turn into cash until six weeks later. I have seen sellers take delivery of their full Double 11 quantity in early September and start selling in late October: more than 50 days of financing cost, rent, and insurance burning on stock that did not move. Staggered delivery during the ramp usually saves more in financing and storage than the 2–3% discount a supplier offers for a single bulk order. When a supplier offers "take it all now and save 3%," ask one question first: does that 3% cover the extra 40 days of financing and rent? Most of the time it does not.
Safety Stock and Cash Occupancy: Two Sides of the Same Money
The safety stock formula is not complicated; getting the inputs right is. I use: safety stock = daily sales × replenishment lead time × volatility factor. The volatility factor comes from history: compare the best week of the same season over the past three years with the average week. A 30% gap means a factor of 1.3; a 50% gap means 1.5. Do not just pick 2.0 because it feels safe. Every extra 0.1 of factor is real cash sitting on a shelf.
Work it through with an example (illustrative figures, not industry averages). Take a home-goods item selling 10,000 units a month on average at 60 yuan a unit, rising to 22,000 units in the peak month, with a 20-day replenishment lead time. At a volatility factor of 1.4, peak safety stock = (22,000 ÷ 30) × 20 × 1.4 ≈ 20,500 units, tying up about 1.23 million yuan. At a factor of 2.0, safety stock jumps to about 29,300 units, tying up about 1.76 million yuan. The extra 530,000 yuan buys peace of mind against a "what if." Whether that peace of mind is worth it depends on the cost of a stockout. If the item is a traffic driver whose stockout drags down the whole store's ranking, it is worth it. If it is a long-tail item whose stockout costs a handful of orders, that money is wasted. There is no universal right answer for safety stock, only a decision about which items deserve how much cash. My rule: give best sellers and traffic drivers full cover, cut the factor in half for long-tail items, and accept long-tail stockouts rather than starve best sellers.
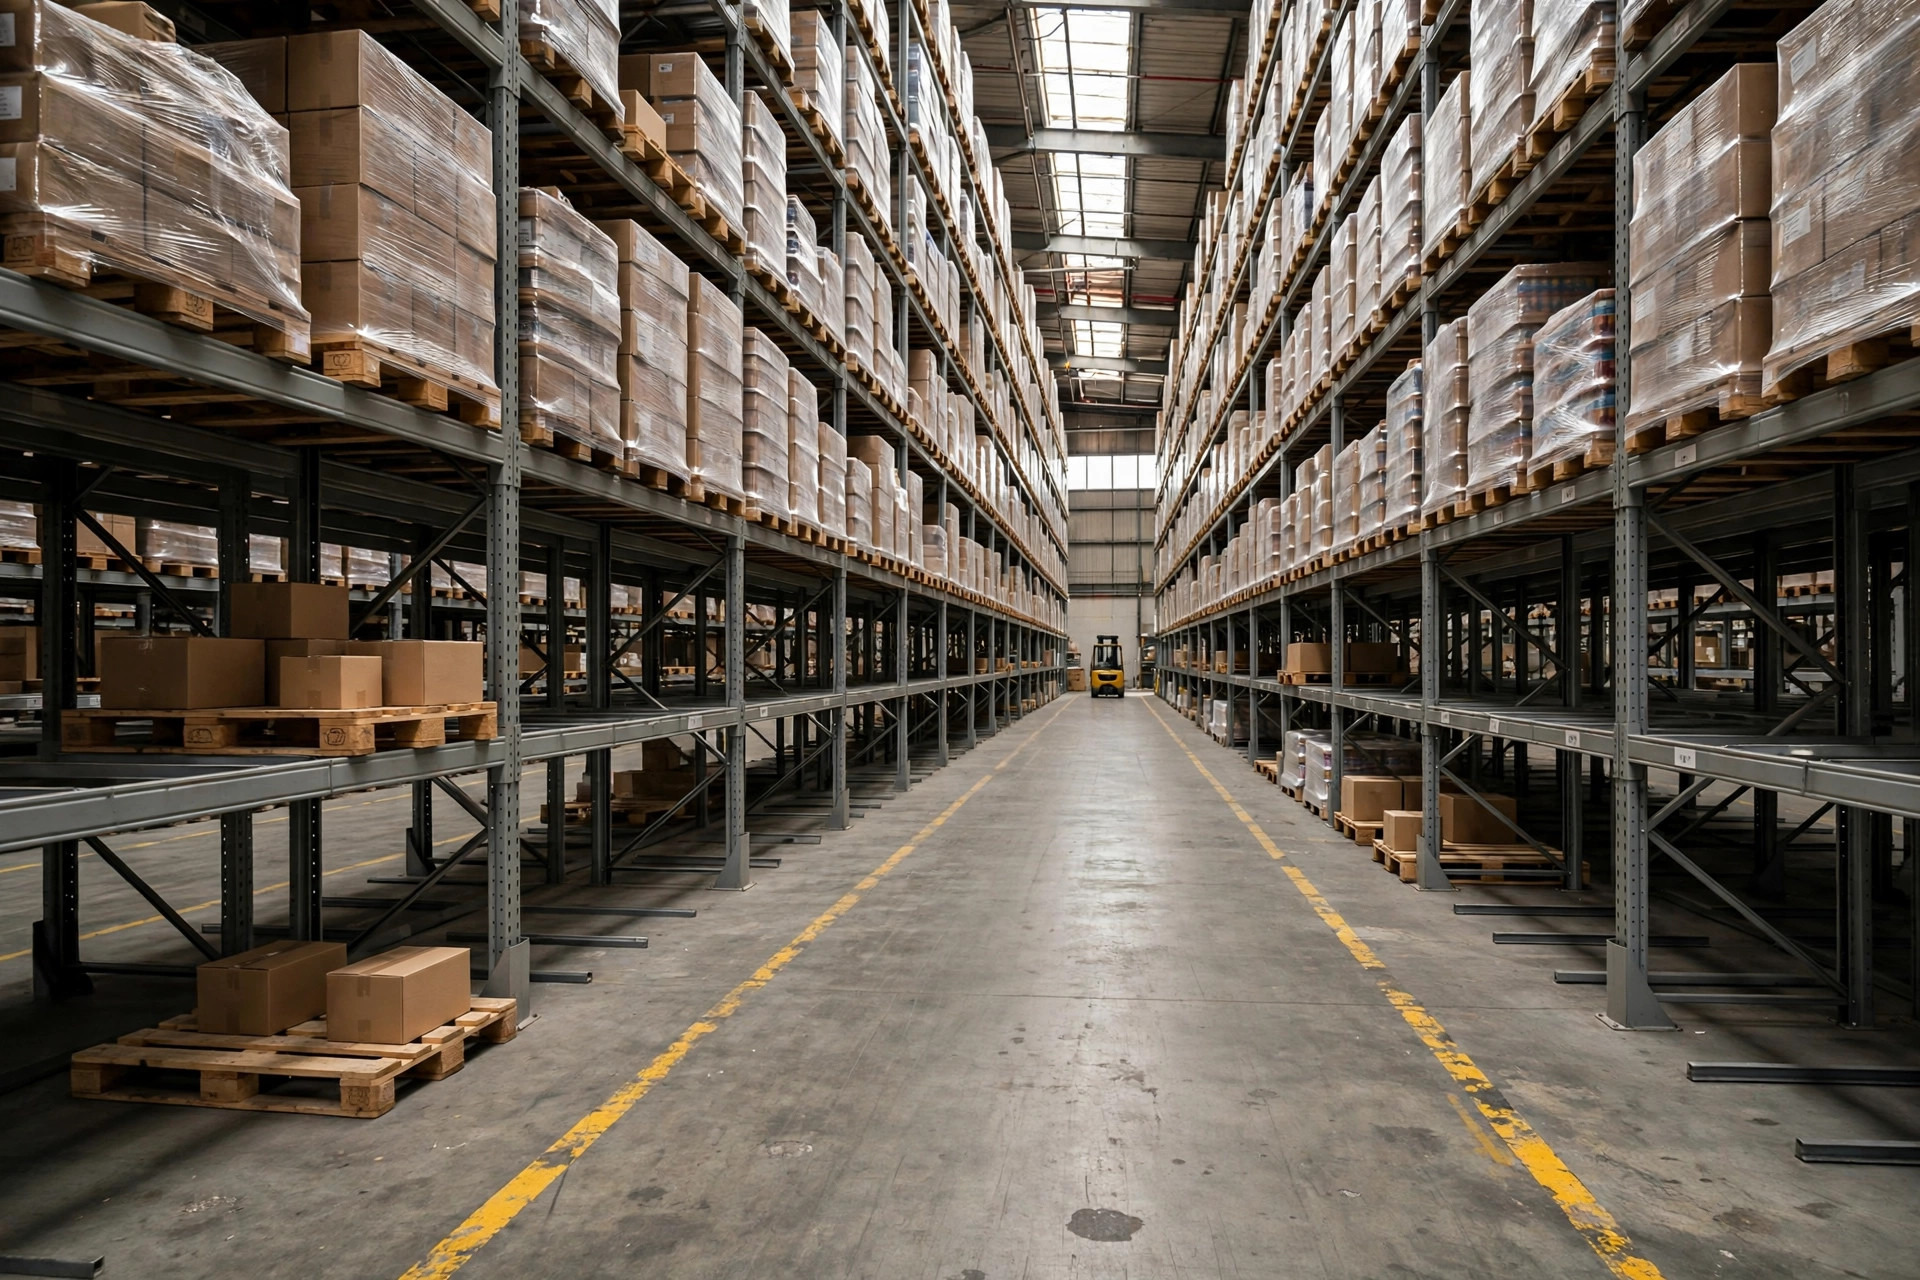
One cost people forget: rent is charged per pallet and per square meter, not per unit. When peak stock overflows your own warehouse, the overflow goes to temporary space at a higher rate per pallet. Stock up to the point where your own warehouse is just full, and no further. Anything beyond that should arrive in staggered deliveries or ship from a third-party fulfillment node. Goods forced into expensive overflow space lose money on every unit.
Post-Season Clearance: The Most Expensive Move Is Waiting
Here is the counterintuitive judgment. The most expensive way to handle post-season leftovers is not to discount them. It is to leave them sitting there and "see if they sell next year." I worked through the books of a home-goods warehouse in Guangzhou: after the 2024 summer season, 18,000 units were left over at 45 yuan a unit, about 810,000 yuan of stock. The owner decided to hold them for the following summer. Over the next eight months, rent allocated to that stock came to more than 60,000 yuan, financing cost at an annualized 8% came to about 43,000 yuan, and by the next summer the styles were dated and the packaging had yellowed. The stock finally cleared at 50% of list price, a further loss of roughly 400,000 yuan. Doing nothing for eight months cost more than 500,000 yuan in total.
Leftover stock therefore needs a disposal timetable written into the plan before the season ends, not decided in a meeting after it. My timetable: within two weeks after the season, sell through whatever can still move at full price; in weeks three to four, clear anything that moves at up to 20% off; in weeks five to eight, push the rest to discount channels or clearance platforms; anything still sitting after eight weeks goes at cost or even at a loss. The logic is simple: every month a leftover unit sits, holding costs eat roughly 1–2% of its value in rent and financing (illustrative range), while its chance of selling at full price next year falls every month. Clearing early is not taking a loss. It is stopping the bleeding.
There is one more trade-off that people usually get backwards. Pre-season overstocking and post-season clearance are two ends of the same money. Every extra 10% stocked before the season pushes the probability of leftovers up a notch. My floor rule for clients: pre-season stock = 90–110% of forecast sales, never a top-of-range figure like "best week last year × 1.2." A forecast miss can be fixed with a mid-season replenishment order at a controllable cost. A stocking mistake can only be fixed by a clearance sale.
The Verdict: Three Tables for Seasonal Inventory Planning
Seasonal inventory planning warehouse discipline comes down to three tables. First, the tiered stocking table: four tiers set from your own sales history, with staggered deliveries during the ramp. Second, the safety stock and cash occupancy table: full cover for best sellers, half cover for long-tail items, and every 0.1 of factor priced in cash. Third, the post-season disposal timetable: two weeks, four weeks, eight weeks, three deadlines, no extensions. Build those three tables and the questions of how much to stock before the peak and how much to hold in the off-season stop being gut feelings and become a bill you can check. Stock you cannot justify on paper is a gamble, whatever the season.
By Lao Zhou, Logistics Cost Analyst