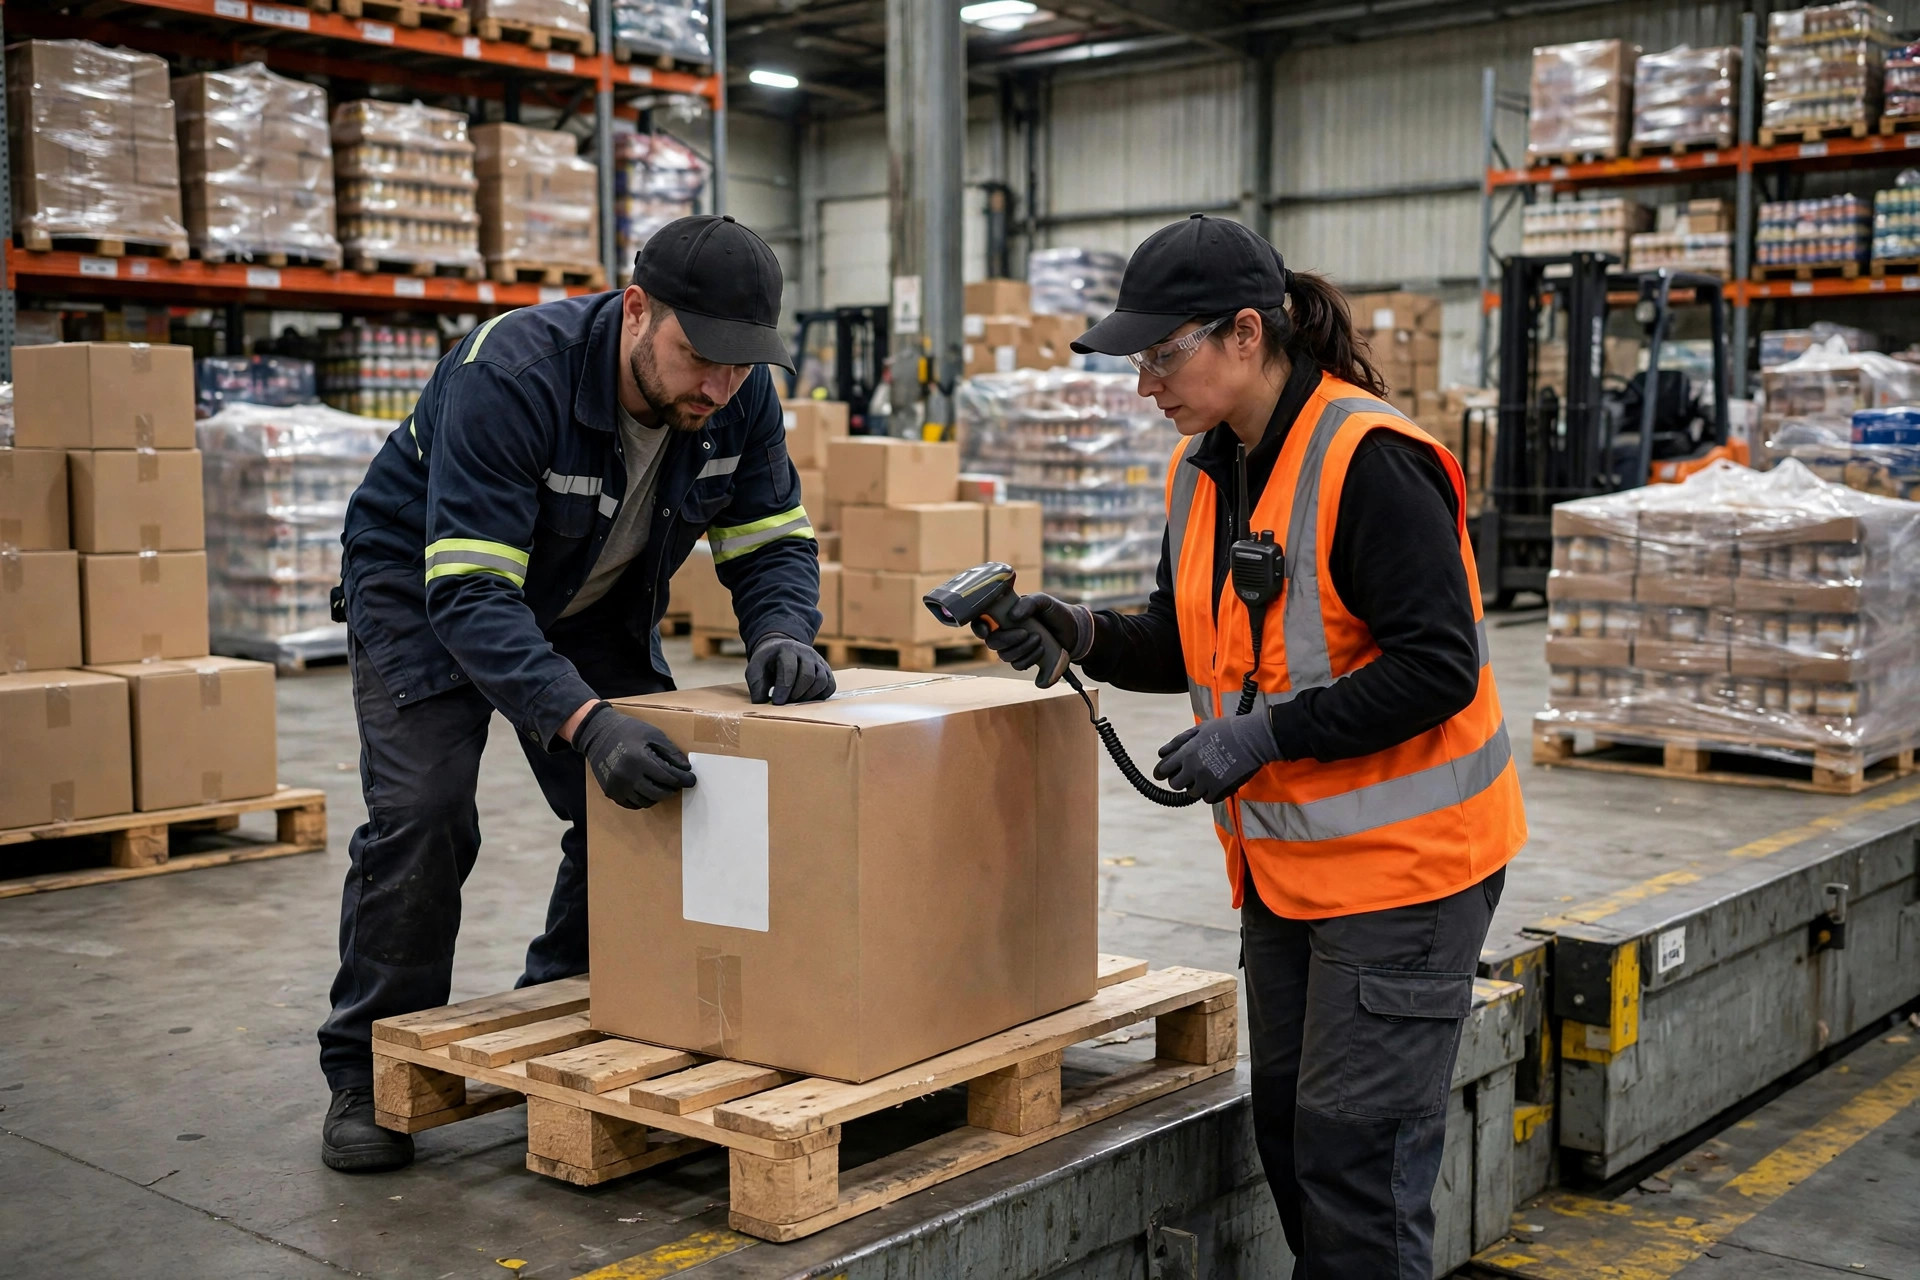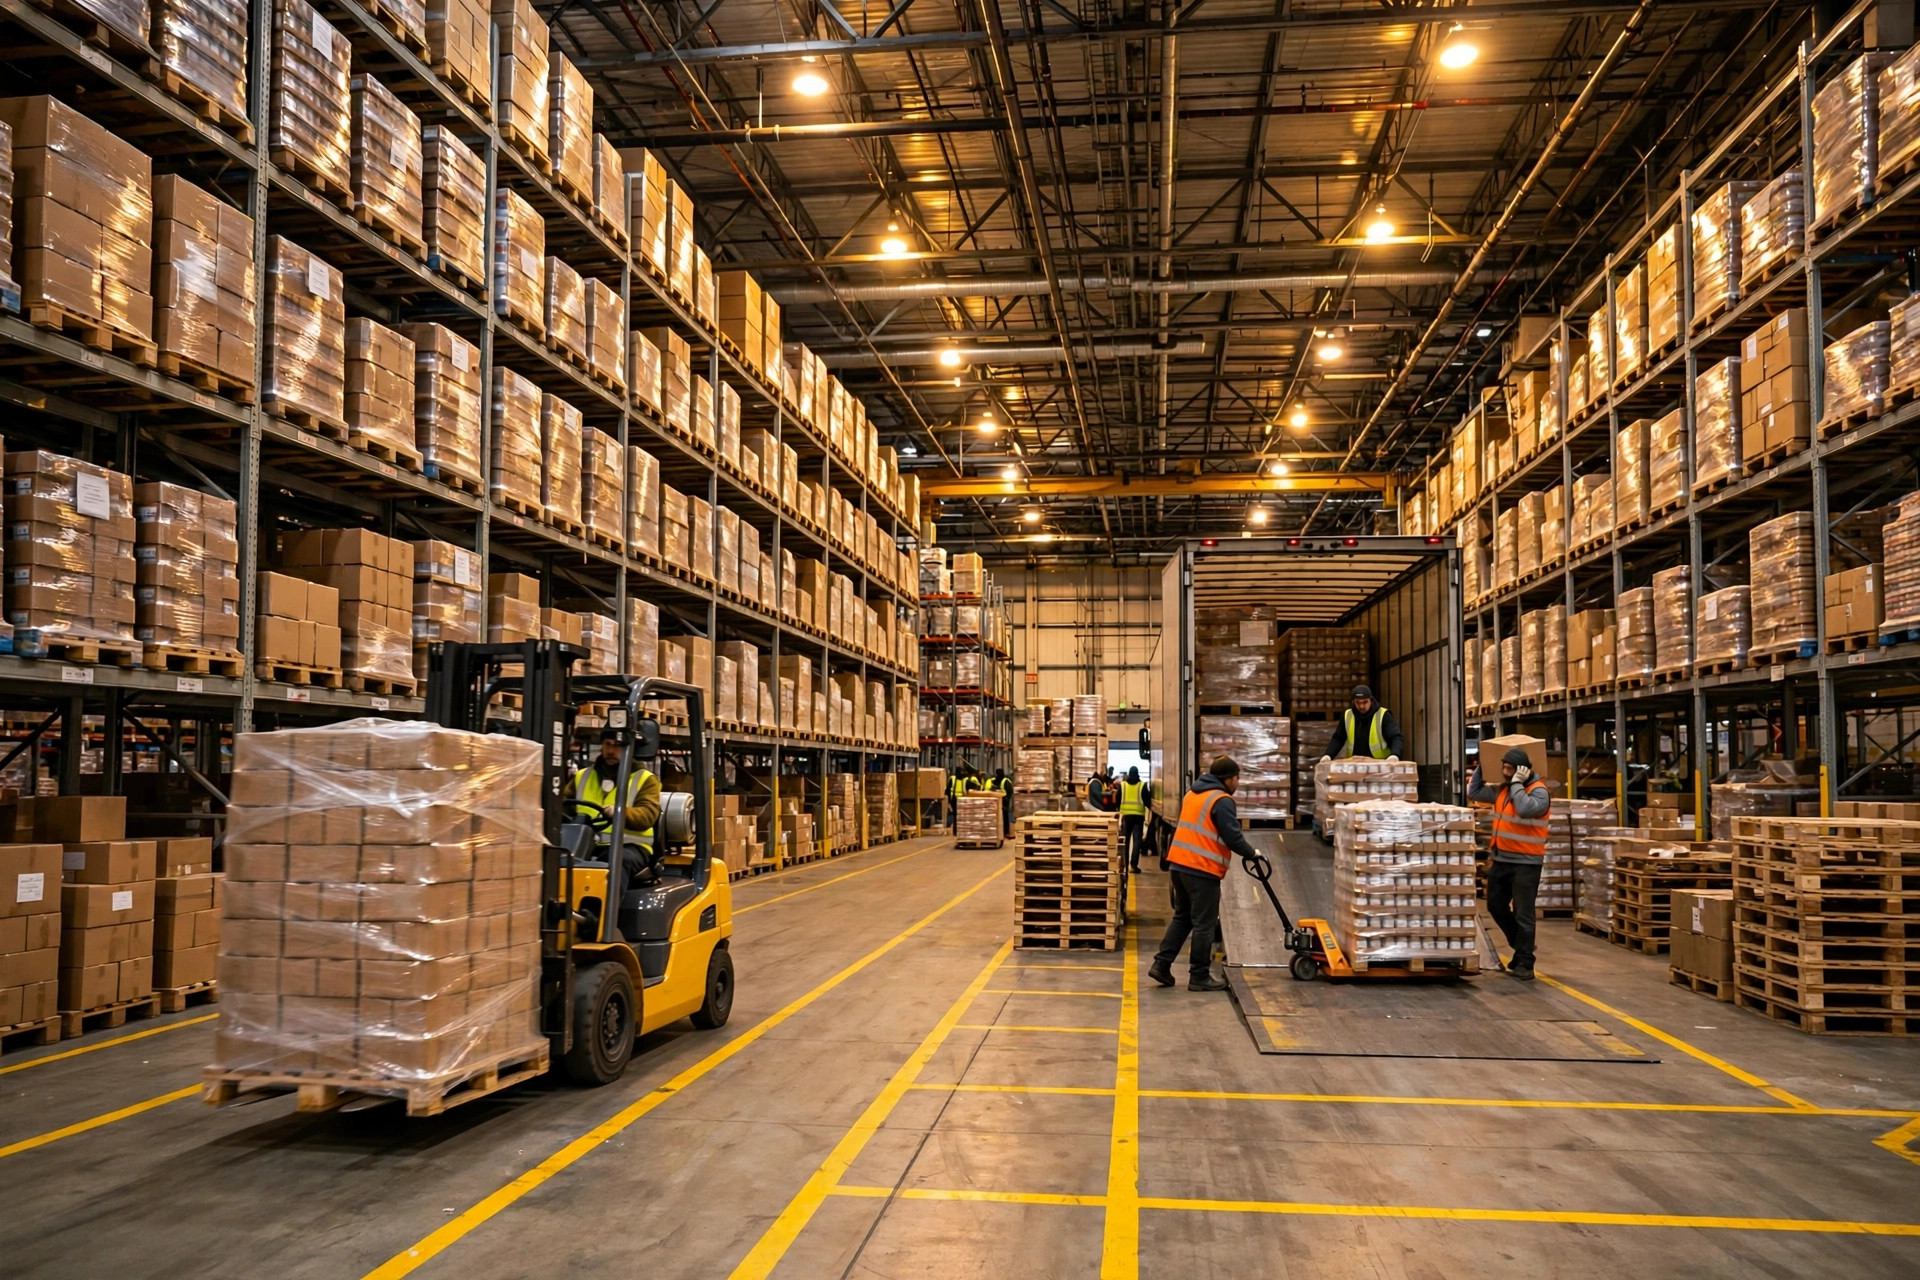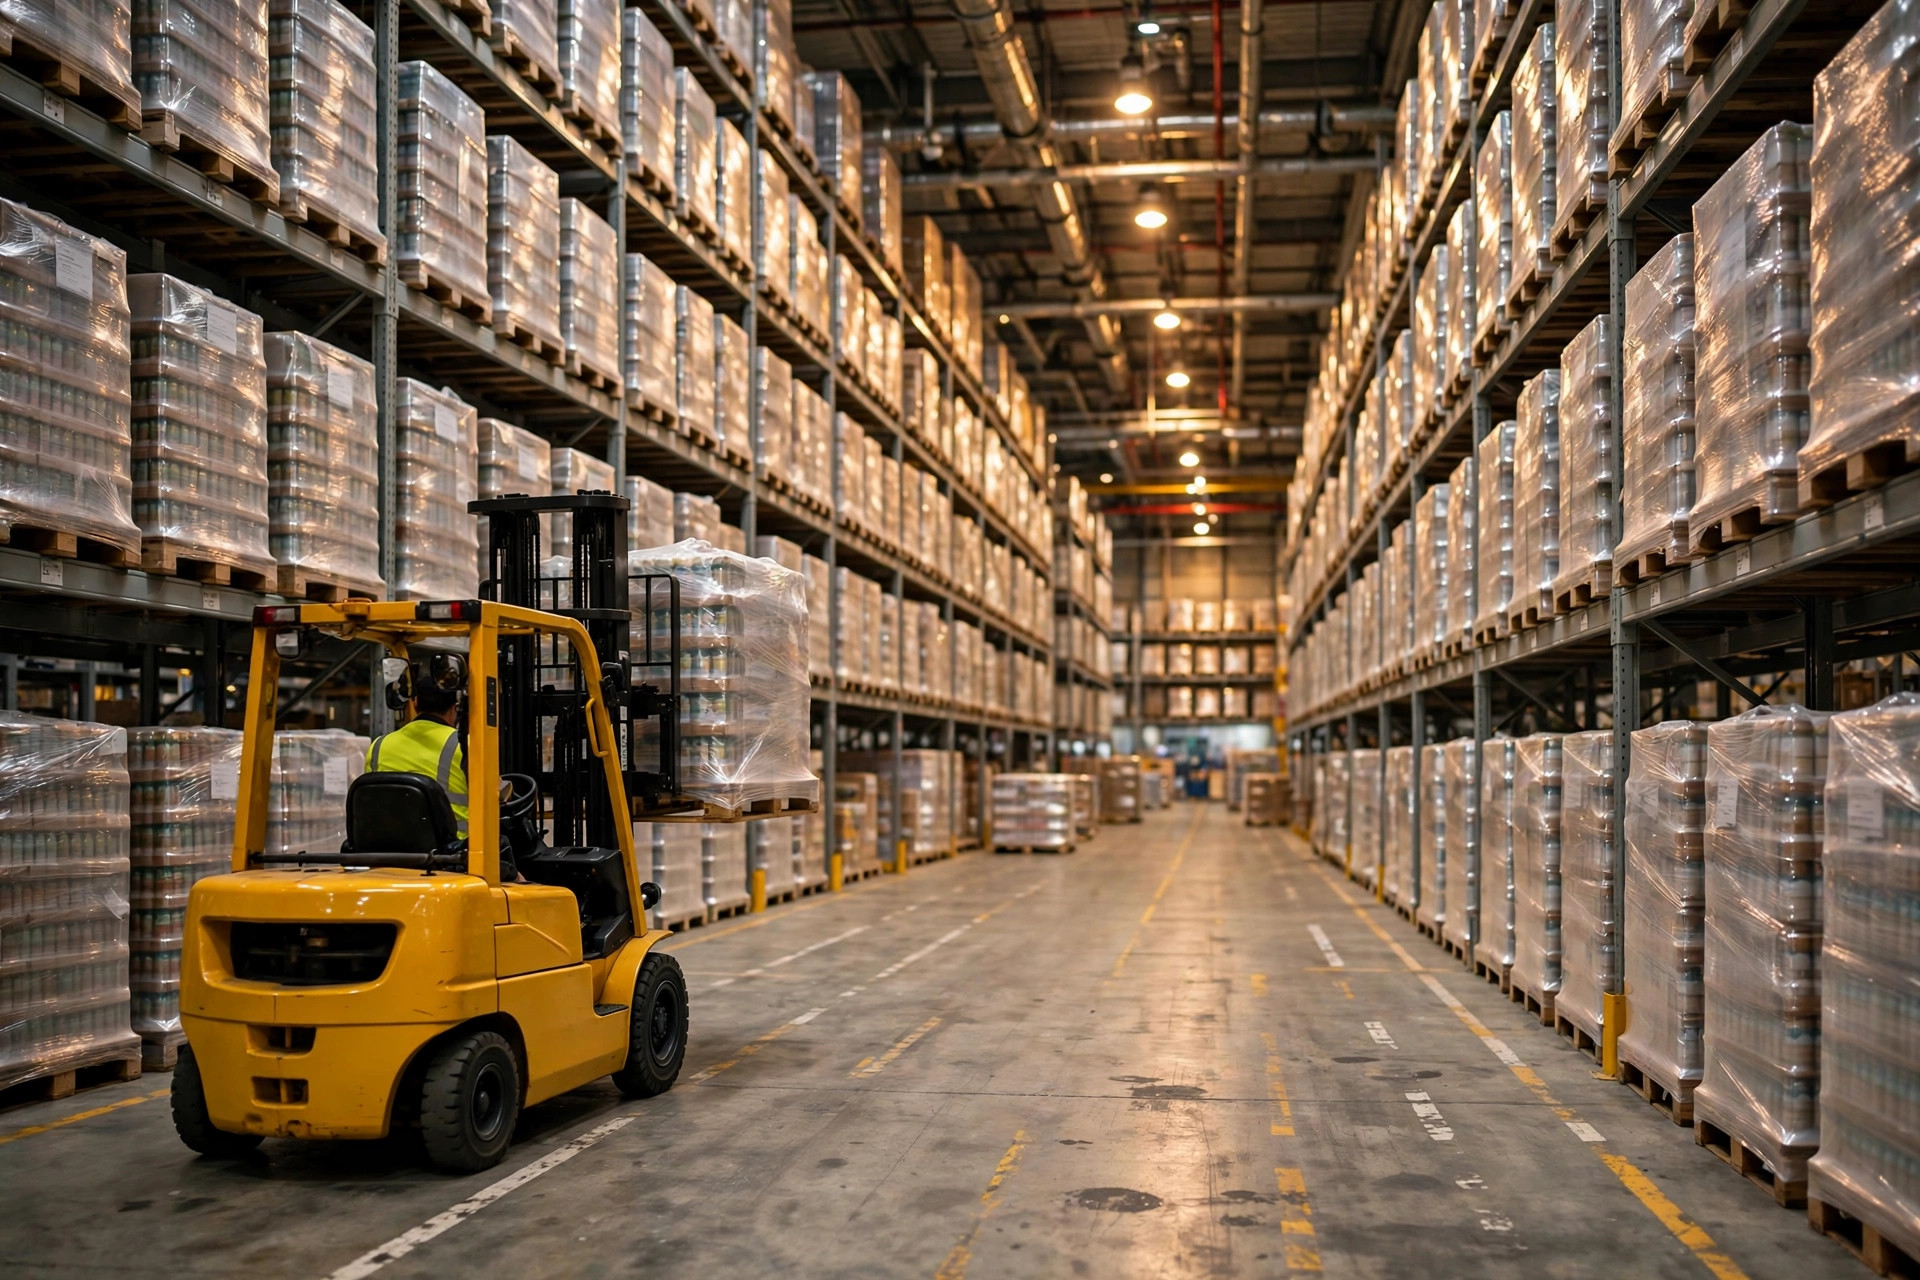
November 2024, a 3PL warehouse in Ontario, California. The client sold small home appliances. One hot SKU moved 200 units a day on average, with a 12-day replenishment lead time. Peak season pushed daily demand to 320 units. The result: six days of stockout. Emergency air freight cost $18,000 (illustrative figures), plus SLA penalties from the client — close to $30,000 gone.
Now, what would it have cost to carry safety stock on that SKU at a 95% service level for a full year? I'll show the math below: $1,715.
One stockout wiped out the equivalent of 17 years of safety-stock carrying cost. That money was wasted. Safety stock is not about "keeping extra for peace of mind." It is a line item you can compute to the decimal point. Today we compute it properly.
First, the Formula: One Line, Three Inputs
The standard safety stock formula is exactly one line:
SS = Z × σd × √L
Three inputs, and every one of them must come from data — no gut feel allowed:
- σd: standard deviation of daily demand. It measures demand volatility, and your outbound shipment records already have it. One Excel function.
- L: replenishment lead time in days, from purchase order to goods available on the shelf.
- Z: the service factor, a quantile of the standard normal distribution. Look it up:
| Target service level | 90% | 95% | 97.5% | 99% | 99.9% |
|---|---|---|---|---|---|
| Z value | 1.28 | 1.65 | 1.96 | 2.33 | 3.09 |
Look at the last column: at 99.9%, Z is 3.09 — nearly 1.87 times the 1.65 at 95%. Every additional "9" in service level makes safety stock disproportionately more expensive. Print this table and tape it to the wall.
A complete worked example. Take one SKU: average daily demand of 200 units, daily demand standard deviation of 60 units, lead time of 12 days, target service level of 95%:
SS = 1.65 × 60 × √12 = 1.65 × 60 × 3.464 ≈ 343 units
Reorder point: ROP = 200 × 12 + 343 = 2,743 units. Hit 2,743 and you place the order.
What does carrying those 343 units cost per year? Assume a unit cost of $20 and an annual inventory carrying rate of 25% (capital, warehouse space, insurance, shrinkage combined — the industry rule of thumb sits at 20–30%):
Annual carrying cost = 343 × 20 × 25% = $1,715/year
The opening ledger now closes: $1,715 buys a year without stockouts; six days of stockout cost nearly $30,000. You do the math.
One data-hygiene note on σd: compute it from actual outbound shipments, not sales orders — promotions create orders you can't fulfill, which inflates apparent volatility. Strip out returns too, or a returns wave skews σd upward and bloats safety stock.
The advanced version, for when lead time itself is unstable: SS = Z × √(L × σd² + d̄² × σL²), where σL is the standard deviation of lead time. If your supplier's delivery dates wander, use this one.
And the most common wrong method I've seen: setting the reorder point to average demand × lead time with zero safety stock, or adding an arbitrary 10% "buffer." That assumes demand never fluctuates and suppliers never slip. With the numbers above, the real requirement is 343 units; set it to zero and your effective service level is 50%. The $1,715 you "saved" gets wiped out by a single stockout, with interest.
Where the Money Goes, and Where It Can Be Saved
Safety stock is, at its core, a trade: certain carrying cost against uncertain stockout loss. Both sides can be quantified:
| Carrying cost (certain) | Stockout loss (risk exposure) | |
|---|---|---|
| Components | Capital tied up + warehouse space + insurance + obsolescence | Lost margin + expedited freight + contract penalties + customer churn |
| Behavior | Linear — each extra unit costs the same | Nonlinear — one stockout can erase a year's profit |
| How to compute | SS × unit cost × carrying rate | Historical stockout count × average loss per event |
The key judgment: the optimal service level is where the marginal carrying cost of one more unit equals the marginal stockout loss of one fewer — not "as high as possible." The marginal math on our example SKU:
| Service level | Z | Safety stock | Annual carrying cost | Stockout probability |
|---|---|---|---|---|
| 95% | 1.65 | 343 units | $1,715 | 5% |
| 99% | 2.33 | 484 units | $2,420 | 1% |
| Delta | — | +141 units | +$705/year | −4 points |
Moving from 95% to 99% costs an extra $705 a year and buys a drop in stockout probability from 5% to 1%. Worth it? Check the SKU's history: if its average annual stockout loss exceeds $705 (one air-freight rescue was $18,000), upgrade. If a stockout on it costs a few hundred dollars of margin a year, stay at 95%. Run the marginal math for every service tier separately — never accept a blanket "company policy is 98%."
Early 2025, I saw the expensive version of this mistake: an e-commerce warehouse in the Midwest set a uniform 98% service level across 23,000 SKUs. Long-tail SKUs piled up as dead stock and cash flow choked (order-of-magnitude illustration). The fix was ABC segmentation: A-items (top 20% by revenue) stayed at 98%, B-items dropped to 95%, C-items to 90%. That freed up a six-figure sum in working capital, and the stockout rate barely moved — stockouts were concentrated in A-items all along, and a couple of extra C-item stockouts cost a few hundred dollars of margin a year. A single high service level for every SKU is the most expensive mistake a small-to-mid warehouse can make.

The Small-Warehouse Shortcut: An Excel Recipe
Don't let the formula intimidate you. A small warehouse doesn't need new software — Excel is enough. Three rules:
First, use weekly data, not daily. Daily outbound quantities are too noisy; the σd you compute will be inflated and your safety stock with it. Use the last 12 weeks of weekly outbound quantities:
- Column A: weekly outbound units for the past 12 weeks
- Weekly demand std dev: σw = STDEV.P(A1:A12)
- Lead time in weeks: L_weeks = lead time in days ÷ 7
- SS = Z × σw × √L_weeks
- ROP = average weekly outbound × L_weeks + SS
Second, the biggest savings lever is not forecasting — it's lead time. SS scales with √L: cut L from 12 days to 3, and safety stock falls from 343 units to 172, saving $855 a year in carrying cost — across every SKU at once. Negotiate split deliveries, switch to a closer supplier, pre-position inventory near your market before peak season. A great forecast might cut σ by 10%; halving L can be done at a negotiating table. In the safety stock formula, L is always the cheapest variable to move.
Third, re-run the parameters quarterly. σ shifts with seasons, L shifts when suppliers change. The quarterly checklist: recompute σw from the last 12 weeks; confirm actual average inbound lead time with purchasing; put last quarter's real stockout count next to the safety stock carrying cost and check whether your service level still holds up.
One more trade-off in the other direction: oversized safety stock becomes obsolescence. Seasonal SKUs (summer fans, holiday gift sets) stocked to peak-season σ turn into dead inventory after the season — cleared at half price or scrapped. The worst case I saw: a warehouse carried 900 units of safety stock on a seasonal appliance at 98%, got stuck with 600 after the season, and the clearance loss was triple what the "stockout protection" had ever saved. For seasonal SKUs, run the formula six weeks before peak, then cut to 90% — or halve it — the moment peak passes. The formula is fixed; the calendar isn't.
The Takeaway: A Conclusion You Can Compute
Walk every SKU through this routine — five minutes each:
- Set the service level: A-items 98% (Z = 2.33), B-items 95% (Z = 1.65), C-items 90% (Z = 1.28);
- Apply SS = Z × σw × √L_weeks to get the unit count;
- Compute annual carrying cost = SS × unit cost × 25%;
- Compare against that SKU's actual stockout losses over the past year.
If annual carrying cost is less than a third of historical average annual stockout loss — your safety stock is too low. Add units; the money is well spent. If carrying cost already exceeds stockout loss — cut it. You're paying a tax for peace of mind.
By Lao Zhou, Logistics Cost Analyst