Back in March, a seller friend who sells Bluetooth speakers messaged me: "Lao Mi, help. Returns on our best-selling speaker went from 5% to 18%. The more we spend on ads, the more we lose. This SKU is dying."
My reply: don't touch the ads, and don't cut the price yet. When return rates spike, it's almost never a traffic problem — it's the product or the fulfillment. I gave him an investigation chain to work through in order. A month later, returns were back around 6%. I've walked three or four sellers through this chain over the past couple of years, and today I'm sharing it. One note before we start: every number below comes from this one case, not from some universal industry benchmark.
Pull the reason codes before you guess anything
Step one is always data, never gut feeling. Have the last 30 days of return records exported and bucketed by reason code.
How to check: if you use platform fulfillment, pull the returns report from the seller dashboard and export the reason column. If you self-fulfill, ask your warehouse for the returns log — the two columns that matter are the customer's note in their own words and the warehouse's inspection result. What data to look at: the top five reason codes by share, the week-over-week return-rate trend, and which variant (color, size) the returns cluster on. Who owns it: operations pulls the data, customer service turns buyer comments into a word cloud — real buyer language is more honest than reason codes.
His numbers told the whole story: "not as described" was 41%, "defective / doesn't work" was 27%, "damaged in transit" was 14%. Three lines of data, and the investigation order wrote itself: listing first, then packaging, then batch quality. I've watched too many sellers skip this step and re-box their entire inventory, only to see the return rate sit exactly where it was.
Nine times out of ten, it's the listing
With "not as described" at 40%, audit the listing. My method: open your own listing on your phone, pretend you've never seen the product, and read it line by line against the physical item.
Copy exaggeration: his speaker promised "360-degree surround stereo." The actual unit has a single forward-facing driver. That's the copywriting team digging a hole for the product. Missing specs: battery life, waterproof rating, charging port type, whether a charger is in the box — the specs buyers actually care about. Every missing one buys you a batch of "not what I expected" returns. Photos: color shift is the big one. His hero image was shot under studio lighting in "space gray"; what buyers received read as bluish-gray under home lighting. And misleading scale cues: the lifestyle shot showed the speaker next to a coffee cup, making it look compact. The real thing was a full size bigger than buyers imagined. Size charts and compatibility: apparel lives or dies by its size chart; electronics by the compatibility list. His detail page never said "can't pair two units simultaneously" — and a wave of buyers had purchased exactly for that feature.
How to check: grab three or four people who've never seen the product — CS reps, warehouse clerks, anyone — have them describe what they'll receive from the listing alone, then put the physical product on the table. The gaps show up instantly. Who owns it: operations rewrites the copy, design reshoots the hero image. And reshooting doesn't mean prettier — it means "uglier, but honest." He reshot the main image in natural light, and "wrong color" complaints fell by roughly 70% within two weeks.
If the listing is clean, interrogate the warehouse
With the copy cleared, the "damaged in transit" and "defective" buckets point at the warehouse.
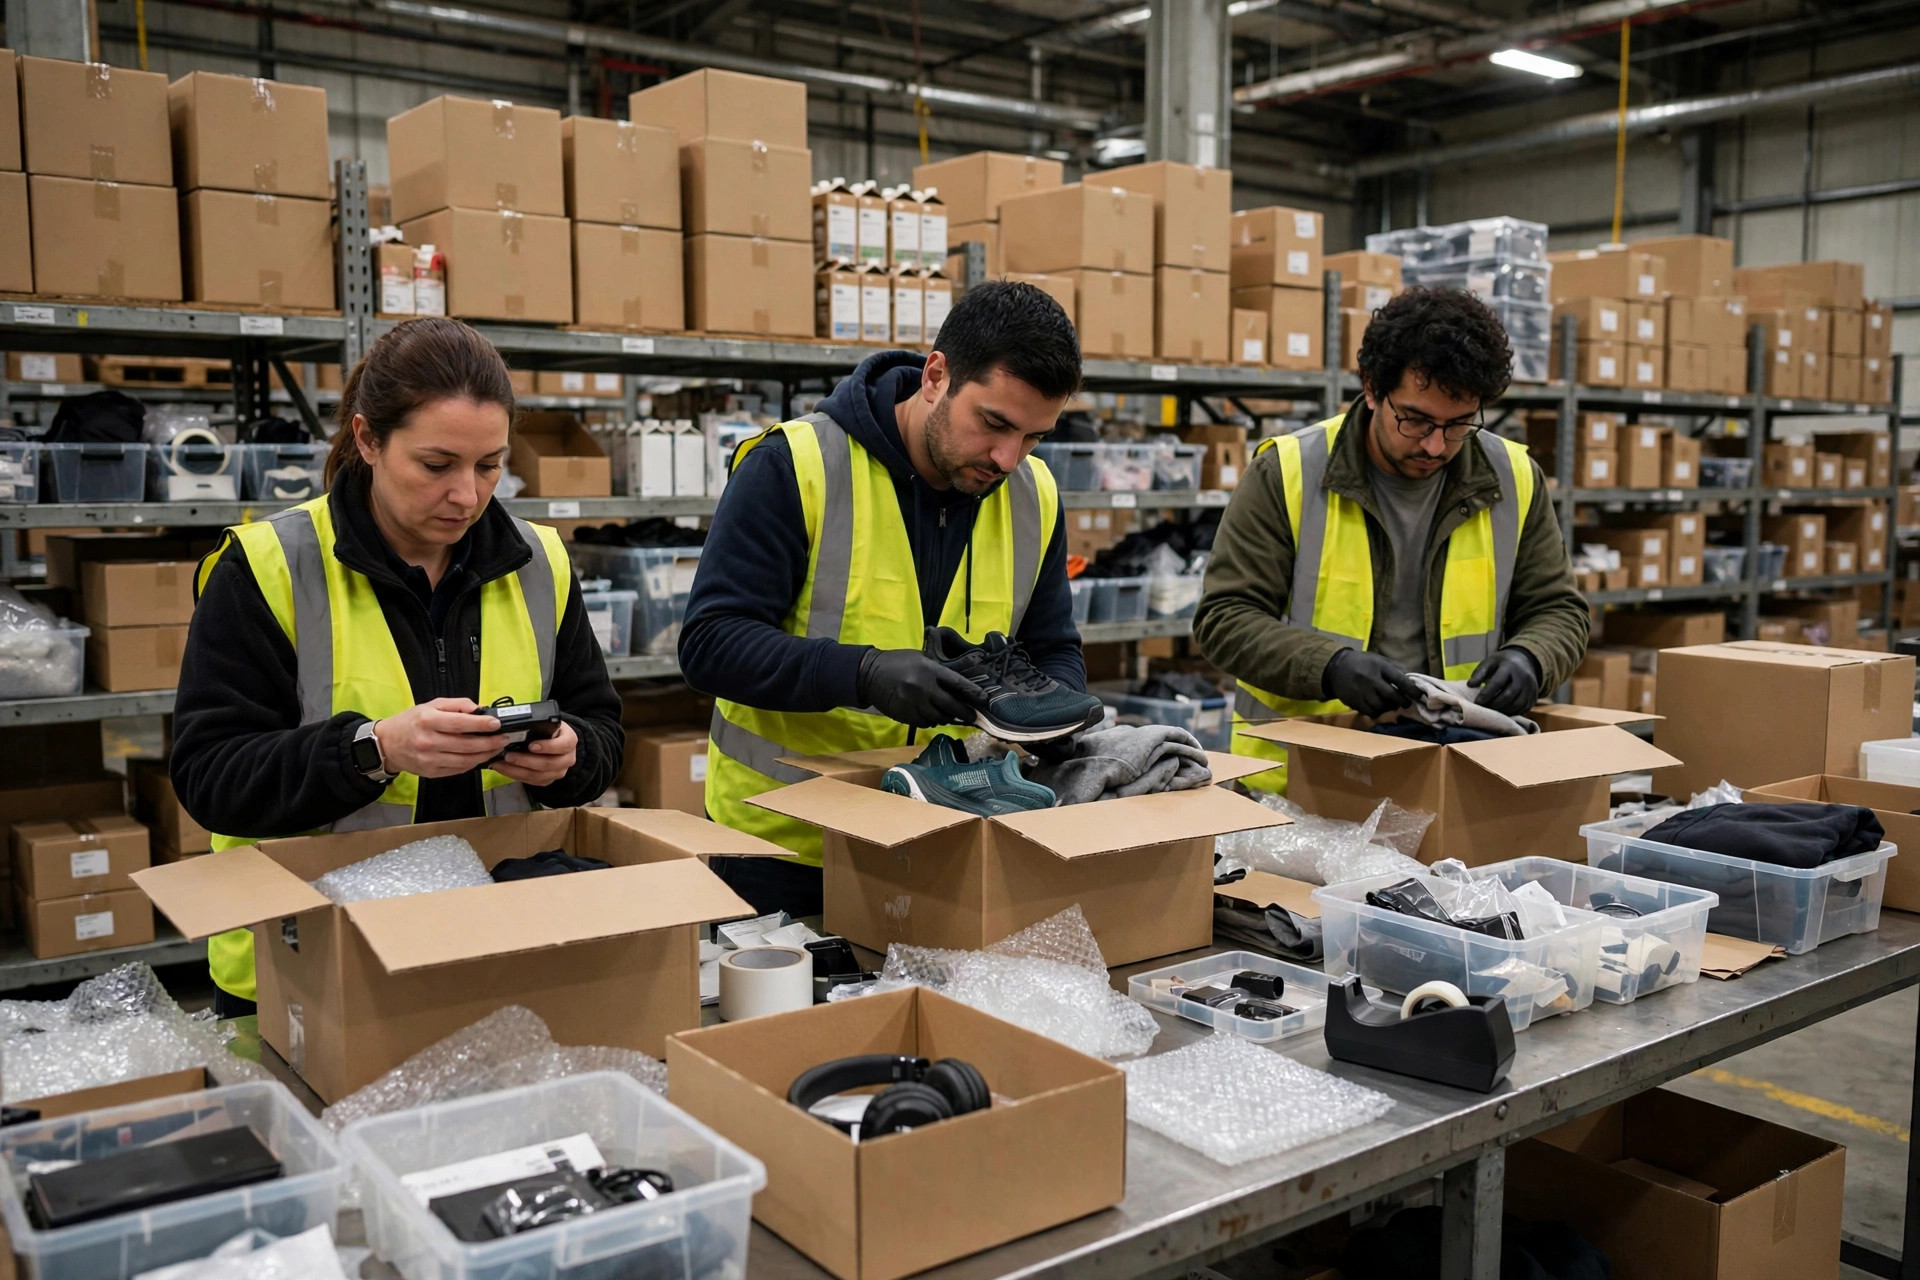
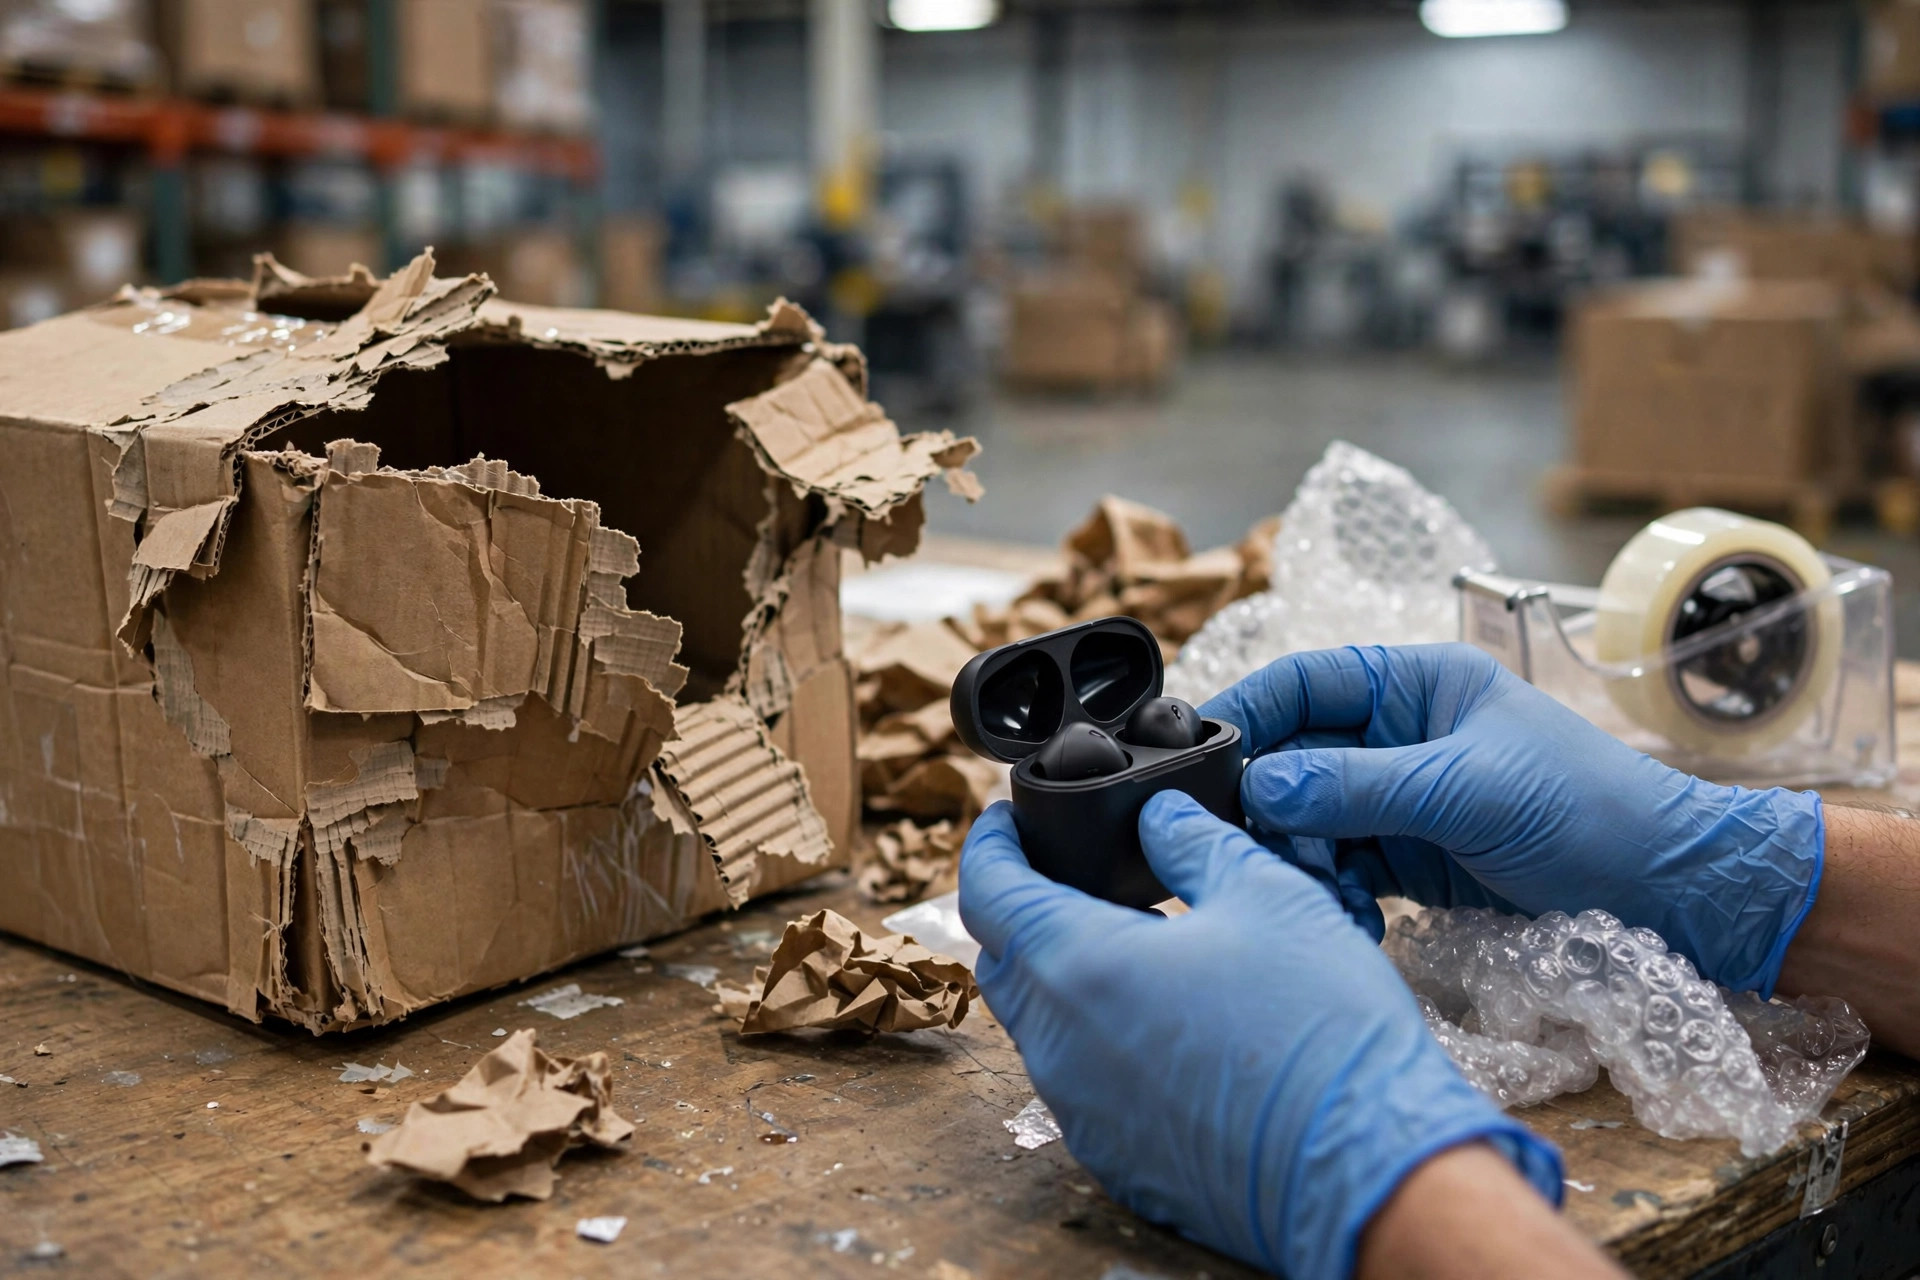
First, separate two different problems: carrier damage versus under-packaging. He runs a small self-operated warehouse outside Indianapolis, a little over 30,000 square feet. I had him pull inspection photos for 20 "damaged in transit" returns: 12 had intact outer boxes with broken products inside — under-packaging; 5 had crushed boxes — rough carrier handling; 3 weren't damaged at all, buyers just wanted an excuse. How to check: have the warehouse photograph every return inspection and sort them into a two-by-two grid — outer box intact/damaged against product intact/damaged. A week of that gives you the answer. Then audit the outbound packaging standard: his speaker shipped in a single-wall corrugated box with one layer of bubble wrap, and nobody had ever run a drop test. We re-ran drop and compression tests against the carrier's requirements (check the carrier's latest packaging policy for the current standard), then moved to double-wall corrugated with a custom foam insert. Per-unit packaging cost went up less than fifty cents — nothing next to what returns were costing. Who owns it: the warehouse lead sets the standard, operations approves the budget.
Then batch quality. "Defective" returns clustered after mid-February shipments. The inbound QC log told the story: he'd switched contract manufacturers at the end of January, and the first production run from the new factory went through at the old sampling rate — nobody tightened it. How to check: match return serial numbers against inbound batches to see if defects cluster in one lot; review the QC log for sampling rates and whether a first-article inspection was done after the supplier change. Who owns it: purchasing and QC. The root cause: the new factory's battery-compartment latch had a wider tolerance, and a light shake cut the power — the classic "changed suppliers, skipped first-article verification" trap.
Feed the returns data back, or you'll do this again
The step everyone skips after the fix: turn return data into daily warehouse routine, a closed loop. Otherwise the same problem comes back in three months wearing a different SKU.
Three things. First, tighten inbound QC: new supplier, new factory, first mass-production run — double the sampling rate and require first-article sign-off; tie QC records to batch numbers so any return traces back to its lot. Second, photograph at pack-out: put a camera over the packing station and snap a "finished pack" photo for high-return SKUs before they ship. When a buyer claims "it arrived broken," the photo is your best evidence — and it settles whether the problem was warehouse packaging or the carrier. Third, upgrade the packaging standard: write the validated packaging spec into the SOP — which box type and which fill for each weight band and fragility level, no exceptions. His warehouse now runs a simple rule: any SKU whose return rate stays above 8% for two straight weeks triggers a 30-minute review with operations, warehouse, and purchasing in the room.
Return rate is a lagging indicator. By the time it hits 18%, you've already burned a month of ad spend and freight. The cheaper move is a weekly reason-code report — fifteen minutes every Monday morning scanning the distribution, killing problems while they're still seedlings. His speaker SKU now sits around 6%, and ads are back on. If you're staring at a SKU whose return rate is climbing, don't start by blaming buyers. Pull the reason codes first. The answer is usually in those three lines of data.