Start With the Money: $130,000 Sitting on the Water, Still Stocking Out
A Shenzhen seller of home storage products moves 200 units a day at $28 a unit with a 35% gross margin. Ocean freight from Shenzhen to his US West Coast overseas warehouse takes 35 days door to door. To avoid stockouts, he habitually stocks 60 days of sales.
200 × 60 = 12,000 units. At $9 unit cost, that is $108,000 in inventory value alone. Add first-leg freight, duties, and final-mile inbound, and he has close to $130,000 in cash sitting in the supply chain.
At an 8% annual cost of capital, that is $10,400 a year in interest alone. Money spent for nothing? Mostly.
But here is the worse part: in October 2024, he still stocked out for 11 days. Nine of those days were port congestion inside the 35-day transit window; another six came from a late factory delivery. Sixty days of stock on hand, eleven days of stockout.
That is the reality for most overseas-warehouse sellers: the money gets spent, the stockout happens anyway. The problem is not stocking too much or too little. It is that the stocking quantity was never calculated — it was guessed.
The Full Worked Example: Translating 35 Transit Days Into Hard Numbers
Two numbers run the whole game: the reorder point and safety stock.
Reorder point = average daily sales × transit days + safety stock Safety stock = Z × daily demand standard deviation × √(transit days)
Here is a complete worked example (illustrative figures — the method is what matters):
- Average daily sales: 200 units
- Daily demand standard deviation: 40 units
- Target service level 95%, Z = 1.65
- Transit time: 35 days
Safety stock = 1.65 × 40 × √35 = 1.65 × 40 × 5.92 ≈ 390 units Reorder point = 200 × 35 + 390 = 7,390 units
The conclusion is specific: place the replenishment order the moment overseas inventory drops to 7,390 units — not when it "feels low."
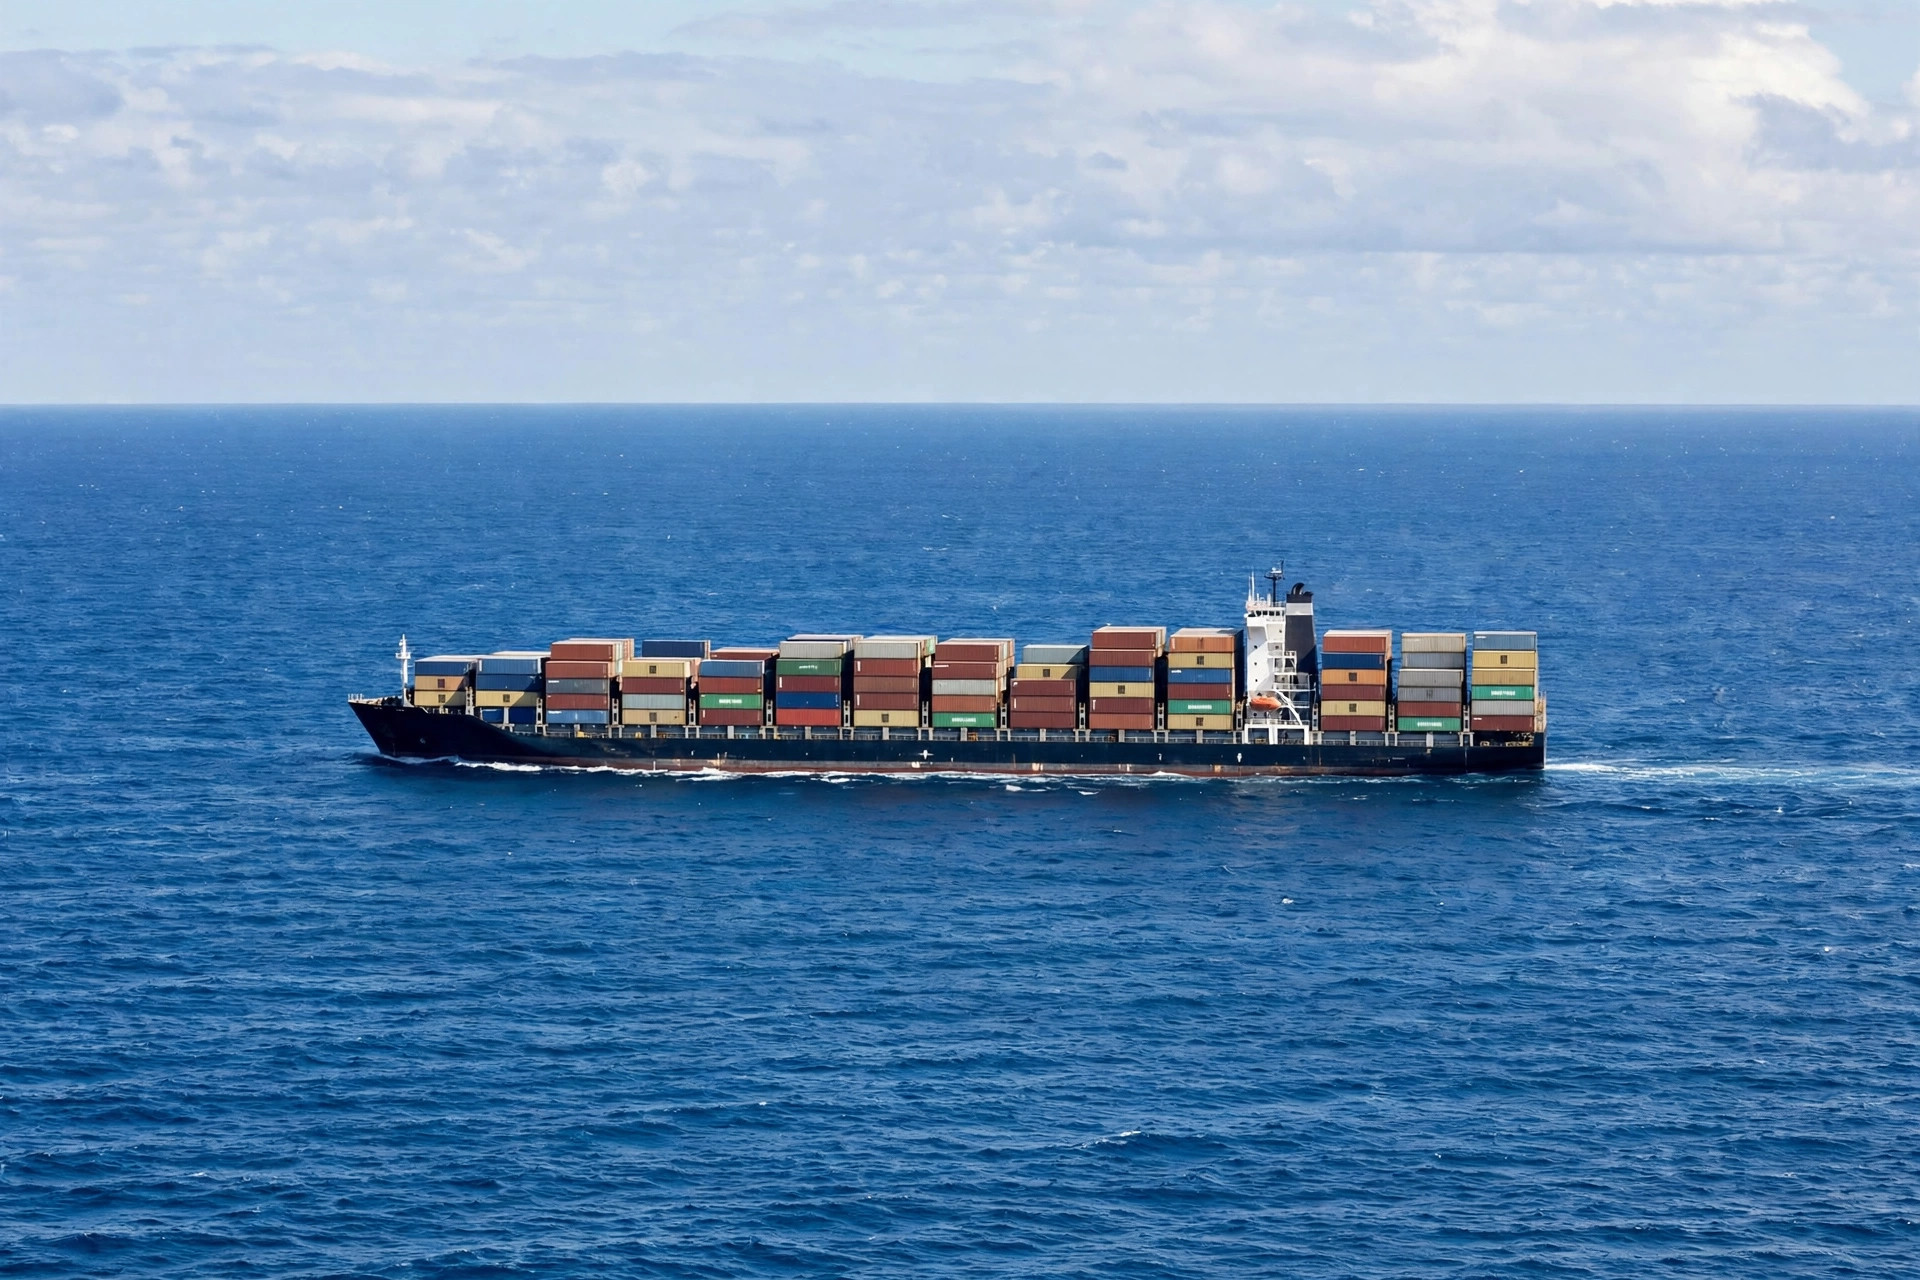
Note the cruelest term in the formula: √35. The longer the transit, the faster safety stock grows. Thirty-five days in transit demands 2.2× the safety stock of a 7-day pipeline. That is the ocean-freight seller's fate: until the sailing shortens, not a dollar of safety stock can be saved — unless you change the approach, as below.
Breaking Down the Cost Structure: Where the Money Actually Goes
Four cost buckets for a 35-day-transit SKU:
- Capital carrying cost: in-transit plus on-hand inventory value, times your cost of capital. The seller above pays $10,400 a year in interest right here.
- Warehousing fees: overseas warehouses bill monthly. Every extra month a slow mover sits there is pure burn.
- Stockout cost: not just "a few days of missed sales." Rankings slip, ad spend burns with nothing to convert, listing weight decays, and recovery takes weeks. But this must be quantified — do not let gut feeling inflate it.
- Clearance losses: dead stock eventually gets dumped at a discount, and that loss is real money.
Overstocking and understocking lose different money:
| Cost item | Overstock (90 days) | Understock (45 days) | Balanced (60 days + dynamic safety stock) |
|---|---|---|---|
| Capital tied up | High — five figures a year in interest | Low | Moderate |
| Warehousing | High, big dead-stock risk | Low | Controllable |
| Stockout risk | Minimal | High, frequent gaps | Controllable, buffered |
| Dead-stock risk | High, clearance eats principal | Low | Low |
| Fits | Winners, seasonal SKUs | Long tail, test SKUs | Core regular SKUs |
One table, one blunt conclusion: no single stocking quantity fits every SKU. Running the whole store on one number is the most common wasted spend in replenishment.
The Counterintuitive Part: More Safety Stock Is Not Better
Most sellers' instinct says stockouts are the worst outcome, so safety stock should be as high as possible. That instinct is wrong — it never did the marginal math.
Same illustrative numbers. Raising service level from 95% to 99% moves Z from 1.65 to 2.33:
Safety stock = 2.33 × 40 × 5.92 ≈ 551 units
That is 161 extra units versus the 95% level. What does it buy? Stockout probability drops from 5% to 1% — four percentage points.
The inventory value, warehousing, and carrying cost of those 161 units buys four points of insurance. Whether that is worth it depends entirely on what one stockout actually costs you. Most sellers never ran that number and set 99% on feeling. That is money spent for nothing.
The second case stings more. In September 2023, a Christmas décor seller stocked 8,000 light strings — 120 days of sales — at $6 unit cost. Demand came in soft; only 5,000 sold. The remaining 3,000 were dumped in January at half price, $9.99 a unit, and after three extra months of warehousing and carrying cost, the whole exercise barely broke even (illustrative magnitudes — the classic "overstock eats principal" ending).
A stockout costs you opportunity. Dead stock costs you principal. For standard products at ≈30% margin, sitting on a batch that will not move is usually more expensive than a few days of stockout. Run that math before you stock, not after.
The Levers: Four Moves That Actually Save Money
The seller who stocked out for 11 days changed four things. In the first half of 2025: zero stockouts, average inventory down 18%.
- Tier SKUs by service level: A-items (top 20% by sales) at 95%, B-items at 90%, C-items at 85% or no safety stock at all. A long-tail SKU stocking out for a few days beats capital rotting on the shelf.
- Ocean as the base, air as the fuse: keep ≈10% of volume on air freight inside the 35-day ocean pipeline. When nothing breaks, the air volume sells normally; when a gap looms, air is the lifeline. Cheaper than padding safety stock across the board.
- Split the lead time: 35 days is not one block. Factory lead time, first leg, customs clearance, final-mile inbound — measure each segment's variability separately, and aim safety stock at the most volatile segment. His stockout burned 9 days in port congestion; the congested segment is what safety stock really needs to cover.
- Split the shipment: divide one batch across two bills of lading, a week apart. One 35-day pipeline becomes two staggered 35-day pipelines — volatility smooths itself, at zero extra inventory cost.
The Computable Conclusion
Optimal safety stock has a formula: the point where the holding cost of one more unit equals the expected stockout loss of one fewer unit.
Critical stockout rate p* = unit holding cost ÷ (unit holding cost + unit stockout cost)
Example (illustrative): $1.20/month unit holding cost (capital + warehousing), $8 unit stockout cost (margin + wasted ads + ranking recovery).
p* = 1.2 ÷ (1.2 + 8) ≈ 13%
Adding inventory only pays off when stockout probability exceeds 13%. That maps to an 87% service level — 95% was never needed.
So stop asking "how many days of safety stock." First compute your own unit holding cost and unit stockout cost, derive your critical rate, and back into the service level and safety stock. Cannot compute it yet? Start at 90%, run three months on real data, then adjust.
Gut feeling is the most expensive replenishment strategy there is.
By Lao Zhou, Logistics Cost Analyst