
Return rates are quiet until they are not. One of my stores sat around 9% through last September, then jumped to 17% right after the October sale. My inbox filled up with "not like the pictures," "wrong size," and "arrived damaged." Ad spend kept burning, and returns ate the profit. My first instinct was to rewrite the listing, bold the title, add warning text in red. Two weeks later, nothing had moved. Only when I worked through a proper troubleshooting chain, step by step, did I find the real problem, and it was not where I thought it was.
A return rate spike is dangerous precisely because it tempts you to fix by feel. Feelings lie. Return reason codes and a fixed checking order do not. Here is the chain I built after burning money on guesses. Do not shuffle the order. The earlier steps are the cheapest.
Return Rate Spike Step One: Read the Reason Codes Before You Touch the Listing
Most sellers see the spike and immediately rewrite the title and images. I used to do that too, and it changed nothing, because the root cause was in the warehouse, not the listing.
Do one thing first: export the last 30 days of return reason codes and sort by volume. When I did that, the top code was not "not as described." It was "damaged item," nearly 40% of returns. Second was "wrong size." "Not like the pictures" came third. A damage code points at packaging and shipping, not at your listing copy.
One more detail: split reason codes by SKU, never look at the store total alone. Another SKU of mine was sitting at a perfectly normal 6% in the same period. The store-wide 17% was one bad SKU dragging the average up. If you only look at the total, you will think the whole store is sick when actually one product is leaking.
Here is the contrarian part: when return rates spike, rewriting the listing first is the most expensive fix available. New copy needs review, rankings wobble, traffic has to relearn the page, and after all that you may not have touched the real cause. Reading reason codes takes half an hour and costs nothing. Get the order wrong and you burn both money and time.
Descriptions, Photos, and Size Charts: The Cheapest Fixes in Order
When the reason codes do point at "not as described" or photo color mismatch, then fix the listing, and check in this order: key specs in the description, the size chart, then the photos.
Start with the description. Look for the one or two sentences buyers are most likely to misread. A friend selling home storage wrote "large storage box" and buyers assumed 60 liters. The real box was 45 liters, and returns came in waves. Changing it to "45 liters, fits about 30 summer T-shirts" cut that class of returns by more than half. More description is not better description. What matters is nailing down the exact places where buyers guess wrong.
Then the size chart. For apparel, size is the perennial number-one return driver. Do not just check whether a chart exists. Check whether it is accurate: measure three actual units, shoulder, chest, and length, against the chart line by line. And check for one crucial sentence: "measured flat, allow 1-2 cm tolerance." Many sellers copy the factory chart, which is measured from the pattern, not the finished garment, and can be a full size off. If the chart is wrong, no amount of title or photo editing will save you.
Then the photos. Color mismatch is the most unfair return cause out there. Under studio lights a white looks warm; under a buyer's home lighting it looks cold, and back it goes. My rule: beyond the main studio shots, always include one photo in natural light, plus one comparison shot against something everyone knows, like "about as tall as a standard water bottle." Buyers have no feel for centimeters. They have a feel for a water bottle. Color and size-perception returns drop a lot from a single good comparison photo.
Work through these three and watch the "not as described" codes for a week. If they fall, you are on the right track. If nothing moves, stop editing and move to the next link in the chain.
Packaging and Mispicks: The Usual Suspects That Are Easiest to Fix
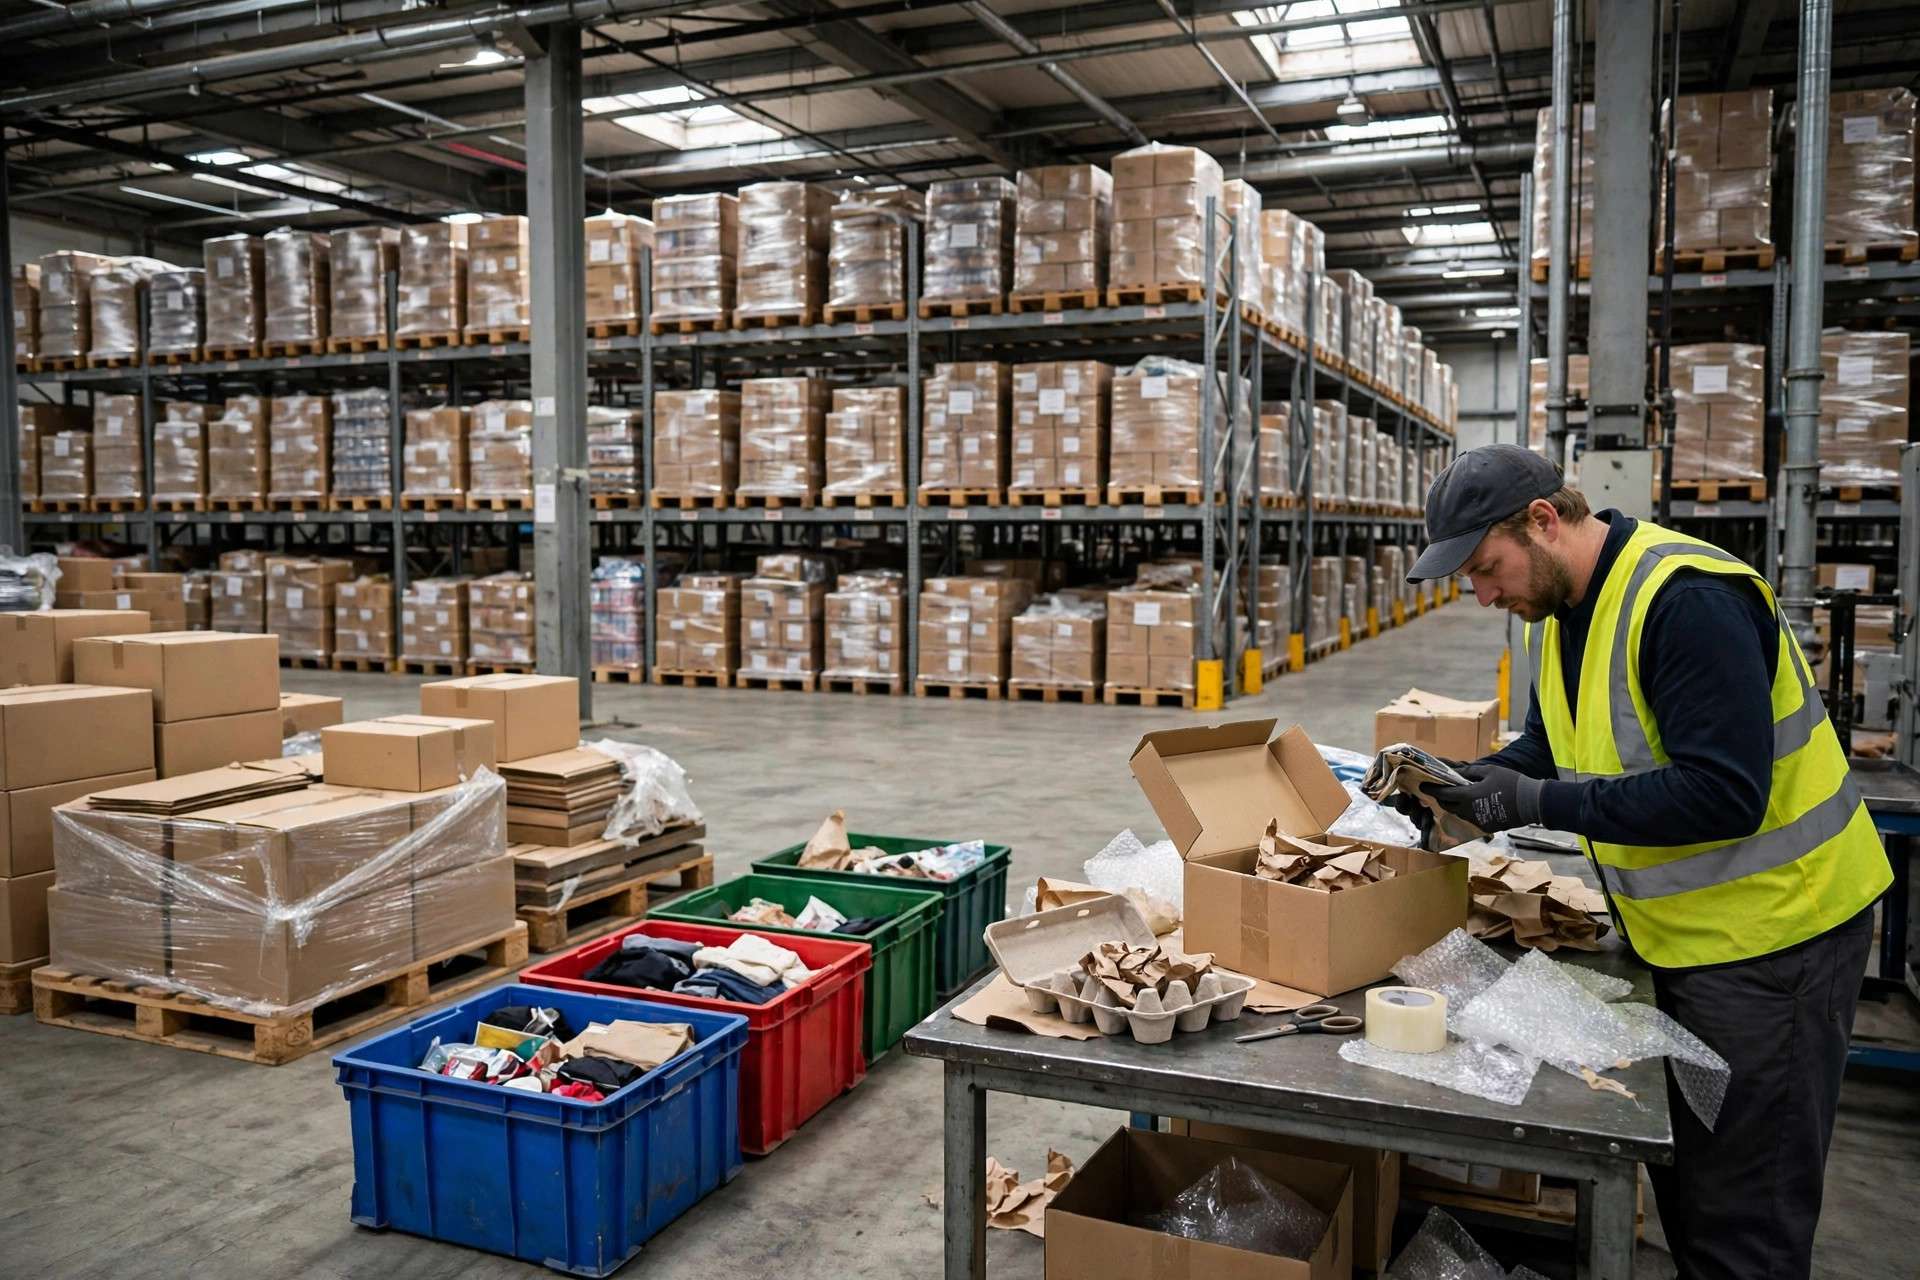
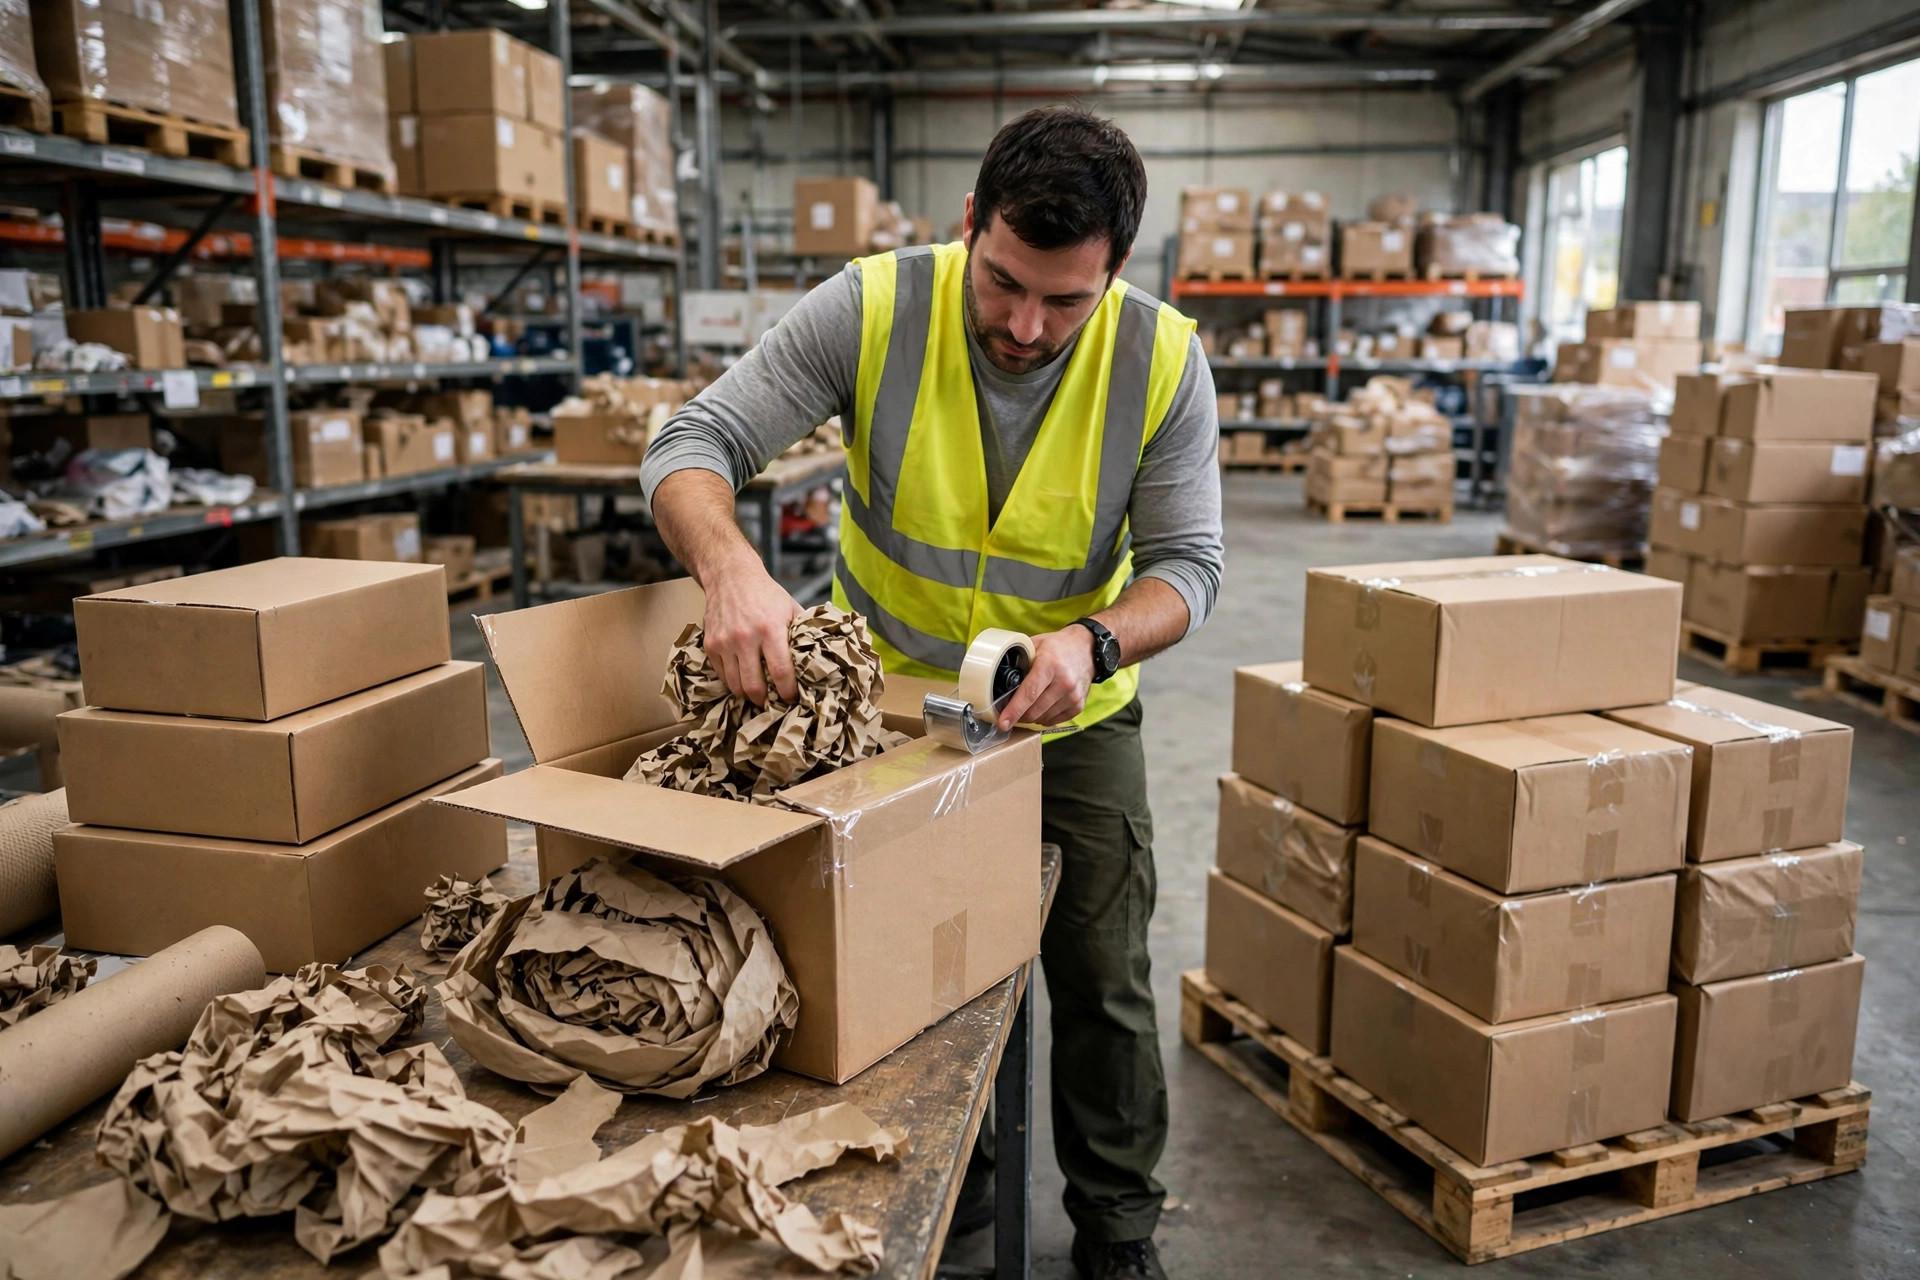
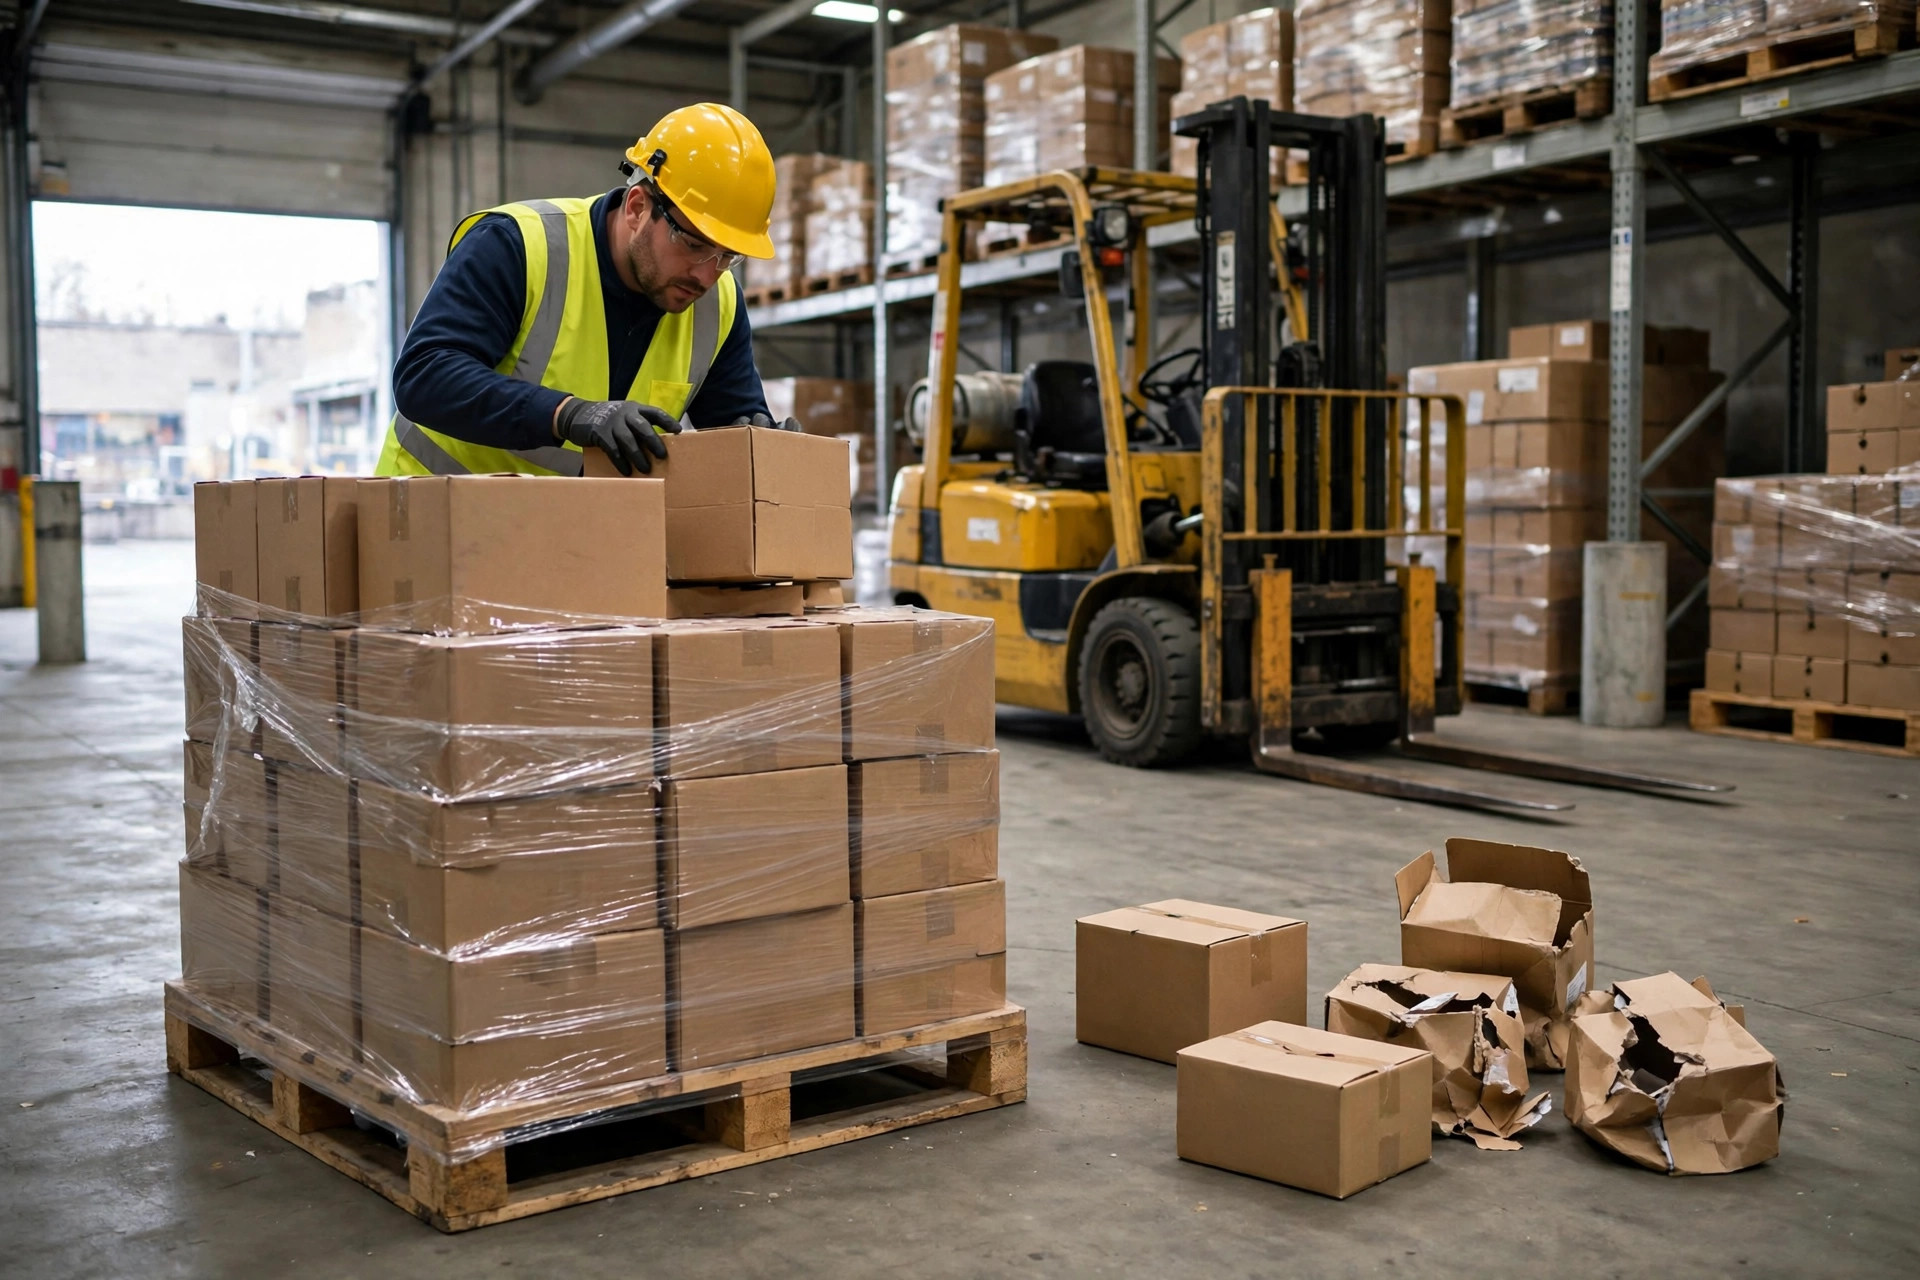
My 17% spike, in the end, came down to packaging. During the sale we switched to a thinner carton from a new batch. The supplier had changed the material without telling anyone. Corners caved in transit, buyers opened a dented box and sent it straight back, and the reason code said "damaged." I never suspected the box, because it was "the same box we always used." It was not.
Checking packaging takes two moves. First, open 20 recently shipped parcels at random and look: dented corners, enough fill, product actually secured inside. Second, pull buyer photos from the last three damage returns and see whether the damage is in the same spot every time. The same spot failing repeatedly means a packaging structure problem, not random shipping bad luck.
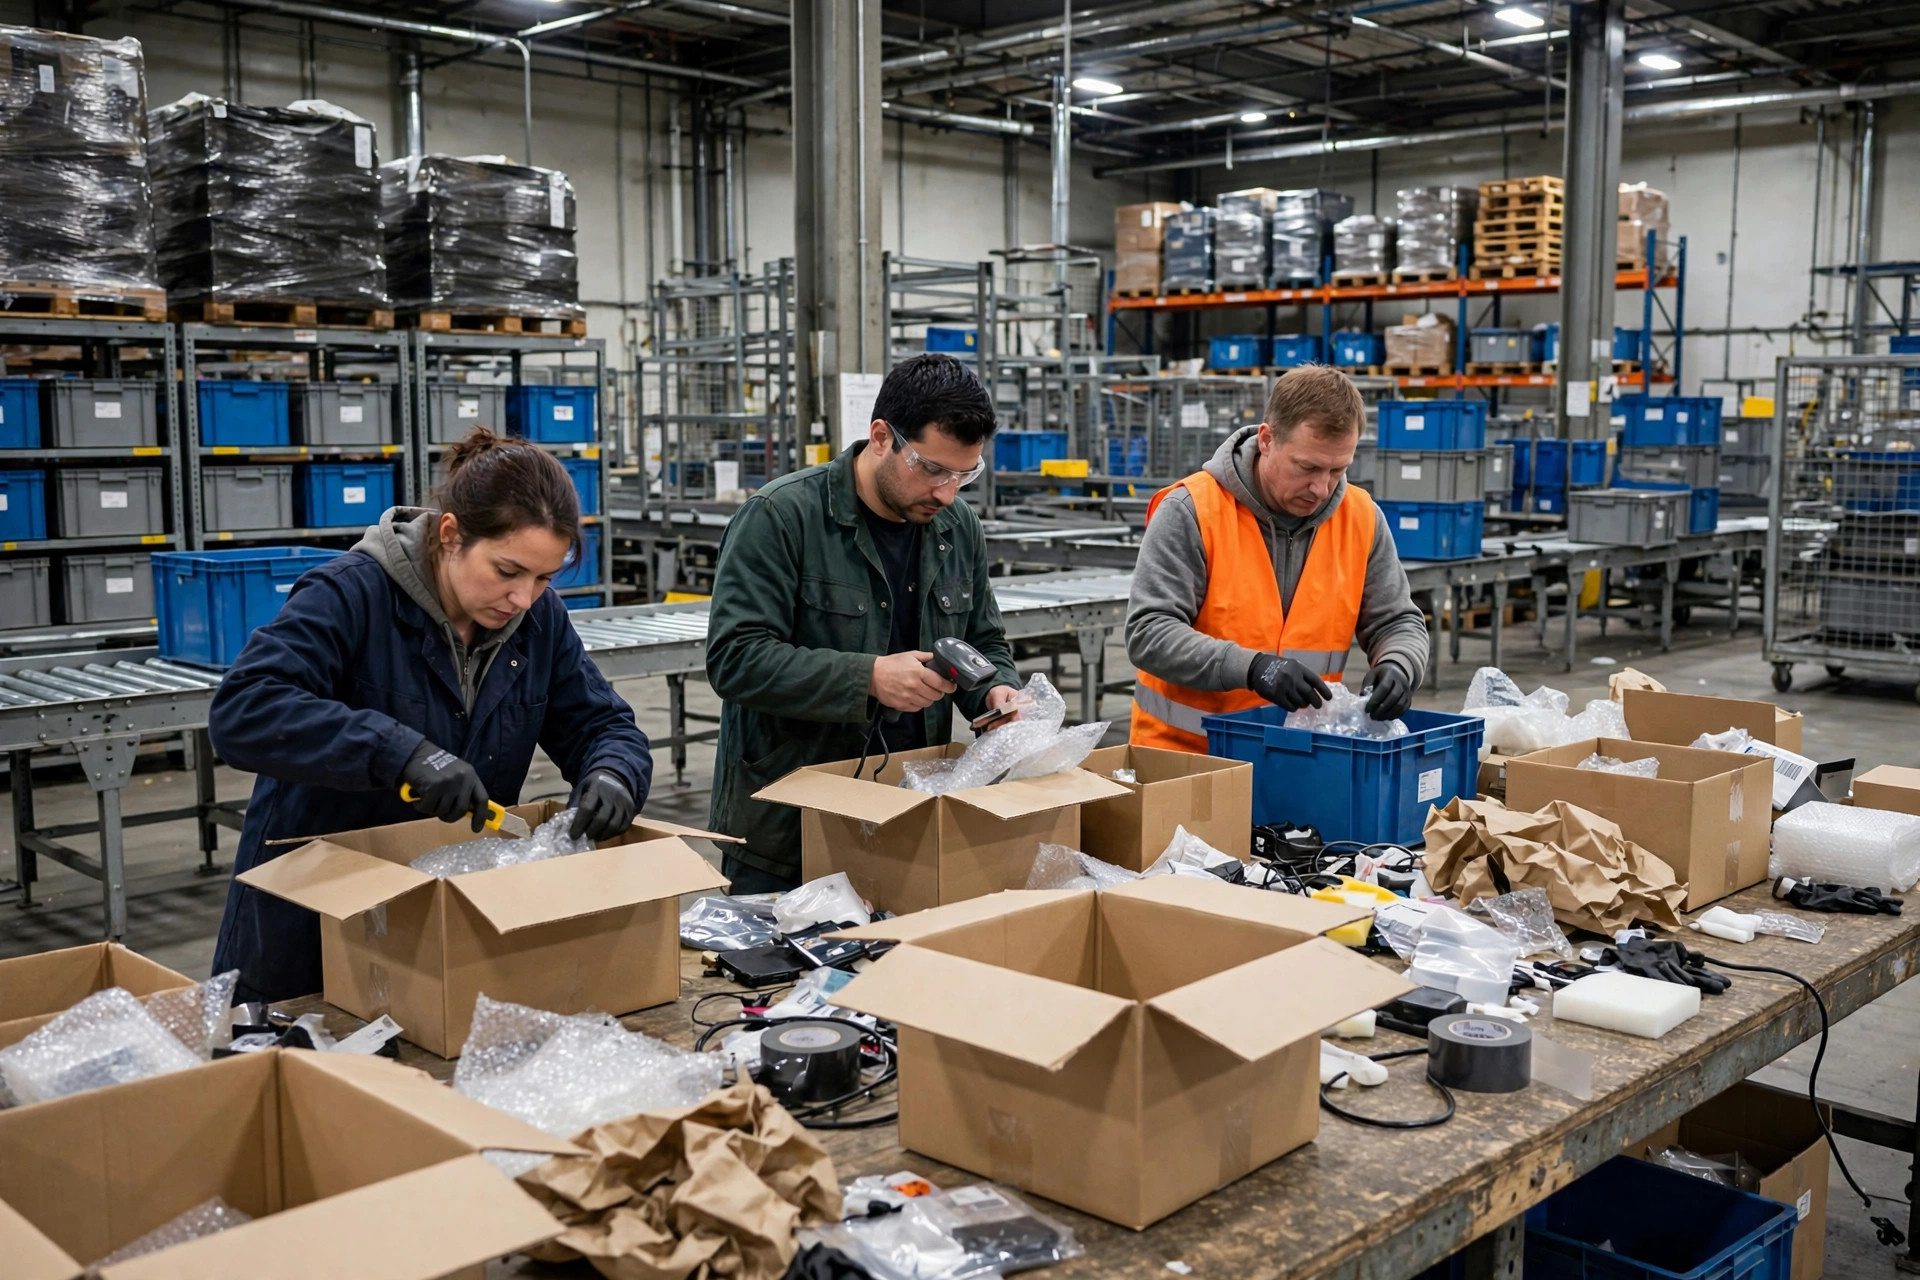
Mispicks are the other high-frequency culprit, and the most infuriating: the buyer ordered black, white arrived, and you pay the return shipping. Check two things: whether picking includes a barcode scan verification per SKU, and whether similar SKUs sit in adjacent bins. I have seen a seller store black and white variants in the same bin slot, pickers telling them apart by eye, and a permanently high mispick rate. Separate the bins, enforce scan verification, and mispicks drop to negligible.
Run the math on my store as a worked example: getting the return rate from 17% back to 9% meant roughly 80 fewer returns a month. Each return costs outbound and return shipping, inspection, and restocking, and some units come back unsellable. Fixing the packaging took a week of switching carton stock and adding corner protectors, and cost far less than a single month of ad spend burned on orders that came straight back. Cheap links first, expensive links later. That is the whole point of having a chain.
| Check | How to check it | Rough time | | Description specs | Find the sentence buyers guess wrong, rewrite with a concrete number and a reference object | Half a day | | Size chart | Measure three real units, compare line by line | One day | | Photo color and scale | Add a natural-light shot and a reference-object comparison | One to two days | | Packaging damage | Open 20 shipped parcels, check whether damage repeats in the same spot | Half a day | | Mispicks | Verify scan checks at picking, separate similar SKUs into different bins | One day |
A return rate spike is not scary. Random fixing is. Locate with reason codes, work cheapest to most expensive, and watch a week of data after each fix before touching the next link. This approach genuinely works for me. That is how 17% got walked back to 9%.
By Ah K, E-commerce Seller (5 yrs)