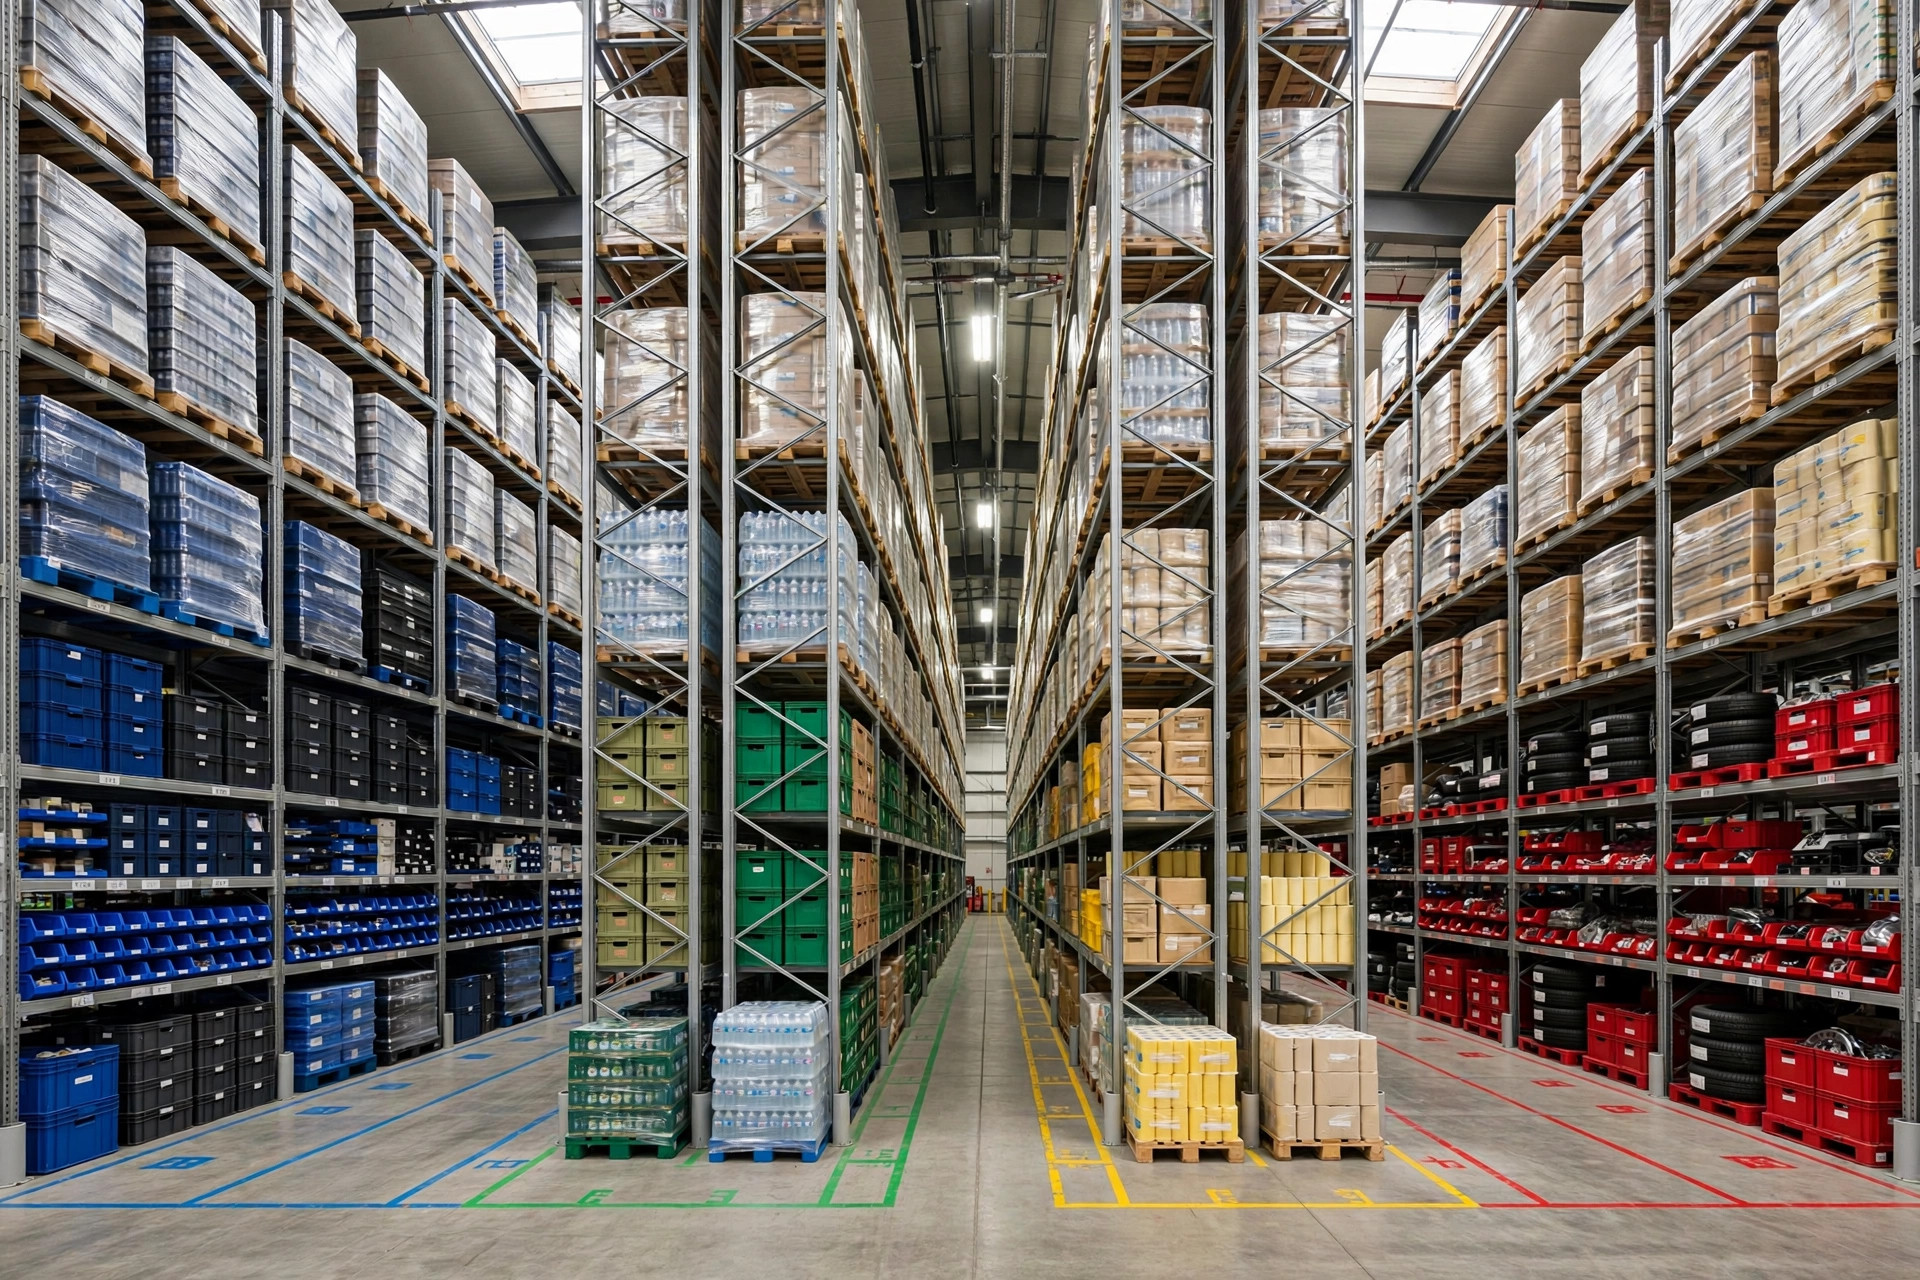
Two years ago I visited an e-commerce warehouse in Fontana — 5,000+ SKUs. The owner complained: full physical inventory once a month, two days of no shipping, and inventory accuracy still stuck at 94%. I asked how he scheduled the counts. The whole building at once, whichever zone was free. That's the problem, I told him — you're counting slow movers that barely budge once a month with the same frequency as SKUs shipping hundreds of units a day. No wonder the team is exhausted.
The whole point of cycle counting fits in one sentence: count fast movers often, slow movers rarely. ABC classification exists to do exactly that. Don't let the name intimidate you — it's just ranking your SKUs by pick frequency or shipped value and splitting them into three tiers.
How to do ABC without guessing
The standard split: Class A is the top 15–20% of SKUs by volume, usually driving 70–80% of order lines; Class B is the middle ~30%, driving 15–20%; Class C is the remaining 50–60%, under 10%. The numbers aren't sacred — what matters is pulling the data. Export 90 days of outbound order lines from your WMS (or shipment detail if you have no WMS), aggregate by SKU, sort descending, and cut at the cumulative breakpoints. Half a day's work.
Two details make or break the classification. First, new SKUs default to B. Fresh listings have no history — park them in C and nobody counts them for three months, and if one takes off, the books are already wrong; park them in A and you waste count labor. B is the safe slot; re-tier after a month of data. Second, high-value small items go straight to A. Some SKUs don't move fast but each unit is expensive and easy to lose — phone accessories, cosmetic samples. Losing one costs tens of dollars. Add a value override: anything over $50 unit cost gets flagged into A regardless of velocity.
Classification isn't set-and-forget. E-commerce SKU velocity shifts constantly — re-run the classification quarterly, and always re-run before peak season. Hot sellers and dead stock swap seats every season. The re-run is trivial — export, sort, done in 30 minutes — yet plenty of warehouses never re-run it once, and the tiers become fiction.
The frequency schedule, and the labor math behind it
The proven baseline: A weekly (twice weekly in peak), B monthly, C quarterly. That mix sustains 97–98% inventory accuracy as a normal outcome.
The math shows why it saves labor. A 5,000-SKU building: 800 A SKUs counted weekly; 1,500 B SKUs monthly, ~375 a week; 2,700 C SKUs quarterly, ~225 a week. Weekly total: ~1,400 SKUs. A practiced counter clears 40–60 locations an hour (slower in small-parts areas, faster in full-pallet zones) — call it 50. That's 28 labor-hours a week, two and a half person-days.
Compare the full-count approach: 5,000 SKUs once a month, two days, 8–10 people pulled off their jobs, shipping halted. Cycle counting spreads the work across every day — zero downtime, two people at three hours a day. And high-frequency A counts catch variances early: find it today, investigate tomorrow. Under monthly full counts, a variance can sit undiscovered for 29 days, and by then the cause is cold.
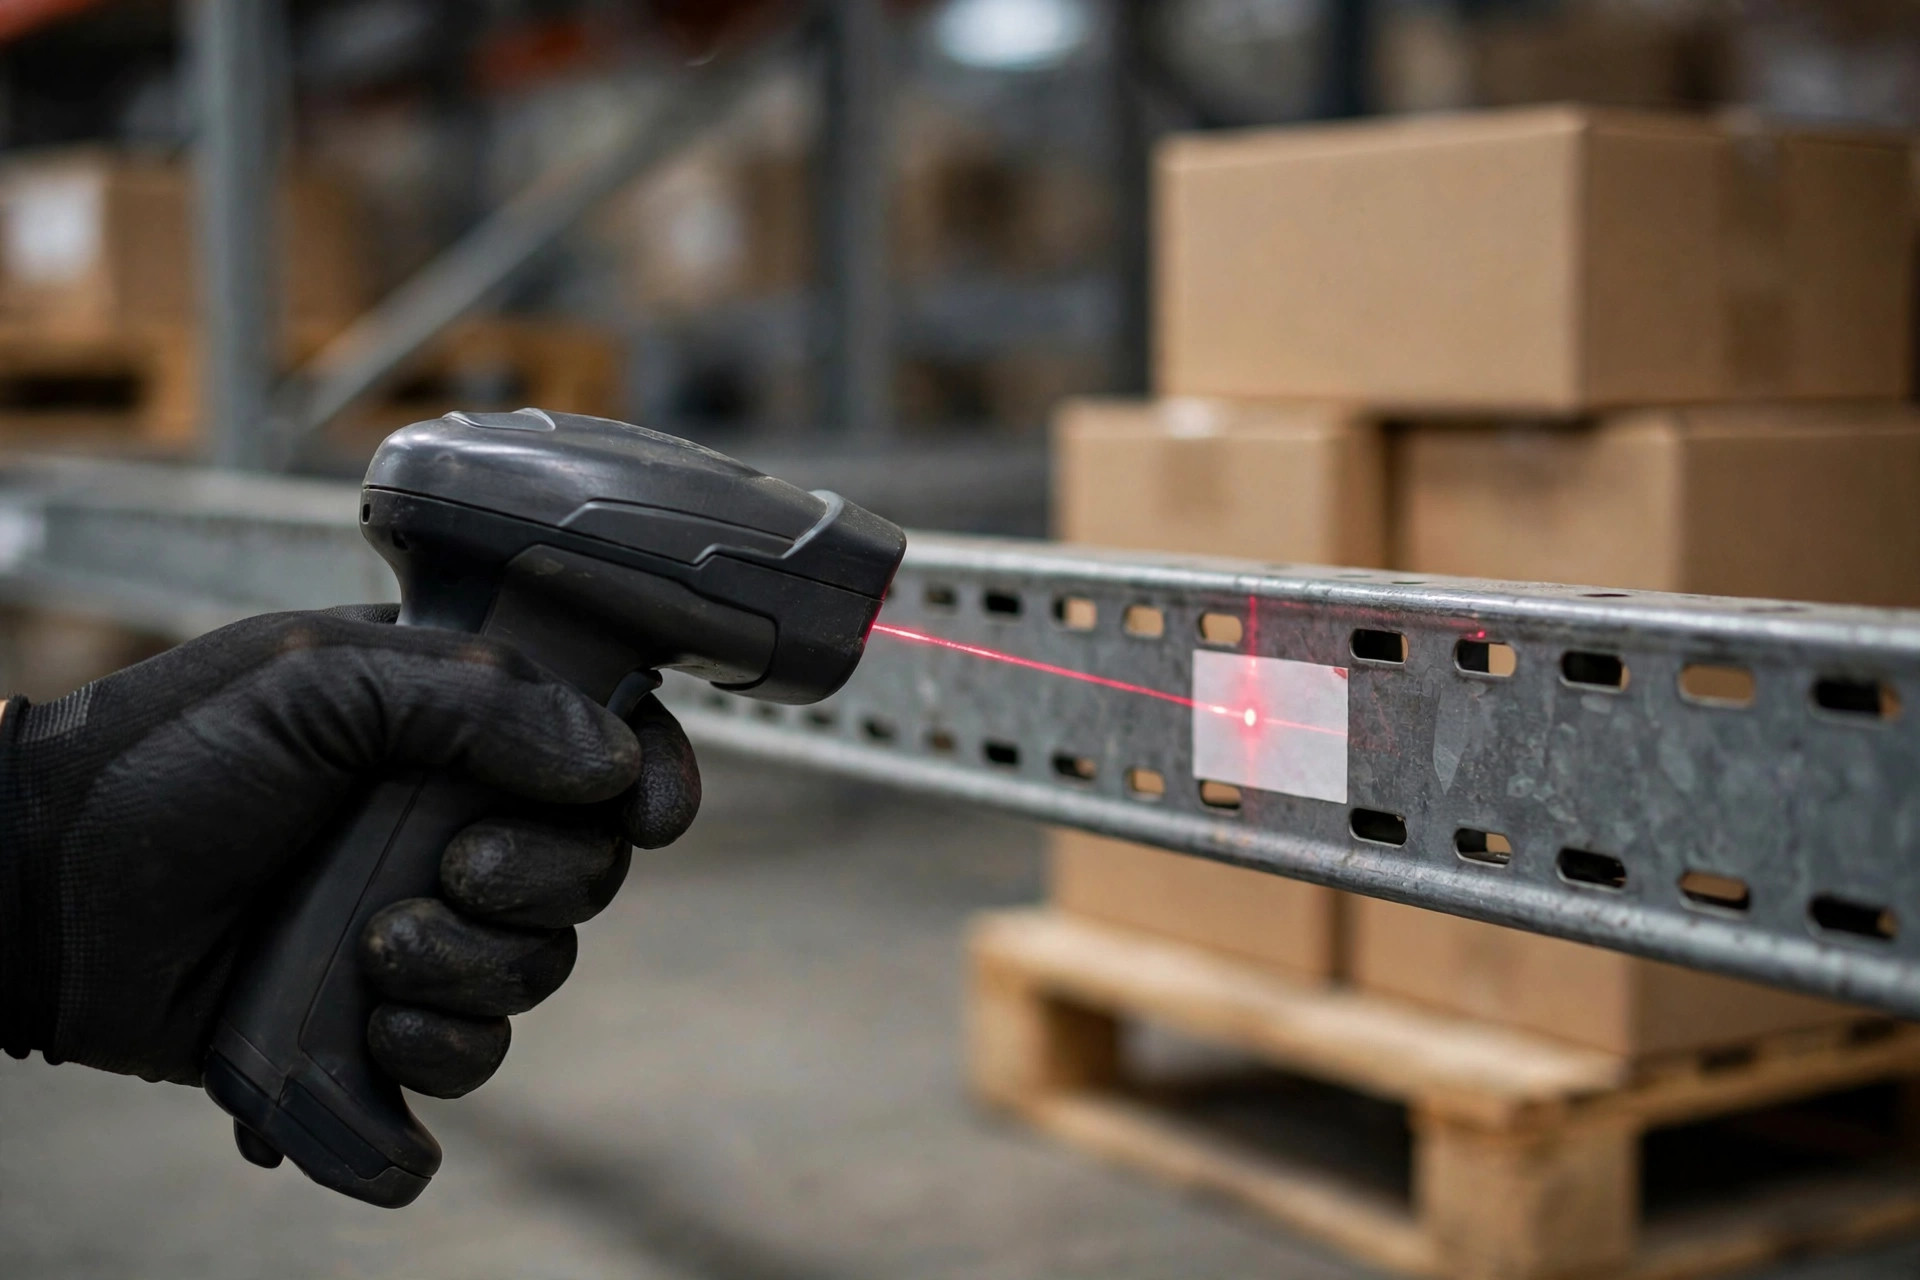
How do you build the schedule? Four columns: SKU, ABC tier, count-this-week (yes/no), assigned counter. If your WMS has a cycle-count module, set frequencies by tier and let it generate daily tasks. No module? Excel works fine: split A SKUs into four weekly batches, B into four monthly batches, C into twelve quarterly batches. Merge the three lists and you have each day's count sheet. The key: tasks must land on a person, a day, and a zone. "Count A this week" with no names attached counts nothing.
Investigating variances: use a fixed taxonomy, not gut feel
I recommend six fixed variance causes, as checkboxes on the count sheet. Roll them up monthly and the broken process reveals itself: receiving variance (quantity vs. paperwork mismatch), putaway misplacement (goods in location A, system says B), pick over/under, system posting lag (goods moved, transaction not posted), damage/write-off not recorded, and count error. After three months you'll find ~80% of variances sit in two buckets: putaway misplacement and pick errors. Both mean "nothing is lost, the record and the location just disagree" — and both have direct fixes: add a scan confirmation at putaway, add verification on A-SKU picks.
Here's the counterintuitive part: the highest variance rate is usually in A, not C. A SKUs move the most, and every receive, putaway, and pick is a chance to introduce error. Which is exactly why high-frequency counting pays — weekly A counts squash errors when they're young; on a quarterly cadence they'd compound for three months beyond investigation. I've seen a building with 3% monthly variance on A SKUs versus 0.5% on C. The owner wanted to flip the schedule. I stopped him: C's low rate just means it doesn't move — and A's 3% multiplied by its volume is tens of times C's in absolute dollars.
Tooling matters too, but in the right order. Handheld terminals with barcode scanning are the baseline — fast, direct upload, low error. Paper count sheets suit sub-500-SKU operations: zero investment, but double entry introduces errors. Voice-directed counting fits bulk areas and frees both hands. Don't overinvest in tools — I've seen small warehouses spend tens of thousands on count modules before doing ABC at all. No tool rescues a missing process. Sequence: ABC and frequencies first, tooling upgrades second.
Rolling it out in four steps — and three classic traps
Step one: pull data, build ABC tiers — half a day. Step two: set frequencies, generate the first week's task list, and pilot for two weeks on A only so the team learns the rhythm. Step three: roll out B and C, and stand up the variance process — same-day blind recount on any variance, root-cause investigation within 24 hours of confirmation (was it receiving, misplaced putaway, or an unposted transaction?), causes logged by category. Step four: review the variance-cause distribution monthly; whatever cause dominates, fix that process next month. Counting itself creates no value — the root causes counting uncovers, driving process fixes, are the value.
Three traps. First: counting non-blind. Hand a counter the system quantity and their brain starts "finding the number" — system says 10, they count 9, recount until they find 10, done. Blind counting gives locations without quantities; reconcile after. In my comparisons, blind counts surface 30%+ more variances. Teams resist at first — it feels slower — and adapt within two weeks.
Second: adjusting the books without investigating. Plenty of warehouses find a variance, post the adjustment, done. Next month the same location is off again. Adjusting stops the bleeding; investigating cures it. My rule: A variances always get root-caused, B variances 50% sampled, C variances logged only. Spend finite effort where it pays.
Third: treating cycle counting and the annual wall-to-wall as enemies. Once cycle counting runs well, finance and auditors still want an annual full count. Don't fight it — they serve different masters: cycle counting is a management tool, the annual count is a compliance event. A building holding 98% accuracy on cycle counts treats the annual count as a one-day formality. A building without cycle counting shuts down three days and still finds a mess.
One thing you can do tomorrow: export 90 days of outbound data from your WMS tonight, aggregate by SKU, sort, and see which 20% of SKUs are really your Class A. Odds are you'll find your team spends 80% of its counting effort on the 80% of SKUs that barely move. Flip the frequencies, and you'll see the difference in variance detection speed within the first month.