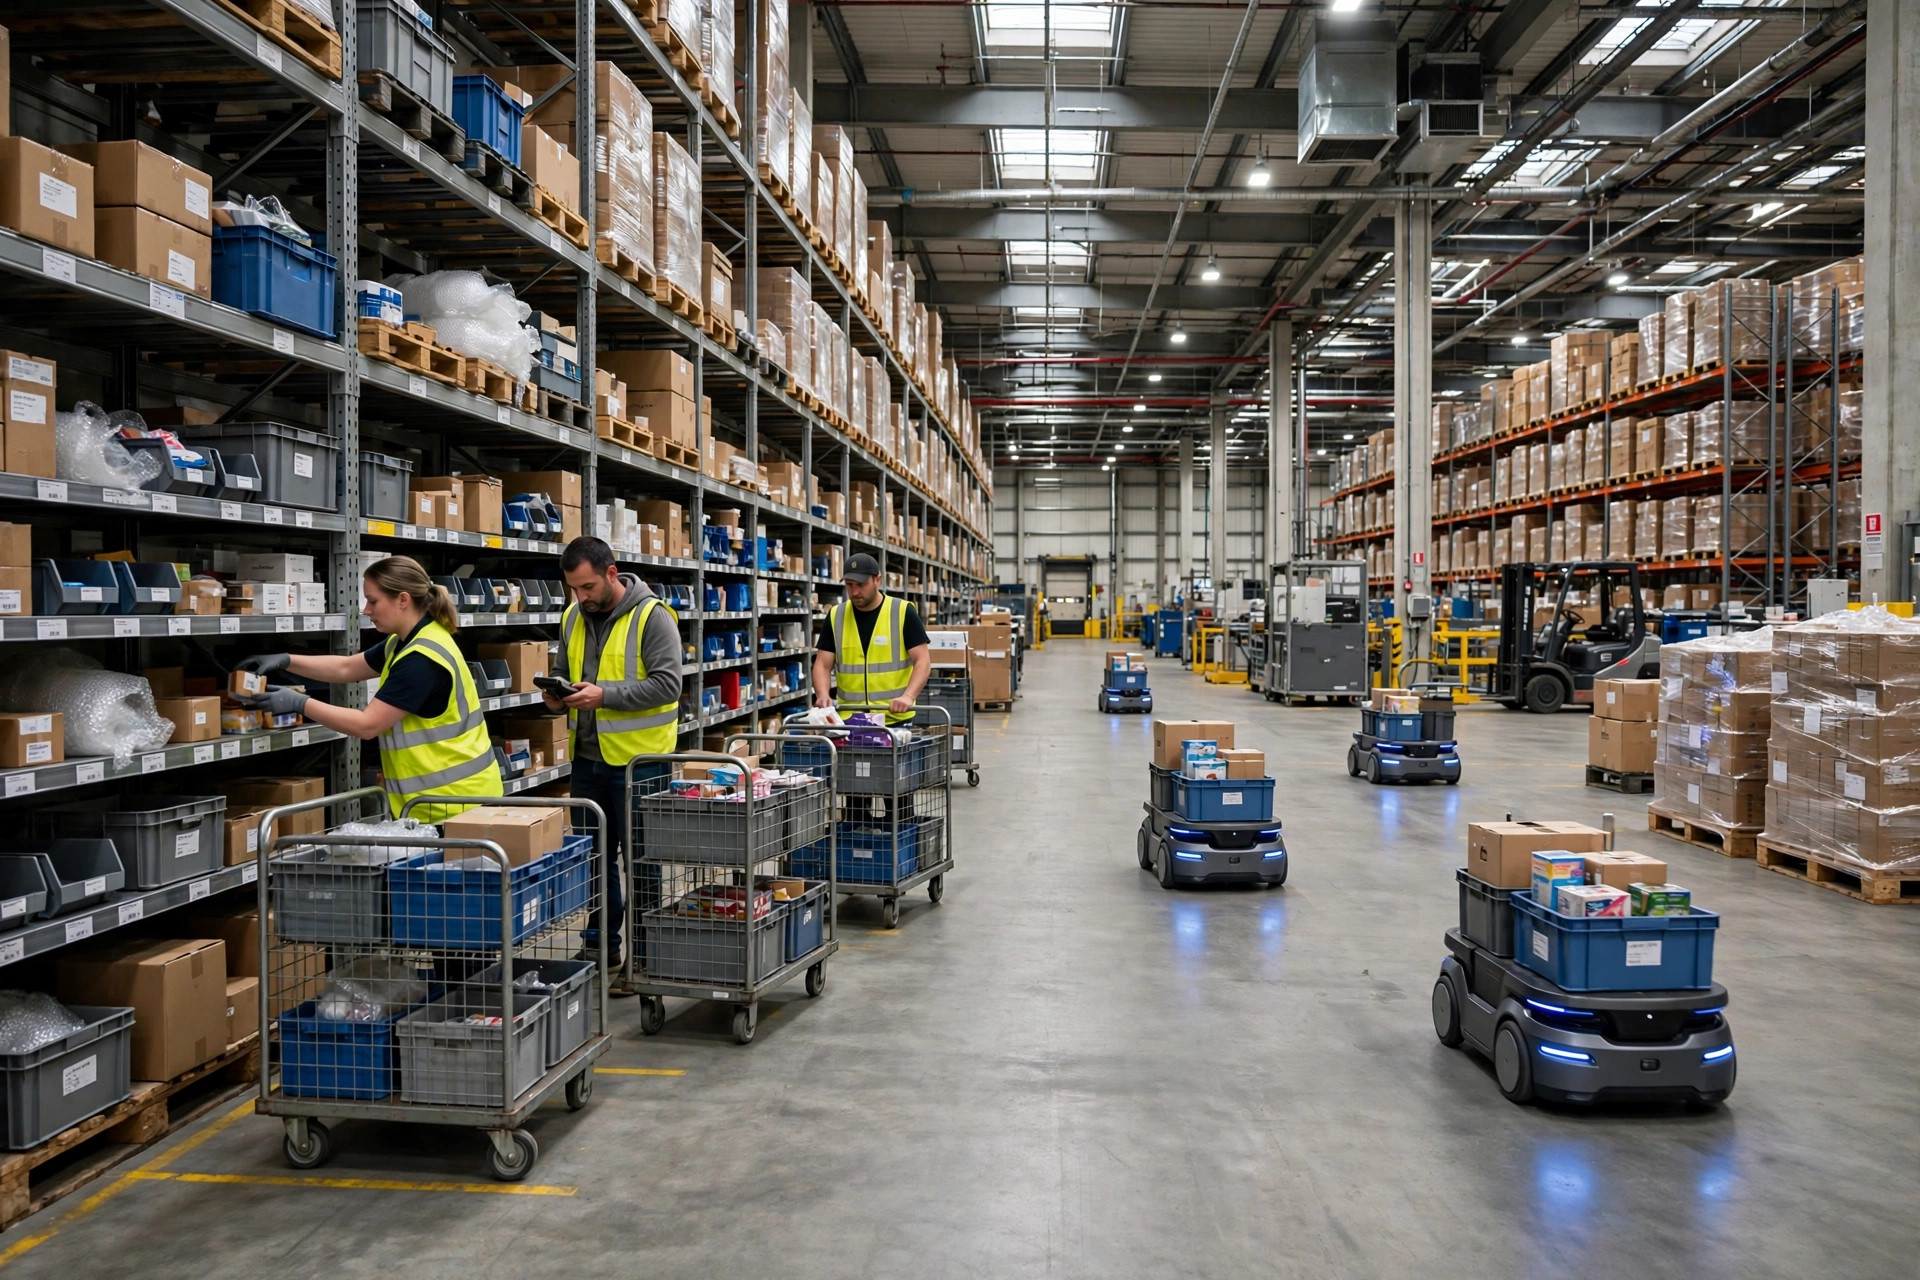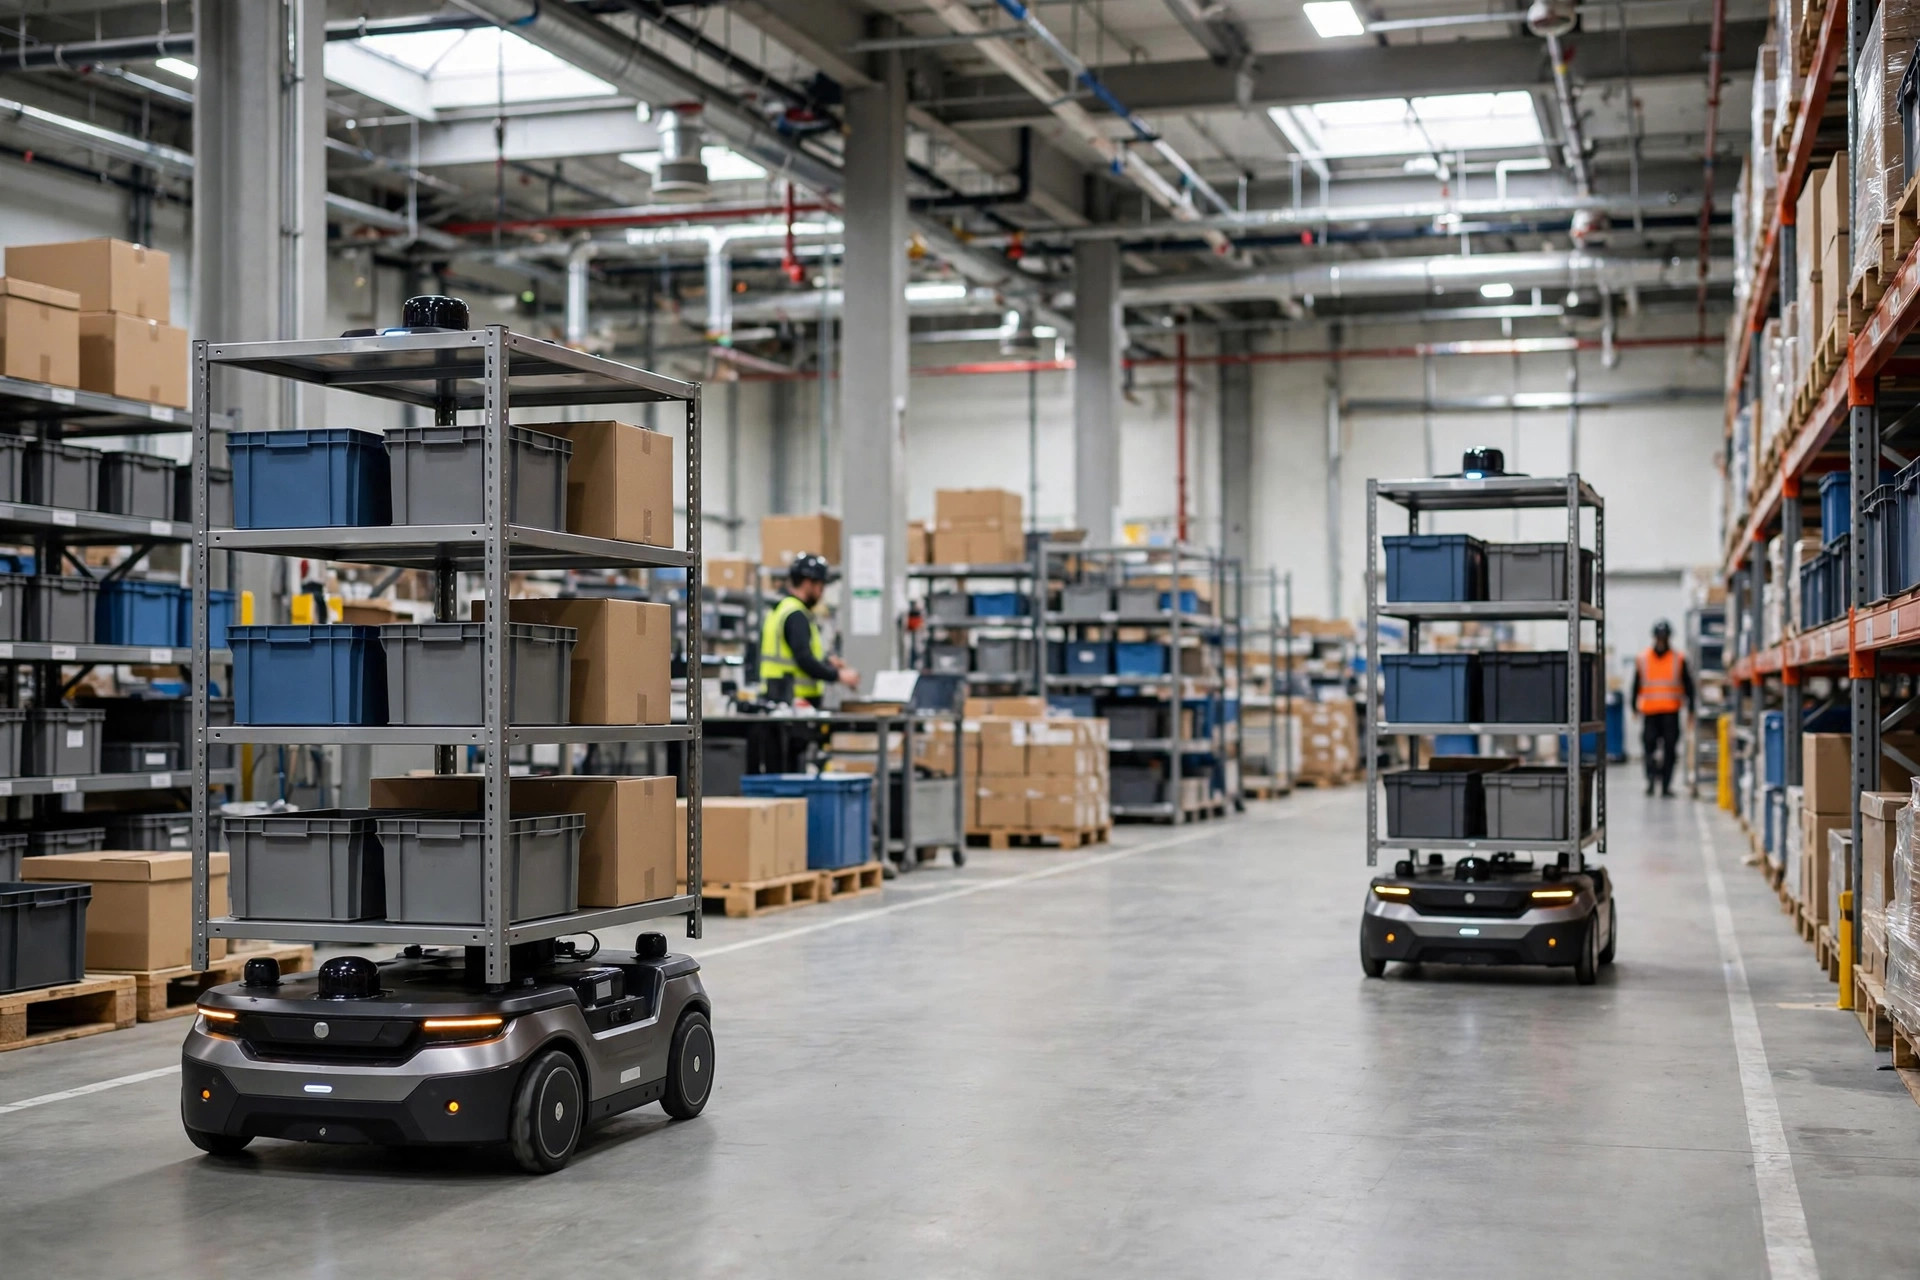
Let me open with two sets of books. The same 600 kg-payload AMR: a 3PL warehouse in Ontario, California deployed 20 units ahead of peak season in 2023 and hit an AMR payback period of 16 months. An e-commerce warehouse in Kunshan deployed 15 of the same units in 2024 — payback came out past four years. Same robot, nearly triple the difference. The robot is not the variable. The math is.
What the AMR payback period actually measures
The formula is one line:
Payback (years) = Total fleet investment ÷ (Annual labor saved − Annual added operating cost)
Total investment is not just the purchase price of the robots. It breaks into three parts: hardware (the fleet itself), software and integration (WMS integration, map deployment, commissioning), and hidden costs (floor QR codes or reflectors, Wi-Fi gap coverage, labor sitting idle during the 2–6 month commissioning window). The operating side costs money every year too: maintenance, software license fees, and at least half to one full-time maintenance engineer. Most vendor slide decks only show you "hardware divided by labor." That number is designed to look good. It is not real.
Take the California site first. The Ontario 3PL deployed 20 units in 2023 at $55,000 each — $1.1 million for the fleet. Software, mapping, and WMS integration work added $330,000, about 30% of hardware cost. That ratio normally runs 20%–40% in the industry (confirm against the vendor's latest quote). Total investment: $1.43 million. The fleet replaced 20 pickers — measured as full-time equivalents across three shifts, not headcount. Fully loaded California labor: the U.S. Bureau of Labor Statistics puts the mean hourly wage for freight and material movers at roughly $20; with payroll taxes, workers' comp, and benefits, the employer's real cost lands at $28–$35 per hour. Use $32: 20 people × 2,080 hours × $32 = $1.331 million per year. Annual operating cost: maintenance at 5% of hardware ($55,000), software fees ($80,000), one dedicated maintenance engineer ($110,000) — $245,000 total. Net annual savings: $1.086 million. Payback: 1.43 ÷ 1.086 ≈ 1.3 years. Sixteen months.
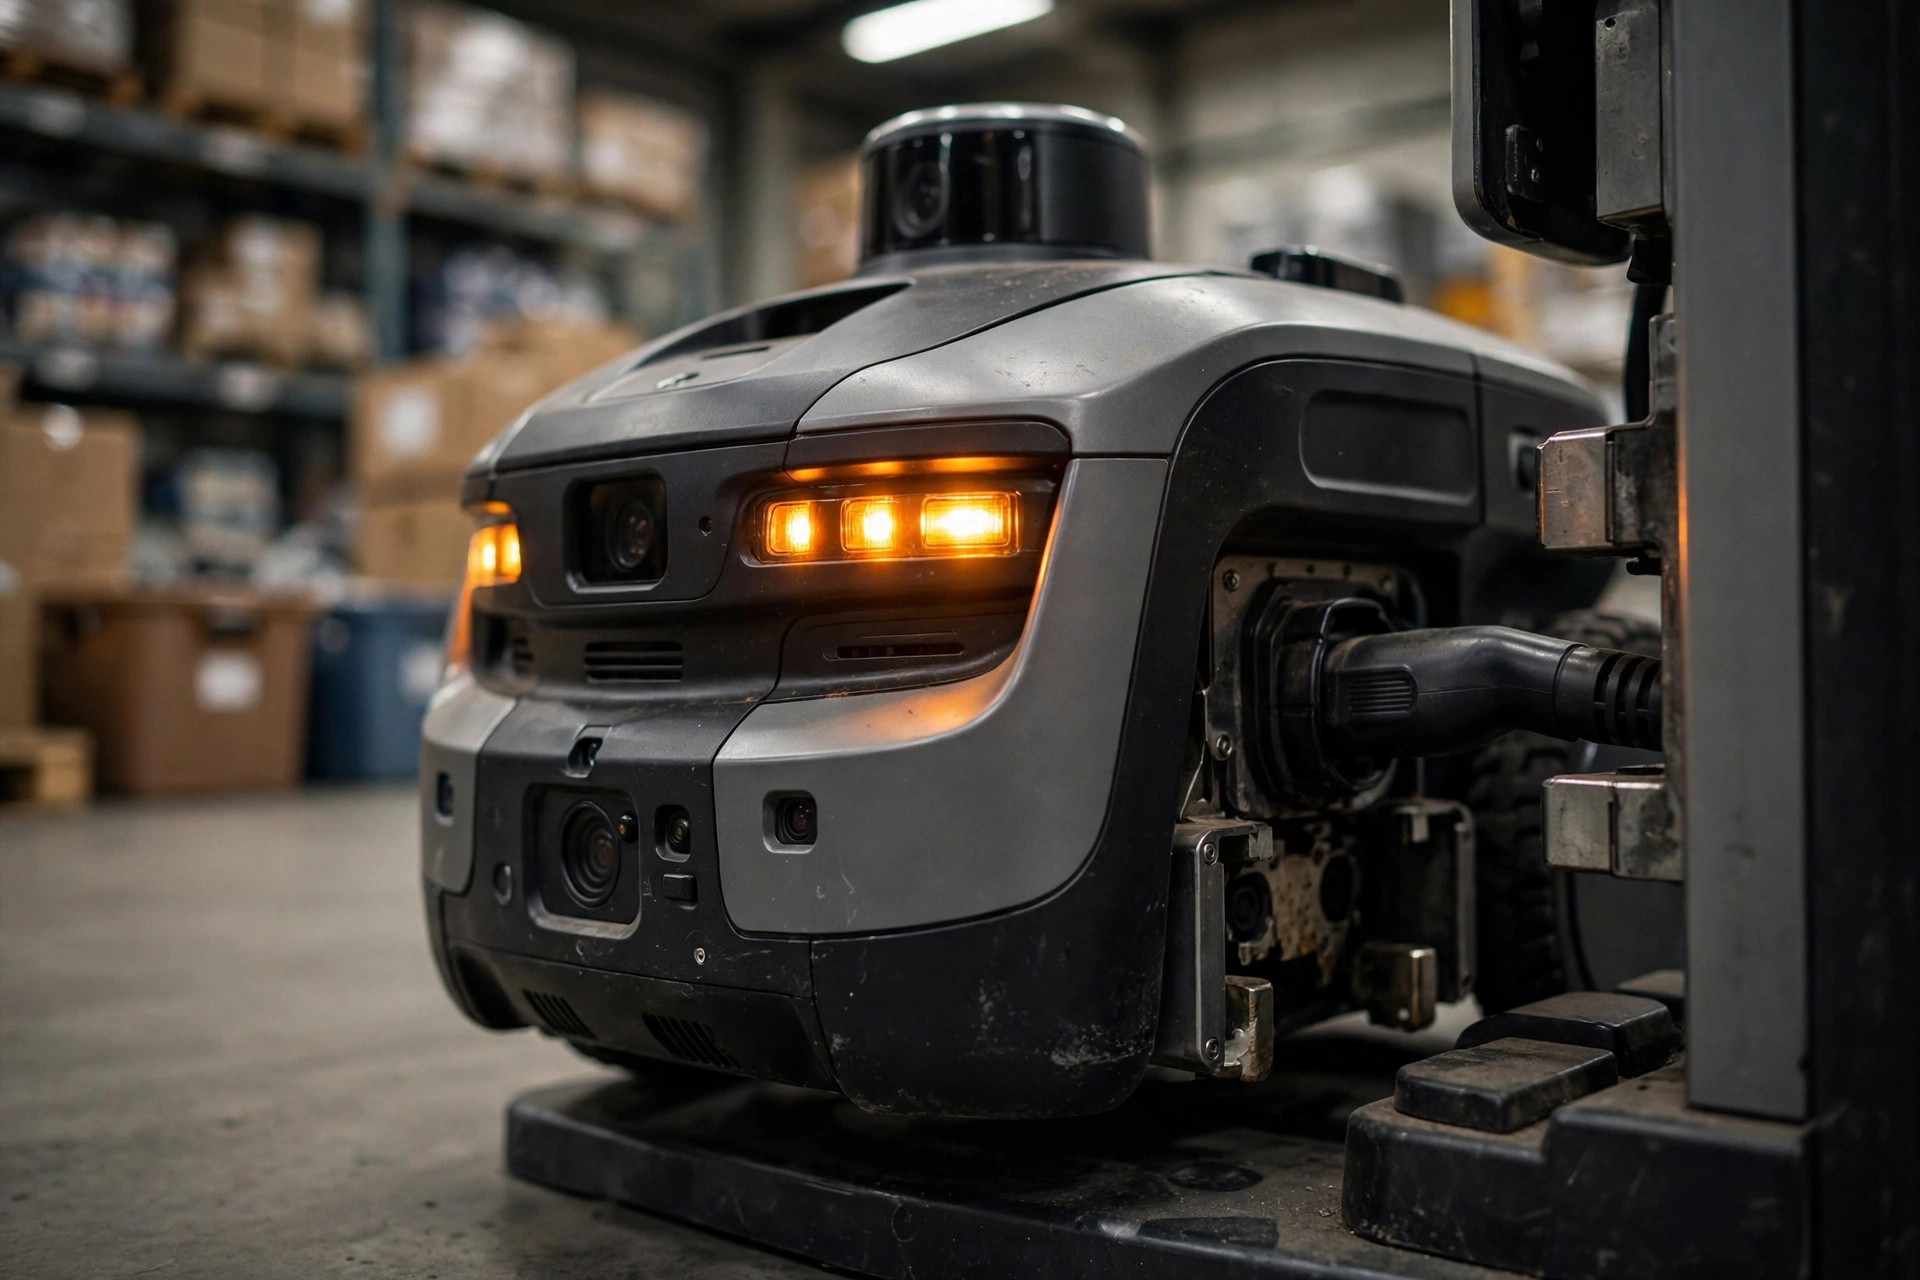
Now the Kunshan site. In 2024 an e-commerce warehouse deployed 15 of the same units at roughly ¥220,000 each — ¥3.3 million for the fleet. Integration at 25% added ¥825,000. Total investment: ¥4.125 million. The fleet replaced 15 people on two shifts, at a fully loaded monthly cost of ¥8,000 per person (including social insurance) × 12 months = ¥1.44 million per year. Annual operating cost: maintenance ¥165,000, software fees ¥150,000, allocated maintenance engineer ¥200,000 — ¥515,000 total. Net annual savings: ¥925,000. Payback: 4.125 ÷ 0.925 ≈ 4.5 years. A little over four years on the books.
Put the two ledgers side by side and the counter-intuitive conclusion falls out: the AMR payback period has almost nothing to do with the robot's unit price. Whether the unit costs $55,000 or $30,000 matters far less than the product of "fully loaded hourly wage × the robot's annual operating hours." Everyone haggles with vendors over unit price. What actually determines payback is how many shifts you run. In a single-shift warehouse, the robot sits idle 16 hours a day, and no price will ever pay back. That money is wasted.
Breaking down the cost structure: where the money goes
One-time investment:
| Item | Reference range | Notes |
|---|---|---|
| Hardware (fleet) | $30,000–$80,000 per unit | Public price range for small-payload AMRs; autonomous forklift models run $100,000–$150,000. Confirm against the vendor's latest quote |
| Software & integration | 20%–40% of hardware | WMS integration, map deployment, workflow commissioning; the older your systems, the uglier this gets |
| Hidden investment | 5%–15% of hardware | Floor QR codes/reflectors, Wi-Fi coverage, idle labor during the 2–6 month commissioning period |
Recurring annual operating cost:
| Item | Reference range |
|---|---|
| Maintenance | 5%–10% of hardware cost per year |
| Software license fees | Per contract, typically tens of thousands of dollars |
| Maintenance labor | 0.5–1 dedicated headcount at local salary levels |
The commissioning period is the danger zone: for the first few months the system is unstable, headcount drops by zero, and the robots create extra work. Almost nobody writes this cost into the ROI model, but it is real — anywhere from two months to half a year.
AMR payback period calculator: six numbers, fill them in yourself
| Input | What to enter |
|---|---|
| A Unit price | Vendor quote — use the latest quote |
| B Fleet size | Number of units |
| C Integration factor | 1.2–1.4 (add 20%–40% for software and integration) |
| D FTEs replaced per unit | Convert by shift to full-time equivalents, not headcount |
| E Fully loaded hourly wage | The employer's real cost, not the number on the job ad |
| F Annual operating cost | Maintenance + software fees + maintenance labor |
Payback (years) = A × B × C ÷ (D × E × annual hours − F)
Start annual hours at 2,080 (one full-time shift), multiply by 2 for two shifts, by 3 for three. Remember the robot is a 24-hour asset — shift coverage is its biggest lever, and it is the entire reason the two warehouses above differ by a factor of three.
The only three levers that matter
First, shifts. The same robot running three shifts logs three times the annual operating hours of a single-shift unit, and the payback period divides by three. This is the thickest lever in the whole table. If you can't fill two shifts, don't talk about AMRs — talk about scheduling.
Second, labor rate. $32 an hour fully loaded in California versus roughly $10 in Kunshan is what produced 16 months versus 4-plus years. That is not a management problem. It is arithmetic.
Third, buy versus lease. Monthly leasing converts the upfront investment into an operating expense, which suits warehouses with volatile order volumes that don't want to bet big. But long-term total cost typically runs 30%–50% above outright purchase (confirm against the vendor's latest quote). Stable volumes and a 5-plus-year horizon: buy. Piloting the technology or flexing up for peak season: lease.
One more trade-off most people get backwards: the biggest value of an AMR is not "replacing labor" — it is freeing labor from walking. A picker walks double-digit kilometers a day; the robot absorbs the dead walking and leaves the judgment and exception-handling to the human. Calculating ROI on "headcount replaced" understates the robot; "output per labor hour" is the fairer metric — but it's harder to quantify, so conservatively, my calculator only counts headcount replaced. If it pays back under that harsh math, the payback is real.
Here is the calculable conclusion to close with: fill in the six numbers. Under 2 years — buy. Two to three years — look at whether order growth over the next two years can push D higher. Over 3 years — fill your shifts and fix your slotting first, and put automation on hold. Remember this line: payback = total investment ÷ (annual labor cost − annual operating cost). Cutting the numerator by 10% never beats growing the denominator by 10%.
By Lao Zhou, Logistics Cost Analyst